

Abstract
Moringa isothiocyanate (MIC-1) is the main active isothiocyanate found in Moringa oleifera, a plant consumed as diet and traditional herbal medicine. Compared to sulforaphane (SFN), MICs are less studied and most work have focused on its anti-inflammatory activity. The purpose of this study is to better understand the Nrf2-ARE antioxidant activity of MIC-1 and its potential in diabetic nephropathy. MIC-1 showed little toxicity from 1.25–5 μM. MIC-1 activated Nrf2-ARE at similar levels to SFN. MIC-1 also increased gene expression of downstream Nrf2 genes NQO1, HO-1, and GCLC. Protein expression of HO-1 and GCLC was elevated in MIC-1 treated cells versus control. MIC-1 suppressed pro-inflammatory cytokines in LPS-stimulated macrophages. MIC-1 reduced levels of reactive oxygen species in high glucose (HG) treated human renal proximal tubule HK-2 cells. RNA-seq was performed to examine the transcriptome in HK-2 cells exposed to HG with or without MIC-1. Ingenuity Pathway Analysis (IPA) of RNA-seq on HK-2 cells exposed to HG identified TGFβ1 and NQO1 regulation as potentially impacted and treatment of HG-exposed HK-2 cells with MIC-1 reversed the gene expression of these two pathways. Results implicate that the transcriptional regulator TGFβ1 signaling is activated by HG and that MIC-1 can inhibit HG-stimulated TGFβ1 activation. In summary, MIC-1 activates Nrf2-ARE signaling, increases expression of Nrf2 target genes, and suppresses inflammation, while also reducing oxidative stress and possibly TGFβ1 signaling in high glucose induced renal cells. Taken together, it appears that one potential therapeutic strategy for managing DN and is currently under development in clinic is Nrf2 activation.
Keywords: Moringa, Isothiocyanates, diabetic nephropathy, Nrf2, oxidative stress
Introduction
Oxidative stress has been acknowledged as a factor in aging and disease and is implicated in many pathologies including cancer (1), diabetes (2), and neurodegeneration (3). Oxidative stress occurs when the balance between pro-oxidants and antioxidants tilts towards the pro-oxidant state which can be characterized as excess reactive oxygen species (ROS). ROS, either locally produced or from external sources, plays an important role in normal physiological processes (4) but excess ROS can damage cell structures that can contribute to disease (5). Therefore, organisms adapt elaborate systems to protect cells against oxidative stress and to maintain proper redox homeostasis.
Nuclear factor (erythroid-derived 2)-like 2 (Nrf2) has been identified as a master regulator of the antioxidant response due to its regulation of many downstream genes involved in counterbalancing oxidative stress (6). Downstream genes of Nrf2 that help provide cellular defense include phase II detoxifying enzymes heme oxygenase-1 (HO-1), NAD(P)H:quinone oxidoreductase 1 (NQO1), and glutamate cysteine ligase catalytic subunit (GCLC). Nrf2 regulated genes are mediated by cis-regulatory DNA sequences found in promoter and enhancer regions called antioxidant response elements (ARE) (7). The importance of Nrf2-ARE signaling in preventing a variety of diseases has been demonstrated in Nrf2 knockout mice models where loss of Nrf2 function increased susceptibility to diseases such as colorectal cancer (8), diabetic nephropathy (9), and chronic obstructive pulmonary disease (10). Accumulating evidence of Nrf2’s role in disease prevention has consequently helped identify Nrf2 activation as a potential strategy for preventing disease (6, 11–13).
Isothiocyanates (ITCs) is one source of compounds well-studied for activating Nrf2-ARE signaling and reducing oxidative stress (14). ITCs is a class of phytochemical compounds responsible for the health benefit of cruciferous vegetables (15). Limited available epidemiological evidence suggests higher intake of cruciferous vegetables reduces risk of lung, bladder, and colorectal cancer (16, 17). Among the different isothiocyanates, sulforaphane (SFN) was identified as being one of the most potent inducers of Nrf2 (18, 19). Preclinical studies show that SFN carries potential in breast cancer chemoprevention (20–22). Recently, SFN was found to lower fasting blood glucose and glycated hemoglobin in obese Type 2 diabetic subjects (23). Although SFN has been extensively studied and proven to possess benefits in many disease models, its chemical instability poses challenges (24, 25). One alternative is a group of stable ITCs derived from Moringa oleifera, a tropical plant used in traditional medicine as an anti-cancer, anti-inflammatory, and anti-diabetic agent (26, 27). Moringa ITCs (MICs) are solid compounds at room temperature with a rhamnose sugar that help confer MICs their atypical stability (28). Of the MICs, 4-(α-L-Rhamnosyloxy)-benzyl isothiocyanate (MIC-1), (Fig. 1.) is predominant and present only in moringa seeds. Extracts of moringa seeds enriched with ITCs exhibited anti-inflammatory (29) and antioxidant (30) activity, alleviated ulcerative colitis (31) and attenuated insulin resistance in mice fed high fat diet (32).
Fig. 1.

Chemical structures of sulforaphane and MIC-1
Diabetic nephropathy (DN) is the leading cause of end-stage renal disease (ESRD) accounting for half of all ESRD cases (33). Accumulating evidence suggests that inflammation and oxidative stress contribute to the development of DN (34–36) and that targeting Nrf2 is one potential modality for managing DN. Knockout of Nrf2 in diabetic mice abrogates Nrf2’s protective effect in DN and accelerates DN progression compared to wildtype mice (9). Nrf2 has been observed to ameliorate DN via transcriptional repression of TGFβ1, a key driver in DN pathogenesis (37). MG132, a proteasome inhibitor that activates Nrf2, improved renal parameters in diabetic mice and silencing of Nrf2 nullified protection of MG132 in high-glucose induced HK11 renal tubular cells (38). Bardoxolone methyl, a potent Nrf2 activator, has been studied in clinical trials of DN and preliminary results show increases in GFR for renally impaired patients with diabetes (39). Additional studies have shown SFN ameliorated DN via Nrf2 activation and that renal protection by SFN is lost when Nrf2 is silenced, emphasizing the critical role of Nrf2 in SFN mediated renal protection in DN (40–42). ITCs are thus a potential class of phytochemicals for managing DN.
Compared to SFN, research on MICs is scarce. But MICs mechanism of action is likely similar to other ITCs that activate Nrf2-ARE signaling. In this current study, we investigate the antioxidant properties of the chemically stable, principal ITC purified from moringa seed extract, MIC-1, and its effect on Nrf2-ARE signaling and its potential in DN.
Materials and methods
Materials
MIC-1 (98% purity) was kindly provided by Ilya Raskin (Rutgers University, New Brunswick). SFN was obtained from LKT Laboratories, Inc (St. Paul, MN), bicinchoninic acid assay (BSA) and bovine serum albumin (BSA) from Thermo Fisher Scientific (Rockford, IL). Dulbecco’s modified Eagle medium (DMEM), versene, and trypsin-EDTA (0.25%) were purchased from Gibco (Carlsbad, CA). Fetal bovine serum (FBS) was purchased from Gemini Bio Products (West Sacramento, CA). LPS was purchased from Enzo Life Sciences (Farmingdale, New York). β-actin (sc-47778) and GCLC (sc-390811) primary antibodies were purchased from Santa Cruz Biotechnology (Santa Cruz, CA), and HO-1 (ab68477) was purchased from Abcam (Cambridge, MA). Mouse secondary antibody was purchased from Santa Cruz Biotechnology and rabbit secondary antibody from Abcam.
Cell culture and treatment
HepG2-C8 human hepatocellular carcinoma cells were established and cultured as previously described (43, 44). RAW 264.7 mouse macrophage cells and human HK-2 renal proximal tubular cells were purchased from ATCC (Manassas, VA). HepG2-C8, RAW 264.7, and HK-2 cells were cultured in 10% FBS DMEM medium supplemented with 100 unit/mL penicillin and 100 μg/mL streptomycin at 37°C in 5% CO2 incubator. Cells were incubated in 1% FBS DMEM medium when treated with MIC-1 or SFN. HK-2 cells were seeded then subjected to serum-free DMEM for 24 hours prior to treatment with either low glucose (5.5 mM D-glucose) or high glucose (30 mM D-glucose) with or without MIC-1. Mannitol (24.5 mM) was added to low glucose media as an osmotic control.
Cell viability assay
HepG2-C8 cells were seeded in 96-well plates (1,000 cells/well). After 24 h, cells were treated with MIC-1 in varying concentrations ranging from 0.4 μM to 100 μM with 0.1% DMSO serving as control. The CellTiter 96® AQueous One Solution Cell Proliferation Assay (MTS assay) was used to assess cell viability (Promega, Madison, WI, USA). Absorbance at 490 nm was measured using an Infinite M200 PRO from Tecan (Männedorf, Switzerland)
ARE-Luciferase reporter assay
The ARE-luciferase was constructed in HepG2-C8 cells as previously described (43, 44). HepG2-C8 cells were seeded in 12-well plates at a density of 1 × 10⁵ cells/well. Following an overnight incubation, cells were treated with nontoxic concentrations of MIC-1 with SFN being used as an established positive control (45). After 24 h of treatment, cells were washed with ice-cold phosphate-buffered saline (1X PBS, pH 7.4) and collected in reporter lysis buffer (Promega, Madison, WI, USA) according to manufacturer’s instructions. Cell homogenates were centrifuged at 12,000 x rcf for 2 min at 4°C. Aliquots of supernatant were mixed with luciferase assay reagent (Promega, Madison, WI) and assayed for ARE-luciferase activity using a Lucetta Luminometer (Lonza, Basel, Switzerland). Luciferase activity was normalized to protein concentration and measured by BCA protein assay. Results are expressed as fold induction of luciferase activity over control DMSO group.
RNA extraction and quantitative real-time PCR
Total RNA was extracted from HepG2-C8 and RAW 264.7 cells using GeneJET RNA Purification Kits (Thermo Fisher Scientific, Rockford, IL). RNA concentrations were measured using Infinite M200 PRO and cDNA was synthesized using Taqman Reverse Transcription Reagents (Thermo Fisher Scientific, Rockford, IL). Quantitative real-time PCR was performed using Power SYBR Green PCR Master Mix reagents (Thermo Fisher Scientific, Rockford, IL). Gene expression levels were measured on a QuantStudio 5 Real-Time PCR System (Thermo Fisher Scientific, Rockford, IL) and quantified by comparative ΔΔCt method. Primer sequences are listed in Table 1.
Table I.
qPCR primers used in this study
| Gene | Forward | Reverse | Species |
|---|---|---|---|
| B-actin | TCCACCGCAAATGCTTCT | AGCCATGCCAATCTCATCTT | Human |
| NRF2 | GCCCAGTCTTCATTGCTACT | GTCCTGTTGCATACCGTCTAA | Human |
| NQO1 | GGAAGAAACGCCTGGAGAATA | AGAATCCTGCCTGGAAGTTTAG | Human |
| HO-1 | TCTTGGCTGGCTTCCTTAC | CATAGGCTCCTTCCTCCTTTC | Human |
| GCLC | CCCAAACCATCCTACCCTTT | CATGTTGGCCTCAACTGTATTG | Human |
| GAPDH | AGTGGCAAAGTGGAGATT | GTGGAGTCATACTGGAACA | Mouse |
| iNOS | CCTGGTACGGGCATTGCT | TGTCACCACCAGCAGTAGTTG | Mouse |
| IL-6 | CTTGGGACTGATGCTGGTGACA | GCCTCCGACTTGTGAAGTGGTA | Mouse |
| IL-1β | TGAAATGCCACCTTTTGACAG | GTCGTTGCTTGGTTCTCCTTGT | Mouse |
| TNF-α | ACAAGGCTGCCCCGACTAC | TGGAAGACTCCTCCCAGGTATATG | Mouse |
| MCP-1 | TTAAAAACCTGGATCGGAACCAA | GCATTAGCTTCAGATTTACGGGT | Mouse |
| IL-1A | TCTATGATGCAAGCTATGGCTCA | CGGCTCTCCTTGAAGGTGA | Mouse |
Western blotting
HepG2-C8 cells were collected and harvested in RIPA lysis buffer with protease inhibitors. Protein levels were measured by BCA assay and equal amounts of protein (20 μg) were mixed with Laemmli SDS sample buffer (Boston Bioproducts, Ashland, MA) and denatured at 95°C for 5 min. Protein from each sample were loaded and separated on 4–15% Criterion Tris-HCl gels (Bio-Rad, Hercules, CA) and transferred to polyvinylidene difluoride (PVDF) membrane (Millipore, Bedford, MA). Membranes were blocked with 5% BSA in Tris-buffered saline 0.1% Tween 20 (TBST) then incubated with primary antibodies recognizing HO-1 and GCLC overnight at 4°C. Primary antibodies were diluted at 1:500 for β-actin, 1:1000 for HO-1, and 1:250 for GCLC. After primary antibody incubation, the membrane was washed three times with TBST then incubated with secondary antibodies conjugated with horseradish peroxidase for 1 h at room temperature. Membranes were washed an additional three times and bands were visualized using SuperSignal enhanced chemoluminescence (ECL) reagents detected with a Bio-Rad Gel Documentation 2000 system.
Detection of ROS
HK-2 cells were cultured in 6-well plates and treated with either low glucose (LG), high glucose (HG), or HG plus MIC-1 at various concentrations for 24 hours. ROS was measured using 5-(and-6)-chloromethyl-2′,7′-dichlorodihydrofluorescein diacetate (CM-H2DCFDA, Invitrogen, Carlsbad, CA). Cells were incubated with 10 μM CM-H2DCFDA in serum-free medium for 30 min at 37°C and then washed three times with PBS. Cells were then collected and analyzed using flow cytometry (Beckman Coulter, Brea, CA)
RNA-seq
HK-2 cells were cultured and seeded similar to ROS detection and treated with LG, HG, or HG plus MIC-1 5μM for two days. RNA from three independent experiments were collected, pooled into one, and submitted to Genewiz (South Plainfield, NJ) for RNA-sequencing. Each sample was run at 150 bp PE with 40–45 M reads per sample on an Illumina HiSeq 2500. Sequencing reads from fastq files were aligned by Hisat2 (Version 2.1.0) (46) to the human genome hg19 and PCR duplicates were removed. Reads overlapping genomic features were counted by featureCounts (Version 1.5.1) (47) and analyzed for expression by DEGseq (48) in R (Version 3.5.0). Expression data was imported into Ingenuity Pathway Analysis (IPA) (Qiagen, Valencia, CA) for further analysis.
Statistical analysis
Analyses were performed using GraphPad Prism software, version 6.00 (Chicago, IL, USA). Data are presented as the mean ± standard deviation (SD). The statistical analyses were carried out using one-way analysis of variance (ANOVA) followed by post-hoc Dunnett’s test. P values less than 0.05 were considered statistically significant.
Results
Cytotoxicity of MIC-1
MTS assay was performed to determine the cytotoxic concentrations of MIC-1 in HepG2-C8 cells. HepG2-C8 cells were seeded overnight in 96-well plates and treated with varying concentrations of MIC-1 the next day for 24 h. The cell viability dramatically decreased starting at 25 μM of MIC-1 and further cytotoxicity was observed at 50 μM and 100 μM concentrations (Fig. 2a). Non-toxic concentrations of MIC-1 were selected for further studies.
Fig. 2.

Cell viability and induction of ARE-luciferase by MIC-1 in HepG2-C8 cells. a Cells were seeded in 96-well plates and incubated with MIC-1 for 24 h. Cytotoxicity of MIC-1 was determined by MTS assay. b HepG2-C8 cells were seeded and treated with 1.25, 2.5, and 5 μM of MIC-1 for 24 h with SFN 5 μM used as a positive control. Results were normalized to protein concentration and control. Results are mean ± SD (n = 3). * P < 0.05, *** P < 0.001 compared with control group.
MIC-1 induces ARE-Luciferase reporter activity
HepG2-C8 cells are HepG2 cells that were previously stably transfected with a pARE-TI-luciferase (44). Cells were seeded overnight and incubated the following day with non-toxic concentrations of MIC-1 and 5 μM SFN for 24 h. SFN served as positive control. MIC-1 induced ARE-Luciferase reporter activity in a dose-dependent manner from 1.25 μM up to 5 μM compared to DMSO control (Fig. 2b). At 1.25, 2.5, and 5 μM concentrations of MIC-1, ARE-Luciferase increased 3, 4.9, and 6.9-fold higher, respectively. Equal concentrations of 5 μM SFN and MIC-1 show that MIC-1 exhibited higher levels of ARE-Luciferase activity than SFN.
MIC-1 increases mRNA expression of Nrf2 and its downstream targets
Because MIC-1 induced ARE-Luciferase, the mRNA expression of Nrf2 and Nrf2 regulated genes HO-1, GCLC, and NQO1 were further investigated to evaluate if MIC-1 exerts antioxidant properties through the Nrf2 signaling pathway. qPCR was performed to measure mRNA expression with SFN used as a positive control. The observed results show that Nrf2, HO-1, and GCLC gene expression levels increased in a dose-dependent manner (Fig. 3a). However, for mRNA levels of Nrf2, only MIC-1 and SFN, both at 5 μM, displayed a significant increase compared to control. At 2.5 and 5 μM, MIC-1 exhibited higher expression levels of HO-1 and GCLC when compared to control. NQO1 mRNA expression was also elevated by MIC-1 and SFN at all concentrations but displayed no dose-dependent increase.
Fig. 3.

MIC-1 increases mRNA and protein expression of Nrf2 and its downstream genes. a HepG2-C8 cells were treated for 6 h with MIC-1. Induction of Nrf2, HO-1, GCLC, and NQO1 gene expression were normalized to negative control and expressed as fold induction. b Western blot images of downstream Nrf2 genes GCLC and HO-1. c HepG2-C8 cells were treated with MIC-1 for 24 h. An equal amount of protein from each cell lysate was used to determine protein expression relative to control. Protein expression level was normalized to β-actin control. Results are mean ± SD (n = 3). * P < 0.05, ** P < 0.01 compared with control group * P < 0.05, ** P < 0.01, *** P < 0.001 compared with control group.
MIC-1 increase protein expression of Nrf2 regulated genes, HO-1 and GCLC
Western blotting was performed to determine whether the increase in HO-1 and GCLC gene expression translated into increases in protein expression. Protein expression of HO-1 and GCLC were studied, with β-Actin serving as endogenous control. Treatment with MIC-1 and SFN show that both compounds can increase levels of HO-1 and GCLC protein (Fig. 3b). Protein expression of HO-1 increased with increasing concentrations of MIC-1. Similar to previous results, MIC-1 at 5 μM showed the highest increase in protein expression in HO-1 and GCLC proteins among the treatment groups (Fig. 3c).
MIC-1 suppresses LPS-induced expression of inflammatory genes
Previous studies on natural compounds (11, 49) and synthetic derivatives (50) activating Nrf2 antioxidant response have also been shown to possess anti-inflammatory properties. To investigate whether MIC-1 can also inhibit inflammation, LPS induced RAW 264.7 cell model was used to measure the anti-inflammatory effects of MIC-1. MIC-1’s anti-inflammatory potential was evaluated by measuring inflammatory genes iNOS, IL-6, IL-1β, TNF-α, MCP-1, and IL-1A. After 1 h of pretreatment with MIC-1 or SFN and 6 h stimulation of LPS, gene expression of inflammatory markers was quantified by qPCR (Fig. 4). In all genes except for TNF-α, MIC-1 decreased inflammatory genes in a dose-dependent manner. 5 μM MIC-1 and SFN displayed comparable decreases in IL-6, IL-1β, TNF-α, COX-2 (not shown) and MCP-1 mRNA expression.
Fig. 4.

MIC-1 decreases the LPS-stimulated production of iNOS, IL-6, IL-1β, TNF-α, MCP-1, and IL-1A in RAW 264.7 cells. RAW 264.7 cells were pretreated with MIC-1 for 1 hour and then stimulated with LPS (1 μg/mL) for a further 6 hours. Expression levels were quantified by quantitative RT-PCR. ## P < 0.01 compared with DMSO control group. Results are mean ± SD (n = 3). * P < 0.05, ** P < 0.01, *** P < 0.001 compared with LPS group.
MIC-1 reduces oxidative stress in in vitro diabetic nephropathy
Isothiocyanates such as sulforaphane have been reported to ameliorate DN partly due to Nrf2 regulation (41, 42). MIC-1 was tested for its potential to reduce oxidative stress in high-glucose stimulated HK-2 cells. HK-2 cells were seeded overnight and then incubated in serum-free DMEM medium for 24 hours. Cells were then treated with either LG, HG, or HG plus MIC-1 for 24 hours. Using flow cytometry, high glucose induced oxidative stress in HK-2 cells and MIC-1 reduced high-glucose induced ROS at 1.25, 2.5, and 5 μM (Fig 5).
Fig. 5.

MIC-1 reduces HG-induced ROS in HK-2 proximal tubule cells. HK-2 cells were treated with LG, HG, or HG plus MIC-1 at various concentrations for 24 hours. ROS levels were measured by flow cytometry and compared with LG control. Results are mean ± SD (n = 3). * P < 0.05, ** P < 0.01 compared with HG group
RNA-seq and IPA reveals high glucose (HG) activates TGFβ1 regulation and is reversed by MIC-1
RNA-seq analysis shows that exposure of human renal proximal tubular HK-2 cells to HG resulted in significantly upregulated and downregulated gene expression changes (Fig. 6a). Treatment of HG-exposed HK-2 cells with MIC-1 also shows significant gene expression changes (Fig. 6b) and that MIC-1 reverses the expression of genes stimulated by HG based on heatmap of top 100 opposing log2 fold-changes in gene expression in HK-2 cells between HG versus LG and MIC-1 versus HG (Fig. 6c; gene expression changes of HG compared to LG are shown on outer edge. Reversal of gene expression changes from MIC-1-HG is represented by the inner circle). MIC-1 treatment of HG-exposed HK-2 cells activates Nrf2-target genes such as NQO1 which could result in the reduction of oxidative stress in HK-2 cells and contribute to MIC-1’s overall antioxidant effect (Fig. 7a–b). Other downstream Nrf2 genes such as ABCC2, GSR, GTH1, FTL, and TXNRD1 were increased by MIC-1 treatment. Interestingly, HG stimulation shows activation of upstream regulator TGFβ1, a key driver in DN, based on downstream changes and comparison analysis of RNA-seq data in IPA suggests that MIC-1 may inhibit TGFβ1 activation from HG (Fig. 8a). Network analysis of connected upstream regulators appear to confirm the pattern of HG activation of TGFβ1 (Fig. 8b) and inhibition by MIC-1 (Fig. 8c).
Fig. 6.

Gene expression data from RNA-seq in HK-2 cells. MA plot of gene expression for all genes between a HG-LG and b MIC-1-HG comparisons. Colored dots indicate significant differences in gene expression (q-value less than 0.05). c Heatmap of top 100 opposing log2 fold-changes in gene expression in HK-2 cells between HG-LG and MIC-1-HG. Gene expression changes of HG compared to LG are shown on outer edge. Reversal of gene expression changes from MIC-1-HG is represented by the inner circle.
Fig. 7.
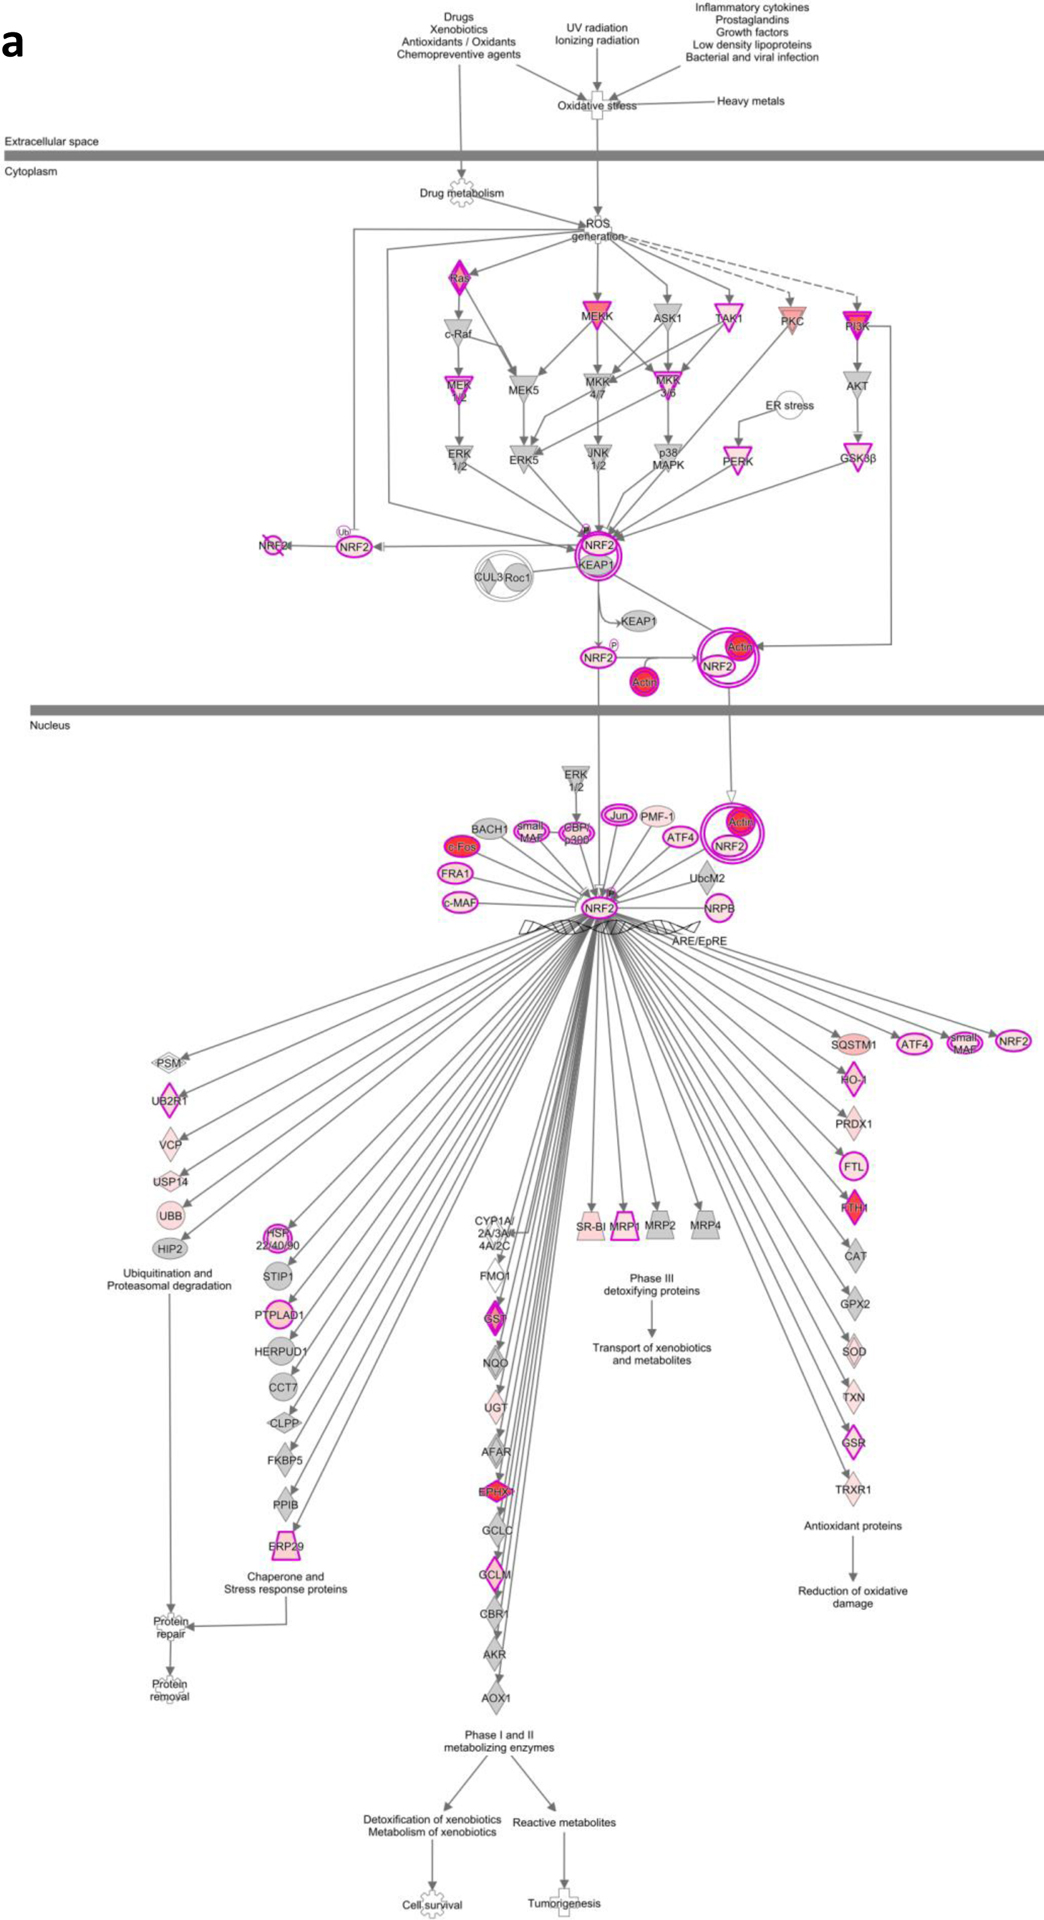
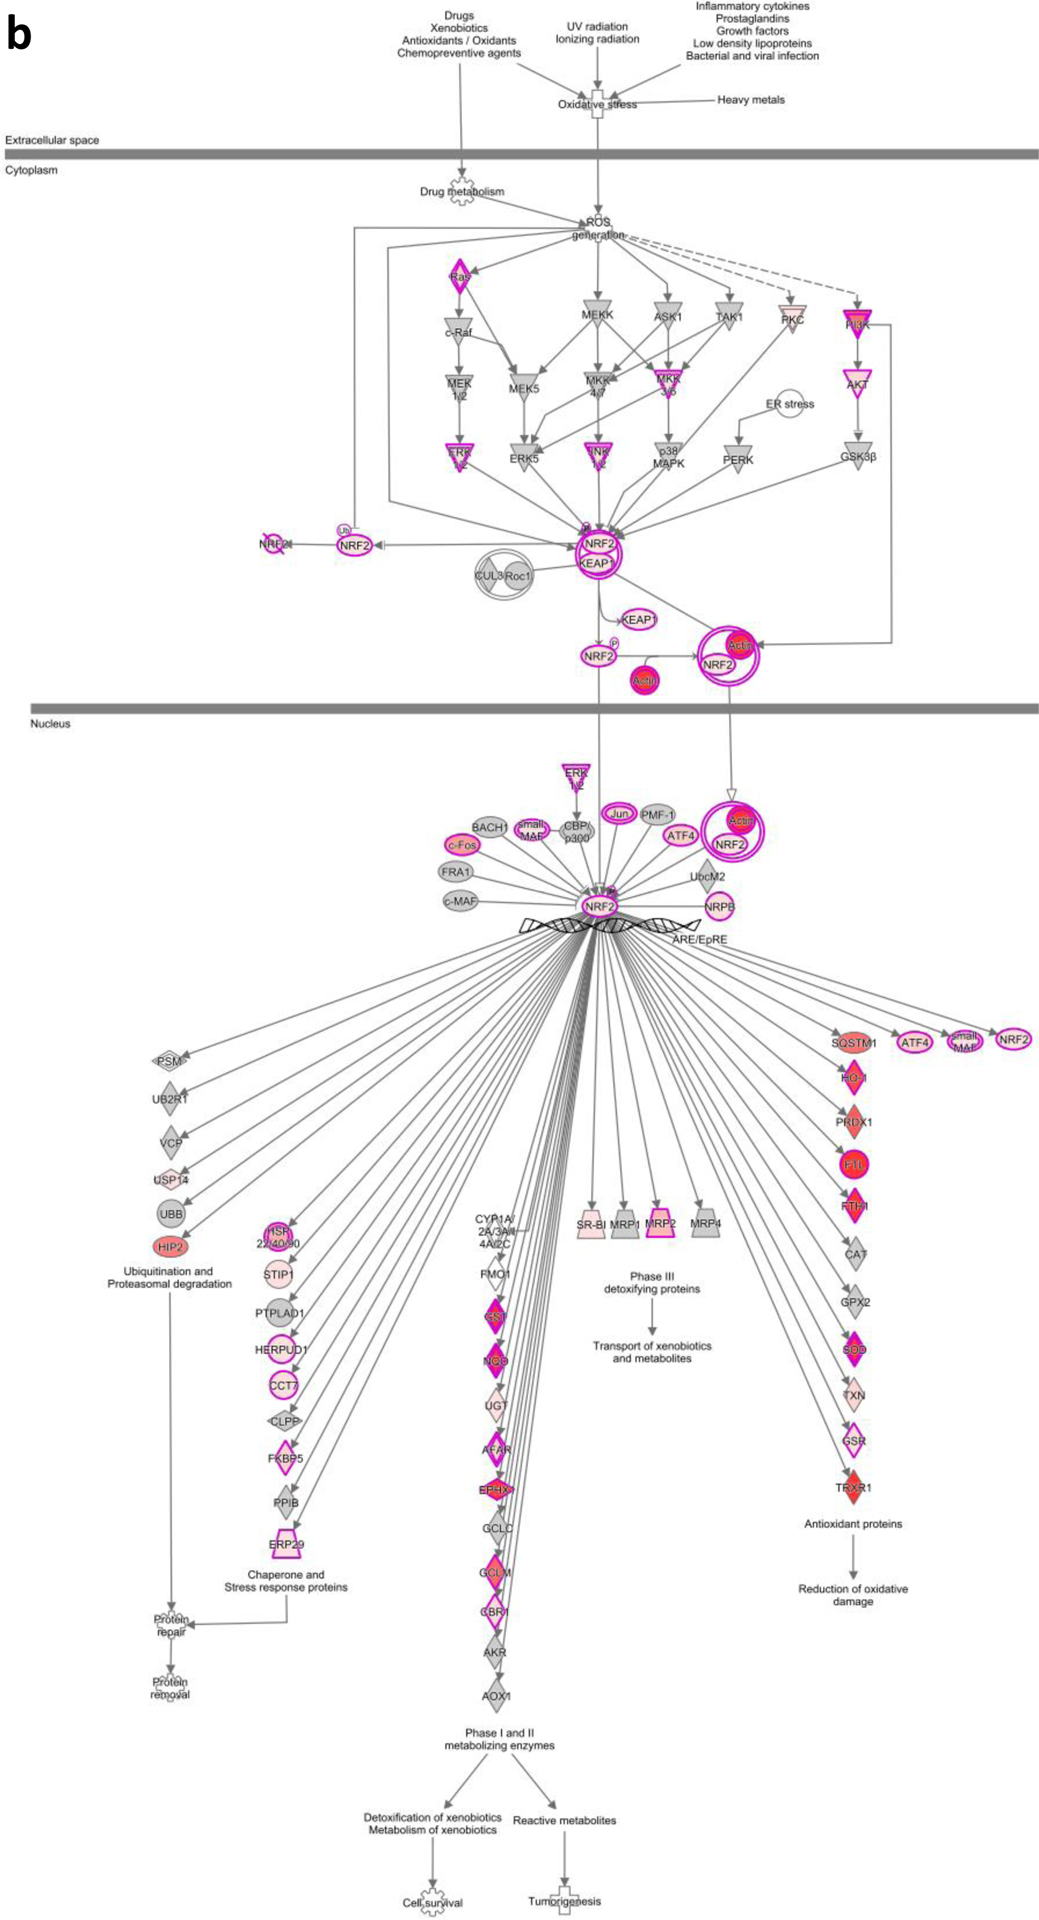
IPA of the NRF2 mediated oxidative stress pathway by a high glucose and b MIC-1
Fig. 8.

Upstream regulator analysis in HK-2 cells treated with HG or HG plus MIC-1. a Comparison analysis of upstream regulators identifies TGFβ1 as regulator activated by HG and inhibited in HG plus MIC-1 treated HK-2 cells. Mechanistic networks of connected upstream regulators in b HG stimulated HK-2 cells and c HG plus MIC-1 treated HK-2 cells. Orange indicates activation of transcriptional regulator, blue indicates inhibition.
Discussion
MIC-1 is a natural, more stable analog of ITCs than ITCs traditionally derived from cruciferous vegetables due to an attached sugar moiety. It has been recently reported that MICs from Moringa oleifera possess anti-inflammatory properties, however its antioxidant properties are less studied. Moringa oleifera is traditionally used as an anti-diabetic herbal medicinal product but it is not known whether MIC-1 can reduce ROS in a diabetic environment such as DN. Here, we investigate the major, principal ITC in moringa, MIC-1, its antioxidant properties through Nrf2 activation and its potential to reduce oxidative stress in DN.
Most research regarding MIC-1 has focused on its anti-inflammatory properties. Reduced TNF-α in spinal cord tissue was observed in mice receiving MICs compared to control in a mouse model of multiple sclerosis (51). This may be in part due to normalizing Wnt-β-catenin signaling and decreasing GSK3β. A decrease in IL-1β, IL-6, and COX-2 was also observed in MIC-treated mice (52). In a mouse model of ulcerative colitis, an extract enriched with MICs suppressed IL-6, iNOS, and TNF-α and relieved symptoms (31). We observed similar reductions of pro-inflammatory markers iNOS, IL-6, IL-1β, TNF-α, MCP-1, IL-1A, and COX-2 in LPS stimulated macrophages at comparable efficacy to SFN. These results along with others further strengthen the role of anti-inflammation in MICs pharmacological effects.
Most efforts have focused on the anti-inflammatory properties of MICs, but its antioxidant properties are less known. Nrf2, a transcription factor known to regulate antioxidant response, was upregulated in MICs-treated mice in multiple sclerosis (52). MIC-enriched extracts have been shown to induce antioxidant NQO1 activity (30). In this study, MIC-1 displayed similar or higher gene expression of Nrf2, HO-1, GCLC, and NQO1 along with higher protein levels of HO-1 and GCLC. Nrf2-ARE induction was also higher in MIC-1 at 5 μM versus SFN 5 μM. The concentrations of 1.25–5 μM used in this study is about 5 to 6-fold lower than the IC50 of about 25–30 μM. In ApcMin/+ mice fed dietary SFN, strong chemopreventive effects were observed and the total SFN and SFN glutathione concentrations in plasma and small intestine tissue were 3–10 μM (53). Because concentrations in cell lines needed to activate Nrf2-ARE signaling are generally higher than in vivo concentrations, it is reasonable that the concentrations used in this study are translatable to effective in vivo concentrations (54). Together, these results suggest that the antioxidant activity of MIC-1 is mediated by Nrf2 and that its bioactivity is similar to SFN. The anti-inflammatory and antioxidant activities of many compounds are closely linked (55). The anti-inflammatory effects of MIC-1 could be due to Nrf2 activation, as Nrf2 −/− macrophages treated with SFN do not show similar anti-inflammatory activity as Nrf2 +/+ macrophages (49). Dimethyl furate, a Nrf2 activator, is an FDA approved drug for multiple sclerosis partly due to its anti-inflammatory effects (56). Interestingly, Nrf2 has also been found to directly suppress inflammatory cytokines IL-6 and IL-1β in mouse macrophages independent of ROS levels. Chemical activation of Nrf2 induces direct Nrf2 binding near inflammatory genes and blocking RNA polymerase II recruitment (57), suggesting a new anti-inflammatory mechanism of Nrf2. Further work is needed to explain the mechanisms of Nrf2 and inflammation crosstalk.
Excessive oxidative stress and inflammation is a contributor to chronic kidney disease (CKD) and diabetic nephropathy (DN); Nrf2 has been identified as a key potential target for DN prevention (36, 58, 59). The promise of Nrf2 activation in reducing oxidative stress and inflammation in DN has led to studies using bardoxolone methyl, a potent, synthetic Nrf2 activator tested in clinical trials. Although bardoxlone methyl improved estimated glomerular filtration rate in advanced CKD patients with type 2 diabetes (60), a larger phase III trial (BEACON) was terminated prematurely over cardiovascular events, dampening enthusiasm (61). Despite setbacks, interest in Nrf2-based therapies has revived. Post-hoc analysis of BEACON identified elevated B-type natriuretic peptide and prior hospitalization due to heart failure as 2 major predictors for fluid overload (62) and that fluid overload, not direct toxicity of bardoxolone methyl, may have caused poor heart failure outcomes observed in BEACON (63). Risk of heart failure is similar between bardoxolone-methyl treated and placebo when excluding patients with these risk factors (62). This has helped inform better trial design (64) in TSUBAKI, a phase 2 trial of type 2 diabetics and stage 3 and 4 CKD but without risk factors. Preliminary data in TSUBAKI showed bardoxolone methyl increases GFR after 16 weeks of treatment without raising risk of fluid overload (65) and post-hoc analysis of BEACON shows durable increases in GFR and reduction in adverse renal outcomes and endpoints (39). Similar to bardoxolone methyl, activation of Nrf2 by natural phytochemicals such as sulforaphane show reduction in DN severity (40, 42, 66). To study MIC-1 in DN, HK-2 cells incubated with HG were used. Although immortalized cell lines such as HK-2 cells have limitations such as changes in cellular morphology, loss of cell polarity, changes in intracellular protein expression and limitations in transporter studies (67), studies in HK-2 cells have significantly improved understanding of mechanisms in DN and is a commonly used in vitro model for DN (68). Like SFN and bardoxolone methyl, MIC-1 reduces oxidative stress in an in vitro DN model and activates genes such as NQO1, suggesting that MIC-1’s antioxidant activity in DN may also be mediated by Nrf2. RNA-seq transcriptomic analysis of the impact by HG and MIC-1 in human renal proximal tubule HK-2 cells shows that Nrf2-mediated oxidative stress response and TGFβ1 signaling pathways are impacted by HG challenge and that MIC-1 reverses these two phenomena. These results suggest that MIC-1 activates Nrf2-mediated anti-oxidative stress pathway while inhibiting the activation of TGFβ1 regulation stimulated by HG as indicated by upstream analysis of HK-2 transcriptome in IPA. Future studies on the biological significance of our current RNA-seq results would be needed to confirm and validate these observations in DN patients.
Conclusions
MIC-1 displays strong induction of Nrf2-ARE antioxidant response while also showing anti-inflammatory activity. Early evidence suggests that MIC-1 can reduce HG induced oxidative stress in DN but more work needs to be done to fully understand MIC-1’s potential in DN. Because SFN and MIC-1 share a similar ITC pharmacophore, it is reasonable to assume they have similar mechanisms (69) and that their antioxidant and anti-inflammation effects could be applicable to a range of oxidative stress or inflammatory driven diseases. Though MIC-1 activates Nrf2-ARE and downstream genes, the interplay of Nrf2 and anti-inflammation requires further investigation (55) and how this may translate to diseases such as DN.
Acknowledgments
This work was supported by institutional funds to ANK.
References:
- 1.Sosa V, Moline T, Somoza R, Paciucci R, Kondoh H, ME LL. Oxidative stress and cancer: an overview. Ageing Res Rev. 2013;12(1):376–90. [DOI] [PubMed] [Google Scholar]
- 2.Wright E Jr., Scism-Bacon JL, Glass LC. Oxidative stress in type 2 diabetes: the role of fasting and postprandial glycaemia. Int J Clin Pract. 2006;60(3):308–14. [DOI] [PMC free article] [PubMed] [Google Scholar]
- 3.Andersen JK. Oxidative stress in neurodegeneration: cause or consequence? Nat Med. 2004;10 Suppl:S18–25. [DOI] [PubMed] [Google Scholar]
- 4.Finkel T Signal transduction by reactive oxygen species. J Cell Biol. 2011;194(1):7–15. [DOI] [PMC free article] [PubMed] [Google Scholar]
- 5.Willcox JK, Ash SL, Catignani GL. Antioxidants and prevention of chronic disease. Crit Rev Food Sci Nutr. 2004;44(4):275–95. [DOI] [PubMed] [Google Scholar]
- 6.Ma Q Role of nrf2 in oxidative stress and toxicity. Annu Rev Pharmacol Toxicol. 2013;53:401–26. [DOI] [PMC free article] [PubMed] [Google Scholar]
- 7.Hu R, Saw CL, Yu R, Kong AN. Regulation of NF-E2-related factor 2 signaling for cancer chemoprevention: antioxidant coupled with antiinflammatory. Antioxid Redox Signal. 2010;13(11):1679–98. [DOI] [PMC free article] [PubMed] [Google Scholar]
- 8.Khor TO, Huang MT, Prawan A, Liu Y, Hao X, Yu S, et al. Increased susceptibility of Nrf2 knockout mice to colitis-associated colorectal cancer. Cancer Prev Res (Phila). 2008;1(3):187–91. [DOI] [PMC free article] [PubMed] [Google Scholar]
- 9.Jiang T, Huang Z, Lin Y, Zhang Z, Fang D, Zhang DD. The protective role of Nrf2 in streptozotocin-induced diabetic nephropathy. Diabetes. 2010;59(4):850–60. [DOI] [PMC free article] [PubMed] [Google Scholar]
- 10.Iizuka T, Ishii Y, Itoh K, Kiwamoto T, Kimura T, Matsuno Y, et al. Nrf2-deficient mice are highly susceptible to cigarette smoke-induced emphysema. Genes Cells. 2005;10(12):1113–25. [DOI] [PubMed] [Google Scholar]
- 11.Khor TO, Yu S, Kong AN. Dietary cancer chemopreventive agents - targeting inflammation and Nrf2 signaling pathway. Planta Med. 2008;74(13):1540–7. [DOI] [PubMed] [Google Scholar]
- 12.Li W, Kong AN. Molecular mechanisms of Nrf2-mediated antioxidant response. Mol Carcinog. 2009;48(2):91–104. [DOI] [PMC free article] [PubMed] [Google Scholar]
- 13.Hybertson BM, Gao B, Bose SK, McCord JM. Oxidative stress in health and disease: the therapeutic potential of Nrf2 activation. Mol Aspects Med. 2011;32(4–6):234–46. [DOI] [PubMed] [Google Scholar]
- 14.Fuentes F, Paredes-Gonzalez X, Kong AN. Dietary Glucosinolates Sulforaphane, Phenethyl Isothiocyanate, Indole-3-Carbinol/3,3’-Diindolylmethane: Anti-Oxidative Stress/Inflammation, Nrf2, Epigenetics/Epigenomics and In Vivo Cancer Chemopreventive Efficacy. Curr Pharmacol Rep. 2015;1(3):179–96. [DOI] [PMC free article] [PubMed] [Google Scholar]
- 15.Dinkova-Kostova AT, Kostov RV. Glucosinolates and isothiocyanates in health and disease. Trends Mol Med. 2012;18(6):337–47. [DOI] [PubMed] [Google Scholar]
- 16.Higdon JV, Delage B, Williams DE, Dashwood RH. Cruciferous vegetables and human cancer risk: epidemiologic evidence and mechanistic basis. Pharmacol Res. 2007;55(3):224–36. [DOI] [PMC free article] [PubMed] [Google Scholar]
- 17.Tang L, Zirpoli GR, Guru K, Moysich KB, Zhang Y, Ambrosone CB, et al. Consumption of raw cruciferous vegetables is inversely associated with bladder cancer risk. Cancer Epidemiol Biomarkers Prev. 2008;17(4):938–44. [DOI] [PubMed] [Google Scholar]
- 18.Kensler TW, Egner PA, Agyeman AS, Visvanathan K, Groopman JD, Chen JG, et al. Keap1-nrf2 signaling: a target for cancer prevention by sulforaphane. Top Curr Chem. 2013;329:163–77. [DOI] [PMC free article] [PubMed] [Google Scholar]
- 19.Zhang Y, Talalay P, Cho CG, Posner GH. A major inducer of anticarcinogenic protective enzymes from broccoli: isolation and elucidation of structure. Proc Natl Acad Sci U S A. 1992;89(6):2399–403. [DOI] [PMC free article] [PubMed] [Google Scholar]
- 20.Jackson SJ, Singletary KW. Sulforaphane: a naturally occurring mammary carcinoma mitotic inhibitor, which disrupts tubulin polymerization. Carcinogenesis. 2004;25(2):219–27. [DOI] [PubMed] [Google Scholar]
- 21.Singletary K, MacDonald C. Inhibition of benzo[a]pyrene- and 1,6-dinitropyrene-DNA adduct formation in human mammary epithelial cells bydibenzoylmethane and sulforaphane. Cancer Lett. 2000;155(1):47–54. [DOI] [PubMed] [Google Scholar]
- 22.Cornblatt BS, Ye L, Dinkova-Kostova AT, Erb M, Fahey JW, Singh NK, et al. Preclinical and clinical evaluation of sulforaphane for chemoprevention in the breast. Carcinogenesis. 2007;28(7):1485–90. [DOI] [PubMed] [Google Scholar]
- 23.Axelsson AS, Tubbs E, Mecham B, Chacko S, Nenonen HA, Tang Y, et al. Sulforaphane reduces hepatic glucose production and improves glucose control in patients with type 2 diabetes. Sci Transl Med. 2017;9(394). [DOI] [PubMed] [Google Scholar]
- 24.Franklin SJ, Dickinson SE, Karlage KL, Bowden GT, Myrdal PB. Stability of sulforaphane for topical formulation. Drug Dev Ind Pharm. 2014;40(4):494–502. [DOI] [PMC free article] [PubMed] [Google Scholar]
- 25.Jeong WS, Jun M, Kong AN. Nrf2: a potential molecular target for cancer chemoprevention by natural compounds. Antioxid Redox Signal. 2006;8(1–2):99–106. [DOI] [PubMed] [Google Scholar]
- 26.Bennett RN, Mellon FA, Foidl N, Pratt JH, Dupont MS, Perkins L, et al. Profiling glucosinolates and phenolics in vegetative and reproductive tissues of the multi-purpose trees Moringa oleifera L. (horseradish tree) and Moringa stenopetala L. J Agric Food Chem. 2003;51(12):3546–53. [DOI] [PubMed] [Google Scholar]
- 27.Leone A, Spada A, Battezzati A, Schiraldi A, Aristil J, Bertoli S. Cultivation, Genetic, Ethnopharmacology, Phytochemistry and Pharmacology of Moringa oleifera Leaves: An Overview. Int J Mol Sci. 2015;16(6):12791–835. [DOI] [PMC free article] [PubMed] [Google Scholar]
- 28.Brunelli D, Tavecchio M, Falcioni C, Frapolli R, Erba E, Iori R, et al. The isothiocyanate produced from glucomoringin inhibits NF-kB and reduces myeloma growth in nude mice in vivo. Biochem Pharmacol. 2010;79(8):1141–8. [DOI] [PubMed] [Google Scholar]
- 29.Waterman C, Cheng DM, Rojas-Silva P, Poulev A, Dreifus J, Lila MA, et al. Stable, water extractable isothiocyanates from Moringa oleifera leaves attenuate inflammation in vitro. Phytochemistry. 2014;103:114–22. [DOI] [PMC free article] [PubMed] [Google Scholar]
- 30.Tumer TB, Rojas-Silva P, Poulev A, Raskin I, Waterman C. Direct and indirect antioxidant activity of polyphenol- and isothiocyanate-enriched fractions from Moringa oleifera. J Agric Food Chem. 2015;63(5):1505–13. [DOI] [PMC free article] [PubMed] [Google Scholar]
- 31.Kim Y, Wu AG, Jaja-Chimedza A, Graf BL, Waterman C, Verzi MP, et al. Isothiocyanate-enriched moringa seed extract alleviates ulcerative colitis symptoms in mice. PLoS One. 2017;12(9):e0184709. [DOI] [PMC free article] [PubMed] [Google Scholar]
- 32.Waterman C, Rojas-Silva P, Tumer TB, Kuhn P, Richard AJ, Wicks S, et al. Isothiocyanate-rich Moringa oleifera extract reduces weight gain, insulin resistance, and hepatic gluconeogenesis in mice. Mol Nutr Food Res. 2015;59(6):1013–24. [DOI] [PMC free article] [PubMed] [Google Scholar]
- 33.Tuttle KR, Bakris GL, Bilous RW, Chiang JL, de Boer IH, Goldstein-Fuchs J, et al. Diabetic kidney disease: a report from an ADA Consensus Conference. Am J Kidney Dis. 2014;64(4):510–33. [DOI] [PubMed] [Google Scholar]
- 34.Mora C, Navarro JF. Inflammation and diabetic nephropathy. Curr Diab Rep. 2006;6(6):463–8. [DOI] [PubMed] [Google Scholar]
- 35.Park SH, Choi HJ, Lee JH, Woo CH, Kim JH, Han HJ. High glucose inhibits renal proximal tubule cell proliferation and involves PKC, oxidative stress, and TGF-beta 1. Kidney Int. 2001;59(5):1695–705. [DOI] [PubMed] [Google Scholar]
- 36.Kashihara N, Haruna Y, Kondeti VK, Kanwar YS. Oxidative stress in diabetic nephropathy. Curr Med Chem. 2010;17(34):4256–69. [DOI] [PMC free article] [PubMed] [Google Scholar]
- 37.Gao P, Li L, Ji L, Wei Y, Li H, Shang G, et al. Nrf2 ameliorates diabetic nephropathy progression by transcriptional repression of TGFbeta1 through interactions with c-Jun and SP1. Biochimica et biophysica acta. 2014;1839(11):1110–20. [DOI] [PubMed] [Google Scholar]
- 38.Cui W, Li B, Bai Y, Miao X, Chen Q, Sun W, et al. Potential role for Nrf2 activation in the therapeutic effect of MG132 on diabetic nephropathy in OVE26 diabetic mice. American journal of physiology Endocrinology and metabolism. 2013;304(1):E87–99. [DOI] [PubMed] [Google Scholar]
- 39.Chin MP, Bakris GL, Block GA, Chertow GM, Goldsberry A, Inker LA, et al. Bardoxolone Methyl Improves Kidney Function in Patients with Chronic Kidney Disease Stage 4 and Type 2 Diabetes: Post-Hoc Analyses from Bardoxolone Methyl Evaluation in Patients with Chronic Kidney Disease and Type 2 Diabetes Study. Am J Nephrol. 2018;47(1):40–7. [DOI] [PMC free article] [PubMed] [Google Scholar]
- 40.Shang G, Tang X, Gao P, Guo F, Liu H, Zhao Z, et al. Sulforaphane attenuation of experimental diabetic nephropathy involves GSK-3 beta/Fyn/Nrf2 signaling pathway. J Nutr Biochem. 2015;26(6):596–606. [DOI] [PubMed] [Google Scholar]
- 41.Cui W, Bai Y, Miao X, Luo P, Chen Q, Tan Y, et al. Prevention of diabetic nephropathy by sulforaphane: possible role of Nrf2 upregulation and activation. Oxid Med Cell Longev. 2012;2012:821936. [DOI] [PMC free article] [PubMed] [Google Scholar]
- 42.Zheng H, Whitman SA, Wu W, Wondrak GT, Wong PK, Fang D, et al. Therapeutic potential of Nrf2 activators in streptozotocin-induced diabetic nephropathy. Diabetes. 2011;60(11):3055–66. [DOI] [PMC free article] [PubMed] [Google Scholar]
- 43.Yu R, Lei W, Mandlekar S, Weber MJ, Der CJ, Wu J, et al. Role of a mitogen-activated protein kinase pathway in the induction of phase II detoxifying enzymes by chemicals. J Biol Chem. 1999;274(39):27545–52. [DOI] [PubMed] [Google Scholar]
- 44.Yu R, Mandlekar S, Lei W, Fahl WE, Tan TH, Kong AN. p38 mitogen-activated protein kinase negatively regulates the induction of phase II drug-metabolizing enzymes that detoxify carcinogens. J Biol Chem. 2000;275(4):2322–7. [DOI] [PubMed] [Google Scholar]
- 45.Saw CL, Guo Y, Yang AY, Paredes-Gonzalez X, Ramirez C, Pung D, et al. The berry constituents quercetin, kaempferol, and pterostilbene synergistically attenuate reactive oxygen species: involvement of the Nrf2-ARE signaling pathway. Food Chem Toxicol. 2014;72:303–11. [DOI] [PubMed] [Google Scholar]
- 46.Kim D, Langmead B, Salzberg SL. HISAT: a fast spliced aligner with low memory requirements. Nat Methods. 2015;12(4):357–60. [DOI] [PMC free article] [PubMed] [Google Scholar]
- 47.Liao Y, Smyth GK, Shi W. featureCounts: an efficient general purpose program for assigning sequence reads to genomic features. Bioinformatics. 2014;30(7):923–30. [DOI] [PubMed] [Google Scholar]
- 48.Wang L, Feng Z, Wang X, Wang X, Zhang X. DEGseq: an R package for identifying differentially expressed genes from RNA-seq data. Bioinformatics. 2010;26(1):136–8. [DOI] [PubMed] [Google Scholar]
- 49.Lin W, Wu RT, Wu T, Khor TO, Wang H, Kong AN. Sulforaphane suppressed LPS-induced inflammation in mouse peritoneal macrophages through Nrf2 dependent pathway. Biochem Pharmacol. 2008;76(8):967–73. [DOI] [PMC free article] [PubMed] [Google Scholar]
- 50.Thimmulappa RK, Scollick C, Traore K, Yates M, Trush MA, Liby KT, et al. Nrf2-dependent protection from LPS induced inflammatory response and mortality by CDDO-Imidazolide. Biochem Biophys Res Commun. 2006;351(4):883–9. [DOI] [PMC free article] [PubMed] [Google Scholar]
- 51.Galuppo M, Giacoppo S, De Nicola GR, Iori R, Navarra M, Lombardo GE, et al. Antiinflammatory activity of glucomoringin isothiocyanate in a mouse model of experimental autoimmune encephalomyelitis. Fitoterapia. 2014;95:160–74. [DOI] [PubMed] [Google Scholar]
- 52.Giacoppo S, Soundara Rajan T, De Nicola GR, Iori R, Bramanti P, Mazzon E. Moringin activates Wnt canonical pathway by inhibiting GSK3beta in a mouse model of experimental autoimmune encephalomyelitis. Drug Des Devel Ther. 2016;10:3291–304. [DOI] [PMC free article] [PubMed] [Google Scholar]
- 53.Hu R, Khor TO, Shen G, Jeong WS, Hebbar V, Chen C, et al. Cancer chemoprevention of intestinal polyposis in ApcMin/+ mice by sulforaphane, a natural product derived from cruciferous vegetable. Carcinogenesis. 2006;27(10):2038–46. [DOI] [PubMed] [Google Scholar]
- 54.Ramirez CN, Li W, Zhang C, Wu R, Su S, Wang C, et al. In Vitro-In Vivo Dose Response of Ursolic Acid, Sulforaphane, PEITC, and Curcumin in Cancer Prevention. AAPS J. 2017;20(1):19. [DOI] [PMC free article] [PubMed] [Google Scholar]
- 55.Zhu H, Jia Z, Li YR. Nrf2 Signaling in Macrophages. React Oxyg Species (Apex). 2016;2(6):417–20. [DOI] [PMC free article] [PubMed] [Google Scholar]
- 56.Gold R, Kappos L, Arnold DL, Bar-Or A, Giovannoni G, Selmaj K, et al. Placebo-controlled phase 3 study of oral BG-12 for relapsing multiple sclerosis. N Engl J Med. 2012;367(12):1098–107. [DOI] [PubMed] [Google Scholar]
- 57.Kobayashi EH, Suzuki T, Funayama R, Nagashima T, Hayashi M, Sekine H, et al. Nrf2 suppresses macrophage inflammatory response by blocking proinflammatory cytokine transcription. Nat Commun. 2016;7:11624. [DOI] [PMC free article] [PubMed] [Google Scholar]
- 58.Cui W, Min X, Xu X, Du B, Luo P. Role of Nuclear Factor Erythroid 2-Related Factor 2 in Diabetic Nephropathy. J Diabetes Res. 2017;2017:3797802. [DOI] [PMC free article] [PubMed] [Google Scholar]
- 59.Shelton LM, Lister A, Walsh J, Jenkins RE, Wong MH, Rowe C, et al. Integrated transcriptomic and proteomic analyses uncover regulatory roles of Nrf2 in the kidney. Kidney Int. 2015;88(6):1261–73. [DOI] [PMC free article] [PubMed] [Google Scholar]
- 60.Pergola PE, Raskin P, Toto RD, Meyer CJ, Huff JW, Grossman EB, et al. Bardoxolone methyl and kidney function in CKD with type 2 diabetes. N Engl J Med. 2011;365(4):327–36. [DOI] [PubMed] [Google Scholar]
- 61.de Zeeuw D, Akizawa T, Audhya P, Bakris GL, Chin M, Christ-Schmidt H, et al. Bardoxolone methyl in type 2 diabetes and stage 4 chronic kidney disease. N Engl J Med. 2013;369(26):2492–503. [DOI] [PMC free article] [PubMed] [Google Scholar]
- 62.Chin MP, Wrolstad D, Bakris GL, Chertow GM, de Zeeuw D, Goldsberry A, et al. Risk factors for heart failure in patients with type 2 diabetes mellitus and stage 4 chronic kidney disease treated with bardoxolone methyl. J Card Fail. 2014;20(12):953–8. [DOI] [PubMed] [Google Scholar]
- 63.Chin MP, Reisman SA, Bakris GL, O’Grady M, Linde PG, McCullough PA, et al. Mechanisms contributing to adverse cardiovascular events in patients with type 2 diabetes mellitus and stage 4 chronic kidney disease treated with bardoxolone methyl. Am J Nephrol. 2014;39(6):499–508. [DOI] [PubMed] [Google Scholar]
- 64.Nezu M, Suzuki N, Yamamoto M. Targeting the KEAP1-NRF2 System to Prevent Kidney Disease Progression. Am J Nephrol. 2017;45(6):473–83. [DOI] [PubMed] [Google Scholar]
- 65.Toto RD. Bardoxolone-the Phoenix? J Am Soc Nephrol. 2018;29(2):360–1. [DOI] [PMC free article] [PubMed] [Google Scholar]
- 66.Wu H, Kong L, Cheng Y, Zhang Z, Wang Y, Lou M, et al. Metallothionein plays a prominent role in the prevention of diabetic nephropathy by sulforaphane via up-regulation of Nrf2. Free Radic Biol Med. 2015. [DOI] [PMC free article] [PubMed] [Google Scholar]
- 67.Jenkinson SE, Chung GW, van Loon E, Bakar NS, Dalzell AM, Brown CD. The limitations of renal epithelial cell line HK-2 as a model of drug transporter expression and function in the proximal tubule. Pflugers Arch. 2012;464(6):601–11. [DOI] [PubMed] [Google Scholar]
- 68.Slyne J, Slattery C, McMorrow T, Ryan MP. New developments concerning the proximal tubule in diabetic nephropathy: in vitro models and mechanisms. Nephrol Dial Transplant. 2015;30 Suppl 4:iv60–iv7. [DOI] [PubMed] [Google Scholar]
- 69.Michl C, Vivarelli F, Weigl J, De Nicola GR, Canistro D, Paolini M, et al. The Chemopreventive Phytochemical Moringin Isolated from Moringa oleifera Seeds Inhibits JAK/STAT Signaling. PLoS One. 2016;11(6):e0157430. [DOI] [PMC free article] [PubMed] [Google Scholar]