

Abstract
Context: Urine specific gravity (USG) is often used by clinicians to estimate urine osmolality. USG is measured either by refractometry or by reagent strip. Objective: We studied the correlation of USG obtained by either method with a concurrently obtained osmolality. Design: Using our laboratory's records, we retrospectively gathered data on 504 urine specimens on patients on whom a simultaneously drawn USG and an osmolality were available. Out of these, 253 USG's were measured by automated refractometry and 251 USG's were measured by reagent strip. Urinalysis data on these subjects were used to determine the correlation between USG and osmolality, adjusting for other variables that may impact the relationship. The other variables considered were pH, protein, glucose, ketones, nitrates, bilirubin, urobilinogen, hemoglobin, and leukocyte esterase. The relationships were analyzed by linear regression. Results: This study demonstrated that USG obtained by both reagent strip and refractometry had a correlation of approximately 0.75 with urine osmolality. The variables affecting the correlation included pH, ketones, bilirubin, urobilinogen, glucose, and protein for the reagent strip and ketones, bilirubin, and hemoglobin for the refractometry method. At a pH of 7 and with an USG of 1.010 predicted osmolality is approximately 300 mosm/kg/H2O for either method. For an increase in SG of 0.010, predicted osmolality increases by 182 mosm/kg/H2O for the reagent strip and 203 mosm/kg/H2O for refractometry. Pathological urines had significantly poorer correlation between USG and osmolality than “clean” urines. Conclusion: In pathological urines, direct measurement of urine osmolality should be used. J. Clin. Lab. Anal. 24:426–430, 2010. © 2010 Wiley‐Liss, Inc.
Keywords: urine osmolality, urine specific gravity, urinalysis
INTRODUCTION
Urine specific gravity (USG) is often used by clinicians in routine practice as an estimate of urine osmolality. USG was previously measured manually through a refractometer. This has been shown to correlate well with urine osmolality 1, 2. The estimation of osmolality using specific gravity (SG) has been described previously as a multiple of 35,000–40,000 3, 4.
However, this relationship was determined before the introduction of urine reagent strips which is a colorimetric assay (utilizing color changes). Early descriptions of colorimetric assays indicated that SG was most accurate at a neutral pH of 7.0–7.5 5. However, in clinical practice, urine pH is often acidic, especially in the setting of acute kidney injury. USG has not been shown to correlate well with osmolality when urine is acidic in reagent strip testing 6, 7, whereas there is no effect of pH on refractometry 5.
Today, USG is measured mostly through automated machines which may either use refractometry or reagent strip testing. Our institution uses both methods to measure SG, giving us a unique opportunity to compare the correlation of SG obtained by each of these methods with concurrently measured urine osmolality.
We hypothesized that USG measurement using reagent strips would correlate better with urine osmolality at neutral pH than at an acidic or alkaline pH, whereas USG obtained through refractometry would correlate similarly at both acidic and neutral pH. We also hypothesized that pathological urine samples containing hemoglobin, leukocyte esterase, bilirubin, protein, nitrates, glucose, urobilinogen, and ketones would have poorer correlation between SG and osmolality whether measured by refractometry or by reagent strip as compared with “clean” urine samples not containing these constituents.
To study this hypothesis, we conducted a retrospective analysis in our hospital laboratory comparing urine osmolality and urine SG, which was determined using either an automated urine chemistry analyzer employing reagent strips or a refractometer on more than 500 patients at different levels of pH. We also examined other measurements in the urinalysis to determine if these might also affect the correlation, independent of pH.
MATERIALS AND METHODS
Using laboratory records, data was retrospectively gathered on 504 urine specimens on patients for whom a simultaneously drawn USG and a urine osmolality was available. Out of these, 253 specimens had USG measured by the Clinitek Atlas automated urine chemistry analyzer (Siemens Healthcare Diagnostics, Tarrytown, NY), which uses an automated refractometry‐based method to measure SG. Two hundred and fifty‐one samples had USG measured by the Clinitek 500 automated urine chemistry analyzer (Siemens Healthcare Diagnostics), which uses a dipstick reagent method to measure SG. The corresponding urine osmolality results were gathered using an osmometer (Model 3320, Advanced Instruments Incorporated, Norwood, MA).
Urinalysis data on these subjects was used to determine the relationship between urine osmolality and SG, adjusting for other measures that may impact the relationship. Other measures considered were pH, protein, glucose, ketones, nitrates, bilirubin, urobilinogen, hemoglobin, and leukocyte esterase. Of these, all except urobilinogen and pH were coded on an ordinal scale of 0 (none), 0.5 for trace, and 1–3 or 4 for increasing amounts. pH was recorded from 5 to 9, at increments of 0.5. Urobilinogen was coded as 0, 0.2, 1, 2, 4, and 8 as measured on the urinalysis reagent strip.
The study was approved by the institutional review board of Berkshire Medical Center and need for informed consent was waived. Results were analyzed by a biostatistician.
Initially, the effect of pH on the correlation between urine osmolality and SG was studied in both the refractometry and the reagent strip groups. This was done by dividing the data into four groups based on pH (5 and 5.5, 6 and 6.5, 7 and 7.5, 8 or greater).
Correlation of urine osmolality and SG was analyzed in these four groupings. This relationship was further analyzed by using linear regression analysis of the relationship of osmolality to SG and pH for each of the two measurement methods, to confirm whether pH was statistically significant in affecting the relationship between urine osmolality and SG in the reagent strip group and in the refractometry group. Other variables (protein, glucose, ketones, nitrates, bilirubin, urobilinogen, hemoglobin, leukocyte esterase) were analyzed to determine whether they would improve the linear regression model.
Finally, after determining which variables improved the linear regression model, an attempt was made to divide urine samples into “clean” and “pathological” urines based on presence or absence of variables that added significantly to the regression models. Those variables are glucose, ketones, urobilinogen >0.2, bilirubin, and protein for urine samples with osmolality measured by reagent strip and ketones, bilirubin, and urobilinogen >0.2 for samples measured using refractometry (Table 2).
Table 2.
Prediction models for urine osmolality for reagent strip and osmolality
| For reagent strip, the prediction model is: |
| Urine Osmolality=100×(−183.22+181.63×SG+0.42×pH +0.57×Glucose+0.57×Ketones−0.49×Bilirubin+0.30×Urobilinogen−0.33×Protein) |
| According to this model, when all other variables are constant, each change of 0.01 in specific gravity will increase or decrease the predicted osmolality by 182 |
| For refractometry the prediction model is: |
| Urine Osmolality=100×(−202.26+203.39×SG+0.36×Ketones−0.69×Bilirubin−0.22×Hemoglobin) |
| In this model, when all other variables are constant, each change of 0.01 in specific gravity will increase or decrease the predicted osmolality by 203 |
RESULTS
The effect of pH on the correlation between urine SG and osmolality in the reagent strip group was analyzed. In the pH 5–5.5 group, the correlation between USG and urine osmolality was 0.6 (n=105). Similarly, in the 6–6.5 pH group, the correlation was 0.74 (n=90). In the 7–7.5 group, the correlation was best at 0.78 (n=50). In the group with pH >8, the correlation was −0.73 (n=6); however, the sample was so small that this should not be considered a reliable estimate. Its 95% confidence interval is −0.97–0.20. Of these four groups, the highest correlation value (0.78, for pH 7–7.5) was statistically significantly different from 0.6, for pH 5–5.5 (P=0.05). Ignoring pH, the overall correlation between osmolality and SG measured by reagent strip was 0.67.
For the samples analyzed using refractometry, in the pH 5–5.5 group, the correlation between USG and osmolality was 0.64 (n=84). In the 6–6.5 pH group, the correlation was 0.76 (n=98). In the pH 7–7.5 group, the correlation was 0.79 (n=60) and in the pH >8 group, the correlation was 0.62 (n=11). There are no statistically significant differences among these four correlations. The first three of these are statistically significantly different from 0 at P=0.01, and the last, at P=0.05. Nevertheless, given the small sample size, the estimate from the pH >8 group should not be considered reliable. It has a very broad 95% confidence interval of 0.02–0.89. The overall correlation between osmolality and SG measured by refractometry was 0.73.
The following charts display the osmolality values against SG for the four pH groups, using each method. The observed values of SG clump at “round” numbers (e.g., 1.01, 1.015, 1.02, etc) for the reagent strip measurements. This is because reagent strip SG measurements are made at round numbers; i.e., 1.000, 1.005, 1.010 …1.030. Values obtained by refractometry cover the range much more smoothly. Osmolality values have more variability at higher specific gravities. This is especially clear on the refractometry charts.
This is shown graphically in Figures 1 and 2.
Figure 1.

Graphical representation of correlation between urine specific gravity measured by reagent strip and urine osmolality subdivided into 4 pH groups pH 5‐5, 6‐6.5, 7–7.5, 8 and above.
Figure 2.
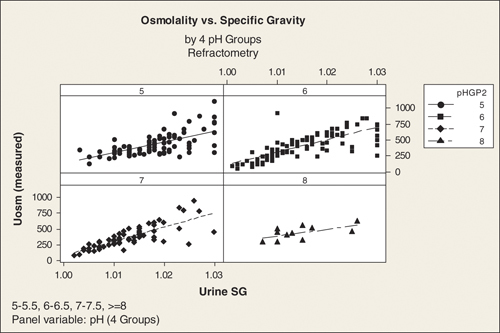
Graphical representation of correlation between urine specific gravity measured by refractometry and urine osmolality subdivided into 4 pH groups pH 5‐5, 6‐6.5, 7–7.5, 8 and above.
The above results confirm our hypothesis that the relationship between SG and osmolality is affected by pH when SG is measured using reagent strip, but not to the same extent when it is measured using refractometry.
Given these results, we then used linear regression to study these relationships further, and also to examine whether any of the other variables affect the relationships. We first performed a linear regression of osmolality on SG and pH, for each measurement method. This confirmed that pH adds a statistically significant effect to the relationship for reagent strip at P=0.01, but is only borderline significant (P=0.08) for refractometry. Five additional variables (glucose, ketones, bilirubin, urobilinogen, and protein) had a statistically significant effect on the relationship using reagent strip measurements. With refractometry, only three variables (ketones, bilirubin, and hemoglobin) improved the model significantly. The predicted urine osmolality derived from the final models for reagent strip and refractometry has a (multiple) correlation of 0.75 and 0.76, respectively, with measured urine osmolality. Thus, the two models do equally well in predicting urine osmolality, but the model for reagent strip is considerably more complex. In practical terms, the gain is very modest for refractometry, from a simple correlation of 0.73 to the multiple correlation of 0.76.
According to our models at a pH of 7 and with a USG of 1.010, the predicted osmolality is approximately 300 mosm/kg/H2O for either method. For an increase in SG of 0.010, predicted osmolality increases by 182 mosm/kg/H2O for the reagent strip and 203 mosm/kg/H2O for refractometry.
Out of the 251 urine samples with osmolality measured by reagent strip, 104 were identified as “clean” and 147 as “pathological.” Of the 254 urine samples with osmolality measured by refractometry, 126 were identified as “clean” and 127 as “pathological.”
Pathological urine samples had a considerably poorer correlation between USG and osmolality than clean samples, whether measured by reagent strip or by refractometry. In our study, pathological urine samples had a correlation of 0.51 between USG and osmolality compared with a correlation of 0.76 for “clean” samples. When using refractometry, we found that pathological urine samples had a correlation of 0.63 between SG and osmolality. Clean samples had a correlation of 0.83.
DISCUSSION
The above results confirm our hypothesis that the relationship between SG and osmolality is affected by pH when SG is measured using reagent strip, but not to the same extent when it is measured using refractometry. The data also demonstrate that at a pH of 7 and with a SG of 1.010, if all other variables are absent, we can predict a serum osmolality of approximately 320 mOsm/kg H2O using either method. This is to some extent consistent with previous descriptions in the literature where a SG of 1.010 corresponded to an osmolality of 350–400 mOsm/kg H2O 3, 4. However, for an increase in SG of 0.01, the predicted osmolality increases by about 181 or 203 mosms/kg H2O based on whether the SG is measured by reagent strip or by refractometry. This contrasts with previous descriptions where a rise in SG of 0.01 is associated with an osmolality increase of 350–400 mOsm/kg H2O 3, 4.
Variations in pH, glucose, protein, hemoglobin, bilirubin, ketones, and urobilinogen tend to affect the relationship significantly, so that it becomes increasingly difficult to predict the osmolality with any degree of certainty in the presence of these other factors.
Both the Clinitek Atlas and the Clinitek 500 autocorrect the SG by a correction factor of 0.005, if the pH >6. This did not seem to improve the correlation between USG and urine osmolality on the Clinitek 500.
Previous studies have shown osmolality to correlate well with SG measured by refractometry (R 2=0.89–0.96). This was true both for refractometry measured manually or by an automated refractometer as in our study 1, 8, 9, 10. In our study, we found a poorer correlation (r=0.73). We cannot fully explain this, but hypothesize that this may have been because previous studies have looked more at “clean” urine samples rather than the mix of “clean” and pathological samples that we looked at. Certainly, there was a higher correlation in “clean urines” (0.83) than in pathological urines (0.63) in our study. A previous study has shown an effect of protein, glucose, and radiocontrast media on correlation between SG and osmolality in urine samples where SG was measured by refractometry 11. We did not find a noticeable effect of protein and glucose, but found a significant effect of ketones, bilirubin, and hemoglobin. This has not been described before. Both bilirubin and hemoglobin are large molecules which should increase the SG disproportionately and cause an overestimation of the osmolality if their presence is ignored, as we noticed. Why ignoring the presence of ketones tends to underestimate the osmolality is not explained.
Our findings for the correlation of reagent strip with osmolality (R 2=0.67) are generally in agreement with previous studies (r: 0.61–0.83) 1, 8, 9, 10, 12. It is thought that glucose does not affect the relationship between SG and osmolality 13, 14 and it is controversial whether protein does so 5. In our study, we found that proteins, glucose, ketones, bilirubin, urobilinogen all affect the relationship between SG and osmolality. One plausible reason for the effect of protein, bilirubin, ketones, and urobilinogen on SG measured by reagent strip is the presence of an electric charge on these molecules that affects the pH indicator on the reagent strip.
Our study is unique in that it is the first to study the effect of bilirubin, hemoglobin, urobilinogen, and ketones on USG.
Our study does have limitations. We did not look into the effect of contrast media on the correlation between urine osmolality and SG. Contrast media has been shown to affect SG measured by refractometry 5. Our study's preciseness is also affected by the fact that both the Clinitek Atlas and the C500 report amount of urine protein, ketones, glucose, bilirubin, and hemoglobin as ordinal variables based on their concentrations in urine, and we had to use these ordinal variables in our statistical analysis. We did attempt to define the exact concentrations that were represented by these ordinal variables. This is shown in Table 1.
Table 1.
Lab values associated with ordinal numbers reported for urinalysis variables
| Protein is reported as absent, trace, 1+ to 3+ depending on increase in protein from not detected to >300 mg/dl |
| Glucose is reported as absent, trace to 3+ depending on increase in glucose from not detected to >1,000 mg/dl |
| Urobilinogen is reported as 0.2, 1, 2, 4, and 8 mg/dl in urine |
| Leukocytes are reported as absent, trace, 1+ to 3+ based on the presence of leukocyte esterase in negative, trace, small, moderate, or large amounts in urine |
| Nitrites are reported as negative or positive based on their absence or presence |
| pH is reported as measured |
| Hemoglobin is reported as absent, trace, 1+ to 3+ based on the presence of hemoglobin in negative, trace, small, moderate or large amounts in urine |
| Ketones are reported as negative, trace, 1+, 2+, or 3+ based on the increase in ketones from not detected to 160 mg/dl |
| Bilirubin is reported as absent, 1+ to 3+ based on the presence of bilirubin in negative, small, moderate, or large amounts in urine |
Despite these limitations, we feel our study has shown some new important new findings; i.e., (1) USG measured by reagent strip correlates poorly with urine osmolality in the presence of glucose, bilirubin, urobilinogen, protein, ketones, acidic, or alkaline urines and (2) USG measured by refractometry correlates poorly with urine osmolality in presence of hemoglobin, ketones, or bilirubin. In pathological urine specimens, we would suggest measuring the actual urine osmolality, whereas in clean samples USG can be relied on as a measure of urine concentration.
Acknowledgements
We acknowledge the help of Leslie Drager in making this manuscript possible.
REFERENCES
- 1. Roessingh AS, Drukker A, Guignard J‐P. Dipstick measurements of urine specific gravity are unreliable. Arch Dis Child 2001;85:155–157. [DOI] [PMC free article] [PubMed] [Google Scholar]
- 2. Bakhshandeh S, Morita Y. Comparison of urine concentration tests: Osmolality, specific gravity and refractive index. Mich Med 1975;74:399–403. [PubMed] [Google Scholar]
- 3. Rose BD, Post TW. Clinical Physiology of Acid‐Base and Electrolyte Disorders, fifth edition. New York: McGraw‐Hill; 2001. p 410–412. [Google Scholar]
- 4. Miller RB. Urinalysis In: Massry SG, Glassock RJ, editors. Textbook of Nephrology, Chapter 81. Baltimore, MD: Williams and Wilkins; 1983. p 11.3–11.24. [Google Scholar]
- 5. Chadha V, Garg U, Alon U. Measurement of urinary concentration: A critical appraisal of methodologies. Pediatr Nephrol 2001;16:374–382 [DOI] [PubMed] [Google Scholar]
- 6. Dorner K, Campos R, Bornsen S. Further evaluation of the SG test strip for estimation of urine osmolality. J Clin Chem Clin Biochem 1984;22:419–425. [DOI] [PubMed] [Google Scholar]
- 7. Adams LJ. Evaluaton of Ames Multistix‐SG for urine specific gravity versus refractometry specific gravity. Am J Clin Pathol 1983;80:871–873. [DOI] [PubMed] [Google Scholar]
- 8. Audouin W, Couture G, Girard J. Evaluation de la densite urinaire par la bandelette reactive de la Cie AMES et comparaison avec la densite donnee par le refractometre et avec l'osmolalite urinaire. Clin Biochem 1985;18:130–133. [DOI] [PubMed] [Google Scholar]
- 9. Dorizzi R, Pradella M, Bertolodo S. Refractometry, test strip, and osmometry compared as measures of relative density of urine. Clin Chem 1987;33:190a. [PubMed] [Google Scholar]
- 10. Luft F, Aronoff G, Walker N. Determining specific gravity of urine with reagent sticks. Clin Chem 1984;30:582. [PubMed] [Google Scholar]
- 11. Voinescu G, Shoemaker M, Moore H, et al., The relationship between osmolality and specific gravity. Am J Med Sci 2002;323:39–42. [DOI] [PubMed] [Google Scholar]
- 12. Gounden D, Newall RG. Urine specific gravity measurements: Comparison of a new reagent strip method with existing methodologies, as applied to the water concentration/dilution tests. Curr Med Res Opin 1983;8:375–381. [DOI] [PubMed] [Google Scholar]
- 13. Kiichi I, Masaharu N, Toshikazu K. Study of urine specific gravity by reagent strip method. Tokai J Exp Clin Med 1983;8:247–255. [PubMed] [Google Scholar]
- 14. Frew A, Mcewan J, Bell G. Estimation of urine specific gravity and osmolality using a simple reagent strip. Br Med J 1982;285:1168. [DOI] [PMC free article] [PubMed] [Google Scholar]