Abstract
Intervention by membrane KCC transporter interfering selectively could promote about 5 times enrichment of nuclear red blood cells. J. Clin. Lab. Anal. 25:1–7, 2011. © 2011 Wiley‐Liss, Inc.
Keywords: Nuclear red blood cells (NRBC), KCC transporter, Flow cytometry (FCM), Urea, Regulated volume decrease (RVD)
INTRODUCTION
Separating fetal nucleated red blood cells (FNRBCs) from the peripheral blood of pregnant women for genetic analysis is a promising method of noninvasive prenatal diagnosis 1, 2. However, current detection levels are not optimal. The poor sensitivity and inconsistent recovery of fetal cells is compounded by small numbers of circulating fetal cells and loss of fetal cells during enrichment procedures. Many different enrichment methods have been used to reduce the overall number of maternal cells while maintaining maximum yield of fetal cells. The two most commonly described approaches involve magnetic‐activated cell sorting (MACS) and fluorescence‐activated cell sorting (FACS). Both typically involve sequential steps, such as preliminary separation to remove mature red blood cells (RBCs) and granulocytes followed by antibody labeling to achieve negative and/or positive selection to remove unwanted maternal cells. Unfortunately, each step of the MACS‐ and FACS‐based enrichment procedures has the potential of reducing fetal cell recovery 3, 4, 5. More effective methods are needed to obtain FNRBCs at high concentration and high purity from maternal peripheral blood.
As Cl− ion channels distribution are more wide in red cell compared with other cell lines, the red cell mold is of greater variability in the same Cl− ion channels' intervention 6, 7. The intracellular Cl− content directly determines the size of red blood cell volume, and there is an inverse linear relationship between both Cl− content and cell volume 8, 9. The changes are directly related to the cell separation in certain media, because changes in media density can change the degree of cell separation.
It has been found that urea reversibly activates the K‐Cl symporter system in human RBCs in a concentration‐dependent manner. Okadaic acid can remove the activating effect of urea, which suggests that the urea intervention could lead to dephosphorylation effect and could approximate the phosphorylation–dephosphorylation process 10. In view of the high concentration of urea in the mature and immature RBCs, it could regulate cell volume reduction so that urea could play an important role as the intervention reduced the proportion of NRBCs larger volume of material 11. Little research has been conducted on how the different distribution of ion channels in cells at different developmental stages could be used in methods of enrichment centrifuge separation. The membrane Anion Exchanger intervention membrane K+/2Cl− Cotransporter (KCC) was selected to explore the effects of different interventions on the RBCs.
MATERIALS AND METHODS
Cord Blood Specimens
Seventy‐five cases of cord blood samples (volume 18 ml ∼63 ml with heparin) from full‐term 22 to 35 year olds were taken at delivery, ruling out the possibility of blood diseases, etc. (Hb>90fl). All blood samples were obtained with the informed consent of the participants and processed in a timely manner within 24 hr of collection.
Urea Intervention
Urea concentrations of 400, 200, and 100 mM were each set up under isotonic, hyperbaric, and hypobaric conditions; each combination was tested with interference times of 5, 10, and 20 min. Before interference, each diameter of 200 mature RBCs in each sample of fresh and healthy umbilical blood was measured by a microscope micrometer examination of blood smears (Xinghua Co., Shanghai, China). The total interference system for each test was 6 ml, using an average of 3 ml umbilical blood, adding 0.1 ml MgCl2 to provide Mg2+ conditions (average Mg2+ concentration 100 mM), 2 ml of different osmotic liquids, and after 10 min of intervention adding 1 ml of different concentrations of 37°C urea to provide simultaneous interference, after which the Mean Cell Volume (MCV) before and after the intervention was measured by automation blood cell analyzer (Beckmen Couter LH750, Los Angeles, California) and cell diameters were assessed in the same manner as above.
Separation of NRBC After Intervention
Lymphocyte separation liquid of 3 ml with density gradients of 1.067, 1.077, 1.087, 1.099, and 1.105 g/ml, respectively, was added to the bottom of the 10 ml centrifuge tube, and adding 6 ml of postintervention umbilical blood for 16 samples, each repeated twice, with 20 min centrifugation at 2,500 rpm. Intermediate white layer was adjusted for the transfer into a cell concentration of 1×10⁶/ml reserve after washing with Iscoves modified dulbecco medium (IMDM, Gibco Company, Carlsbad, California) with 10% FCS. A negative control was established by diluting umbilical blood in a 1:1 ratio with Phosphate Buffer Solution (Beijing Chemical Company, Beijing, China) and manipulating as above.
Flow Cytometry Test
Three microliters of specific antibody CD71 labeled with fluoresceinisothiocyanate and monoclonal antibody glycoprotein A‐labeled phycoerythrin was added to 1 ml postintervention cell suspension, incubated in the dark for 30 min at 37°C, and the PBS washed cells twice. Every sample analyzed at least 5,000 cells with cell analysis rate of 500/sec by FACSort type Flow cytometry (BD Company, Patterson, New Jersey). Negative samples was the first to test and then to test sample.
Cell Intracellular‐Free Calcium Concentration by Laser Scanning Confocal Microscope
Fluo‐3/AM (0.5 µmol/l) were joined, after full mixing and incubating at 37°C for 45 min. Detection by laser scanning confocal microscope and scanning speed selection “VERY FAST.” First choice in the light microscope, vision, and then start scanning for fluorescence microscopy.
Statistical Analysis
SPSS 13.0 statistical software was used for linear analysis. The two‐sample t‐test of these measured results of RBCs and Lymphocytes was selected for statistical analysis. P<0.05 indicated statistically significant differences.
RESULTS
Changes in the Umbilical Blood Red Blood Cell Diameter Under Intervention With Different Concentrations of Urea and Different Osmotic Pressures
By multiple comparisons of Dunnett t‐test, these were not statistically significant changes in the samples, as that experienced no urea interference under isotonic or hypotonic conditions with 10 min treatment times, or interference with 100 mM urea under hypotonic conditions for 10 min (P>0.05). The cell diameter changes of other intervention groups were significantly different (P<0.05), as shown in Table 1. The data showed mutual interaction between the three factors of urea concentration, osmotic pressure, and treatment time (F=26.729, P<0.01). Using the Bonferroni method for analysis of variance with pairwise comparison between samples, the differences between the groups and within a group were statistically significant (F=228.847, P<0.05). In hypertonic conditions, 10 min of interference with 400 mM urea caused the greatest decrease in the volume of mature RBCs, with a statistically significant change in pre‐ and postintervention blood cell diameters (P<0.05). Testing different concentrations of urea and intervention times showed that the smallest RBC diameters were obtained by treatment with 400 mM urea for 20 min under isotonic conditions, 400 mM urea for 10 min under hypertonic conditions, and 400 mM urea for 10 min under hypobaric conditions.
Table 1.
The Cell Change of Umbilical Blood Under Different Concentrations of Urea and Osmotic Pressure
| Cell diameter after intervention | |||||
|---|---|---|---|---|---|
| Urea concentration | Osmotic | Cell diameter (µm) | Intervention time (min) | ||
| (mM) | pressure | before intervention | 5 min | 10 min | 20 min |
| 0 | Isotonic | 7.81425±0.3231 | 7.6163±0.4279 | 7.7815±0.4992a | 7.6319±0.3853 |
| Hypertonic | 7.81425±0.3231 | 6.5144±0.1066 | 6.3843±0.1031 | 7.0154±0.3554 | |
| Hypotonic | 7.81425±0.3231 | 8.1147±0.8939 | 7.9644±0.5451a | 8.0034±0.2127 | |
| 100 | Isotonic | 7.81425±0.3231 | 7.6432±0.4279 | 8.0353±0.5286 | 7.6235±0.4707 |
| Hypertonic | 7.81425±0.3231 | 7.2149±0.4433 | 7.2146±0.2781 | 7.0829±0.3559 | |
| Hypotonic | 7.81425±0.3231 | 8.1106±0.3733 | 7.7975±0.2889a | 8.1021±0.1845 | |
| 200 | Isotonic | 7.81425±0.3231 | 6.7682±0.2827 | 6.9716±0.3507a | 6.8901±0.3065 |
| Hypertonic | 7.81425±0.3231 | 7.2667±0.3454 | 7.0329±0.3703a | 7.3719±0.4038 | |
| Hypotonic | 7.81425±0.3231 | 7.3508±0.3192 | 7.4104±0.4572a | 7.2926±0.4204 | |
| 400 | Isotonic | 7.81425±0.3231 | 7.3246±0.3819 | 6.7429±0.2261 | 6.6699±0.1879 |
| Hypertonic | 7.81425±0.3231 | 6.6338±0.1219 | 6.2145±0.7942 | 6.4579±0.1218 | |
| Hypotonic | 7.81425±0.3231 | 7.2686±0.4065 | 7.0300±0.3279 | 7.3705±0.3833 | |
aThe cell diameter change after intervention was not significantly different (P>0.05); the changes of other groups were significantly different.
The Separating Density of Mononuclear Cells
The average NRBC percentage of whole blood was determined to be 7.3% by Benzidine staining. Average postintervention NRBCs were measured by Benzidine staining after initial separation, with 0.6% for the 1.067 g/ml density gradient separation liquid, 2.4% at 1.077 g/ml, 5.6% at 1.087 g/ml, 5.8% at 1.099 g/ml, 5.8% at 1.087 g/ml, and 6.3% at 1.105 g/ml. The highest NRBC density was seen with the 1.105 g/ml separation liquid, but in the density 1.099 g/ml and 1.105 g/ml samples, a large number of mature RBCs were proved to move white film, in particular 1.105, and the majority of mature RBCs were accounted. Therefore, the best separation density was 1.087.
Enrichment of NRBCs in Urea‐Treated Umbilical Blood Separated With Different Density Centrifugation
The rate of NRBC enrichment in the under layer for the 1.067 g/ml density gradient was a factor of 5.6, increasing from 12.2 to 69.9% after urea intervention, as determined by Flow cytometry with anti‐CD71 and anti‐GPA markers. The results of NRBC enrichment after urea intervention as shown by Flow cytometry are in Table 2. Figure 1 shows 69.9% NRBCs in under layer with 1.065 g/m density after urea intervention by Flow Cytometry with CD71‐FITC and GPA‐PE. Figure 2 shows 1.72% NRBC in Mononuclear layer with 1.065 density after urea intervention by Flow Cytometry with CD71‐FITC and GPA‐PE.
Table 2.
The NRBC Percentage in Different Density Medium After Intervention in Umbilical Blood
| Density medium | Under layer of intervention (%) | Under layer of intervention (%) | Sign nuclear layer of intervention (%) | Sign nuclear layer of no intervention (%) |
|---|---|---|---|---|
| 1.065 | 69.9 | 12.2 | 2.00 | 7.15 |
| 1.077 | 34.00 | 8.84 | 3.90 | 8.6 |
| 1.087 | 20.3 | 8.01 | 24.2 | 47.0 |
| 1.099 | 18.6 | 7.28 | 45.0 | 55.9 |
Figure 1.
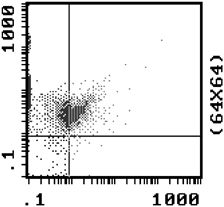
NRBC was 69.9% in under layer after 1.065 intervention by Flow Cytometry with CD71‐FITC/GPA‐PE.
Figure 2.
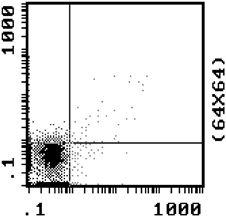
NRBC was 1.72% in sign nuclear layer after 1.065 intervention by Flow Cytometry with CD71‐FITC/GPA‐PE.
Figures 3 and 4 show that for the 1.077 g/ml separation liquid, 30.0% of NRBCs were found in control group and 60.5% was found in the mononuclear cell layer after 1.077 density with the intervention of 400 mM urea concentration by Flow cytometry with CD71. NRBCs of 5.54 and 40.5% could be found in the lower layer of density centrifugation under concentration of 400 mM urea in umbilical cord blood concentrations of urea in a single antibody (CD71‐FITC) and double antibodies (CD71‐FITC/GPA‐PE). In Figures 5 and 6, the vertical coordinates are FL1, GPA fluorescence channel, and the horizontal coordinates are FL2, CD71 fluorescence channel 2.
Figure 3.
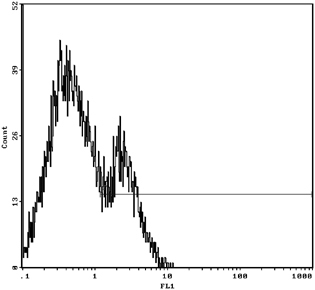
NRBC was 30.0% in 1.077 density gradient centrifugation with urea intervention.
Figure 4.
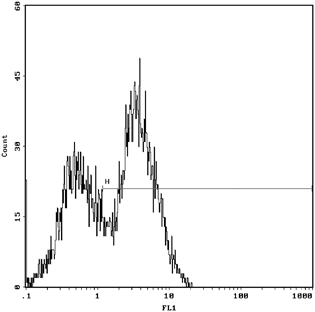
NRBC was 60.5% after 1.077 density with no urea intervention by Flow Cytometry with CD71‐FITC.
Figure 5.
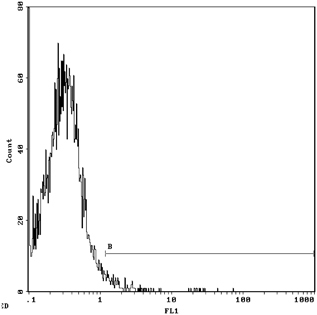
NRBC was 5.54% after 1.077 density with urea intervention by Flow Cytometry with CD71‐FITC.
Figure 6.
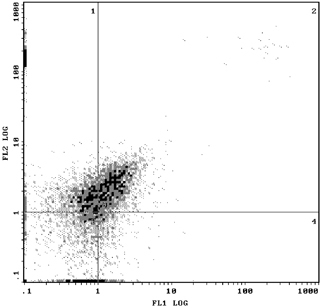
NRBC was 40.5% after 1.077 density with urea intervention by Flow Cytometry with CD71‐FITC/GPA‐PE.
Changes of Calcium Concentration in Red Blood Cells After Urea Intervention
There were significant changes in calcium fluorescence in the RBCs before and after the urea intervention. The Ca2+ fluorescence increased from 96.176±18.0063 with no urea intervention to 152.144±21.2905 after urea intervention, t=4.488, P<0.05, as shown in Figures 7 and 8.
Figure 7.
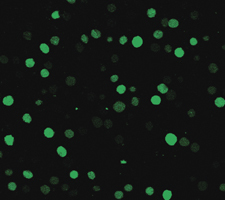
The cytosolic Ca2+ fluorescence of red blood cells in no intervention by laser scanning confocal microscope.
Figure 8.
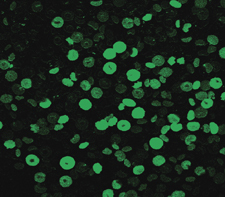
The intracellular Ca2+ fluorescence after the intervention by laser scanning confocal microscope.
DISCUSSION
FNRBCs circulate in maternal blood and are considered as suitable means to detect fetal genetic and chromosomal abnormalities. However, both enrichment and separation methods of fetal cells in maternal peripheral blood are complicated and expensive, and only has rare cells which limits the use of FNRBC‐based noninvasive prenatal diagnostic techniques in clinical settings. Thus, the search for effective methods, to enrich and separate, remains an urgent problem for the further development of noninvasive prenatal genetic diagnostics.
Many substances can affect the RBC membrane ion channel activation or inhibition and make some changes in RBC volume. Every function of different types of cells is dependent upon some difference in characteristics of cell ion channels. The different distribution of ion channels in cells at different developmental stage could be caused by the intervene expansion differences in the same conditions, so that it could make use of methods of enrichment centrifuge separation.
Just as cells expand through the K+/Cl− cotransporter (KCC) system, adjustments to reduce intracellular KCl cause cells to shrink. This process is called regulatory volume decrease (RVD). Urea is a membrane calcium channel antagonist which can block the Ca2+ outside the cell from flowing in so that cytoplasmic Ca2+ can be decreased and urea could reduce, based on the erythrocyte membrane KCl symporter, and bring about RVD 11, 12.
Previous research on the effects of urea on the K‐Cl symporter system found that, in human RBCs, urea reversibly activates the transporter system in a concentration‐dependent manner. A reversible urea transporter activation by concentration‐dependent manner was found in urea on K‐Cl symporter effects in human RBCs. Okadaic acid can remove the activating effect of urea, which suggests that the urea intervention could lead to dephosphorylation effect and could approximate the phosphorylation–dephosphorylation process 9. In view of the high concentration of urea in mature and immature RBCs and the important role it plays in regulating adjustments of cell volume, this study chose to use urea as the agent to interfere with NRBC volume changes 10.
The intracellular Cl− was replaced by SO in this experiment by the mononuclear leukocyte in the SO to conduct a pretraining rich environment. This process was not impacted by MCV. Afterwards, these cells would be resuspended in Cl− rich environment and the intracellular SO would be exchanged by Cl− for cell acidification. Then, urea caused cells to maintain intracellular Cl−concentration and pH. As cell acidification and intracellular Cl− concentration increases, changes in cell volume changes are reduced. The changes in the amount of volume and intracellular Cl− concentration were in proportion to the relationship 13.
Existing literature showed that 200 mM urea could effectively activate KCC; so, we chose 400, 200, and 100 mM concentration gradients. The combination of urea and osmotic pressure were considered a synergetic environment to promote a reduction in RBC volume; so, each concentration of urea was tested under three different osmotic pressure environments, for different periods of time (5, 10, and 20 min), to determine what intervention would have the greatest effect on RBC volume. The results show that, across osmotic pressure conditions, the largest reduction in volume came with 400 mM urea intervention. Under hypobaric conditions with 400 mM urea for 10 min, RBC diameter was 6.2145±0.7942 µm after intervention and 7.81425±0.3231 µm before, which was the most significant decrease in cell diameter and also statistically significant (P<0.05). This also showed that there was an interaction effect between high urea concentration and the osmotic pressure condition in the volume reduction of RBCs.
The medium density of conventional lymphocyte separation was 1.077 g/ml. Previous studies have shown that after centrifugation with different densities of separation materials, the abouts of NRBC in mononuclear cell layers would vary, but few studies addressed the lower separation layer that resulted after the density gradient centrifugation. The NRBC enrichment effects in the lower centrifugation layer and the best intervention conditions on the rich range of NRBC density separation media and different concentrations of urea were explored. The results showed that 1.077 density gradient centrifugation could make the ratio of the upper layer NRBC mononuclear cell layer decrease 30% after the intervention, indicating that NRBCs in the mononuclear layer moved from the upper layer to the lower layer of RBCs after intervention. The 1.099 density media could enrich more NRBCs in a single nuclear layer, but more RBCs were mixed, so that the density of medium in 1.065, 1.077, 1.087, 1.099 were selected to study the nuclear RBC changes in single nuclear layer and the under layer after the intervention. Flow cytometry results showed that urea of different concentrations could make NRBC increased in the lower layer after the intervention, and the high concentration of urea was conducive to increase the enrichment of NRBCs in the lower layer.
In order to observe the separation effect of different densities media in the NRBCs enrichment, the anti‐CD71 and GPA as the NRBC surface marker antibodies were selected for the identification and separation of NRBCs by Flow cytometry. After urea intervention and different densities media of centrifugal separation, upper mononuclear cells and upper floors in under red cell were extracted and examined with double‐positive monoclonal antibody by Flow cytometry. There was a large number of RBCs in the extraction, and in order to avoid the background interference in count of Flow cytometry test, all samples were hemolytic with ammonium chloride solution of crack‐line treatment of RBCs. The NRBCs count in the lower layer was from 12.2% no urea intervention to 69.9% after the urea intervention with the 1.065 density medium centrifugation, which the urea intervention could increase about six times the accumulation rate. Other medium density centrifugation did have higher enrichment rates in the lower layer in urea intervention than that of no intervention, and the higher density gradient more level of increase of NRBC enrichment, which indicated urea did so as part of NRBC submerged in the bottom of the NRBC enrichment has a certain significance after the intervention. Our data show that the NRBC of mononuclear cell layer without the intervention in 1.099 medium density centrifugation was up to 55.9%, and the NRBC in mononuclear layer would gradually rise with density medium elevated. The traditional NRBC enrichment of lymphocyte separation medium mold would not be the best choice, because the proportion of NRBC may be lost in the underlayer while separation medium is greater than 1.077.
It was of great significance in breaking through the traditional enrichment methods of NRBC using lymphocyte separation medium. The application of urea as an effective intervention in the material in the density gradient centrifugation NRBC enrichment could also increase the efficiency of clinical NRBC enrichment and provide a new idea and mean. The separation and enrichment experimental research could not only deepen understanding of the system nature of NRBC, but also for the FNRBCs separated from mother peripheral blood for genetic diagnosis.
REFERENCES
- 1. Laird J. Fetal cells and DNA in maternal blood. Prenat Diagn 2003;23:837–846. [DOI] [PubMed] [Google Scholar]
- 2. Mahesh C, Keelin O, David T, et al. Characterization of first trimester fetalerythroblasts for non‐invasive prenatal diagnosis. Mol Hum Reprod 2003;9:227–235. [DOI] [PubMed] [Google Scholar]
- 3. Hennerbichler S, Kroisel PM, Zierler H, et al. Fetal nucleated red blood cells in peripheral blood of pregnant women: Detection and determination of location on a slide using laser‐scanning cytometry. Prenat Diagn 2003;23:710–715. [DOI] [PubMed] [Google Scholar]
- 4. Mavrou A, Kouvidi E, Antsaklis A, et al. Identification of nucleated red blood cells in maternal circulation: A second step in screening for fetal aneuploidies and pregnancy complications. Prenat Diagn 2007;27:150–153. [DOI] [PubMed] [Google Scholar]
- 5. Cha DH, Khosrotehrani K, Bianchi DW, et al. The utility of an erythroblast scoring system and gender‐independent short tandem repeat (STR) analysis for the deteetion of aneuploid fetal cells in maternal blood. Prenat Diagn 2005;25:586–591. [DOI] [PubMed] [Google Scholar]
- 6. Seiji W, Michihiro K. Method of separation and concentration of fetal nucleated red blood cells in maternal blood and its application to fetal diagnosis. Congenital Anomalies 2004;44:72–78. [DOI] [PubMed] [Google Scholar]
- 7. Bischoff FZ, Marquez‐Do DA, Martinez DI, et al. Intact fetal cell isolation from maternal blood: Improved isolation using a simple whole blood progenitor cell enrichment approach (RosetteSepTM). Clin Genet 2003;63:483–489. [DOI] [PubMed] [Google Scholar]
- 8. Lytle C, Thomas J, McManus S, et al. A model of Na‐K‐2Cl cotransport based on ordered ion binding and glide symmetry. Cell Physiol 1998;274:C299–C309. [DOI] [PubMed] [Google Scholar]
- 9. Muzyamba MC, Speake PF, Gibson JS, et al. Oxidants and regulation of K‐Cl cotransport in equine red blood cells. Physiol Cell Physiol 2000;279:C981–C989. [DOI] [PubMed] [Google Scholar]
- 10. Bize I, Taher S, Brugnara C. Regulation of K‐Cl cotransport during reticulocyte maturation and erythrocyte aging in normal and sickle erythrocytes. Am J Physiol Cell Physiol 2003;285:C31–C38. [DOI] [PubMed] [Google Scholar]
- 11. Lytle C, McManus T. Coordinate modulation of Na‐K‐2Cl cotransport and K‐Cl cotransport by cell volume and chloride. Physiol Cell Physiol 2002;283:C1422–C1431. [DOI] [PubMed] [Google Scholar]
- 12. Gibson JS, Speake PF, Muzyamba MC, et al. K(+) transport in red blood cells from human umbilical cord. Biochim Biophys Acta 2001;1512:231–238. [DOI] [PubMed] [Google Scholar]
- 13. Aidar R, Michael IL, Donald BT, et al. Riding the tides: K+ concentration and volume regulation by muscle Na+‐K+‐2Cl‐cotransport activity. News Physiol Sci 2003;18:196–200. [DOI] [PubMed] [Google Scholar]


