Abstract
Purpose:
We develop an Active Shape Model (ASM) framework for automated bone segmentation and anatomical landmark localization in weight-bearing Cone-Beam CT (CBCT). To achieve a robust shape model fit in narrow joint spaces of the foot (0.5 – 1 mm), a new approach for incorporating proximity constraints in ASM (coupled ASM, cASM) is proposed.
Methods:
In cASM, shape models of multiple adjacent foot bones are jointly fit to the CBCT volume. This coupling enables checking for proximity between the evolving shapes to avoid situations where a conventional single-bone ASM might erroneously fit to articular surfaces of neighbouring bones. We used 21 extremity CBCT scans of the weight-bearing foot to compare segmentation and landmark localization accuracy of ASM and cASM in leave-one-out validation. Each scan was used as a test image once; shape models of calcaneus, talus, navicular, and cuboid were built from manual surface segmentations of the remaining 20 scans. The models were augmented with seven anatomical landmarks used for common measurements of foot alignment. The landmarks were identified in the original CBCT volumes and mapped onto mean bone shape surfaces. ASM and cASM were run for 100 iterations, and the number of principal shape components was increased every 10 iterations. Automated landmark localization was achieved by applying known point correspondences between landmark vertices on the mean shape and vertices of the final active shape segmentation of the test image.
Results:
Root Mean Squared (RMS) error of bone surface segmentation improved from 3.6 mm with conventional ASM to 2.7 mm with cASM. Furthermore, cASM achieved convergence (no change in RMS error with iteration) after ~40 iterations of shape fitting, compared to ~60 iterations for ASM. Distance error in landmark localization was 25% to 55% lower (depending on the landmark) with cASM than with ASM. The importance of using a coupled model is underscored by the finding that cASM detected and corrected collisions between evolving shapes in 50% to 80% (depending on the bone) of shape model fits.
Conclusion:
The proposed cASM framework improves accuracy of shape model fits, especially in complexes of tightly interlocking, articulated joints. The approach enables automated anatomical analysis in volumetric imaging of the foot and ankle, where narrow joint spaces challenge conventional shape models.
Keywords: Cone-beam CT, weight-bearing CT, active shape models, bone segmentation, landmark identification
1. INTRODUCTION
Radiological evaluation of the weight-bearing extremities has traditionally relied on 2D radiography. However, utilization of 3D imaging is increasing with recent introduction of a variety of dedicated diagnostic and intra-operative Cone-Beam CT (CBCT) systems. In particular, volumetric evaluation of the knee, foot, and ankle under physiological load became possible using specialized CBCT scanners with weight-bearing imaging capability (Fig. 1 (a)).1,2,3 Clinical applications of those new modalities will benefit from development of more complex weight-bearing 3D measurements and image analysis tools specific to orthopaedics utilizing the 3D information, for example to automate various anatomical measurements used for diagnosis and surgical planning or fracture reduction evaluation.4,5,6
Figure 1.
(a) Anatomical landmarks for common morphological measurements of the foot. We investigated application of ASM for bone segmentation and automatic landmark localization (achieved by mapping landmark locations from the shape model onto the new image). A coupled ASM (cASM) model was developed to achieve robust segmentation in the mid-and hind-foot bone complex, where narrow joint spaces pose a challenge to conventional single-bone ASM. (c) The table shows minimum, maximum and mean distance between articular surfaces calculated from 21 CBCT images. Those distances are used as proximity constraints in the proposed cASM approach.
We investigate the application of active shape models (ASMs)7 for automatic bone segmentation and landmark localization in weight-bearing CBCT of the hind- and mid-foot. In this context, one of the primary advantages of ASM is that it provides a framework to map (“transport”) any geometric features identified on the training data of the shape model onto the segmented image. Here, the features of interest were expert-selected anatomical landmarks for morphological measurements of foot alignment8 and provide diagnostic information beyond these measurements by enabling direct shape analysis based on the training population.
In conventional ASM, shape models of the bones are individually initialized and fitted to the target image. The fitting is typically guided by image gradients. In the foot, however, discrimination between gradients of adjacent bones is challenging because of narrow joint spaces of approx. 0.5 – 1 mm (Fig. 1) and unreliable gradients due to low contrast, metal implants or fractures. To enable robust segmentation of complexes of tightly interlocking bones, we develop a new approach termed coupled ASM (cASM). The shapes forming the complex are simultaneously fit using a combination of image gradients and proximity constraints. This coupling prevents shape intersections and erroneous segmentations that fit across joint spaces to the edges of adjacent bones.
The proposed cASM is compared to ASM in leave-one-out cross-validation using 21 weight-bearing CBCT datasets of the foot. Results are assessed in terms of surface error and landmark localization accuracy against expert reader.
2. METHODS
2.1. CBCT imaging, anatomical landmarks, and validation studies
The studies involved extremity CBCT2 scans of weight-bearing foot obtained under IRB approval from 21 subjects. The imaging protocol used a 90 kVp x-ray beam, 0.274 mm detector pixels, and Feldkamp image reconstruction with ~0.5 mm voxels and a ~20 cm3 Field-of-View (FOV).
In-house developed visualization and anatomical measurement software (JMAT, Ref. 4) was used by an expert reader to place seven anatomical landmarks (Fig. 1(b)) on the surfaces of calcaneous (two landmarks), talus (three landmarks), navicular (two landmarks), and cuboid (one landmark). The landmarks were chosen for inclusion because they are employed in common morphological measurements of the foot, such as Talonavicular Coverage Angle, Calcaneal Inclination Angle and Navicular to Skin Distance.8 To facilitate development of shape models, surfaces of the four bones of interest were manually segmented from the CBCT scans.
Evaluation studies followed the leave-one-out paradigm. Each of the weight-bearing CBCT scans was used as a test image once. A shape model of the calcaneus-talus-navicular-cuboid complex (CTNC complex), including mean landmark locations, was then built from segmented bone surfaces of the remaining 20 scans (Sec. 2.2). This model was used in conjunction either with a conventional single-bone ASM or with the proposed coupled ASM (Sec. 2.3) to obtain surface segmentations of the four bones and to localize the landmarks in the test image. The results were evaluated in terms of Root Mean Squared (RMS) surface error of the ASM (or cASM) segmentations compared to a reference manual segmentation of each bone, as well as in terms of distance between manually and automatically localized landmarks.
2.2. Shape model of the calcaneus-talus-navicular-cuboid complex
Manual surface segmentations of the bones were remeshed to have the same number of vertices in all datasets. Next, point correspondences between the meshes of all subjects were found using coherent point drift9, the meshes were rigidly Procrustes aligned, and Statismo10 was used to construct statistical shape models of the four bones of interest. We refer to the first principal component of that model as the mean shape.
The shape models were augmented with mean landmark positions. For each landmark, its manual location in each subject was first mapped to the closest vertex in the bone surface mesh of that subject. The landmark vertices of all subjects were then transported onto the mean shape using known point correspondences. Average position of the transported vertices was computed. The landmark was assigned to the mean shape vertex closest to this average position.
2.2. Coupled Active Shape Models (cASM) for segmentation and landmark localization
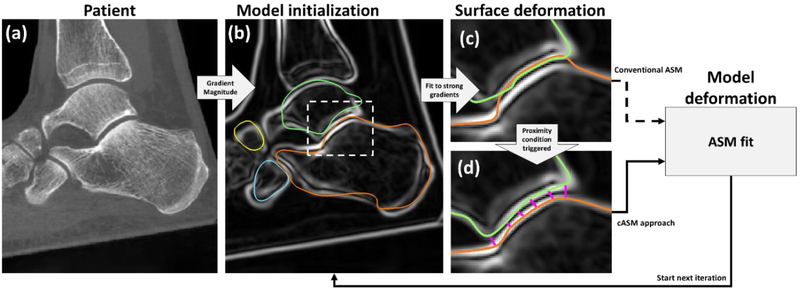
Conventional ASM4 involves iteratively updating a realization of the shape model to match the structure of interest in a target image. Each iteration begins by deforming the current realization of the shape model along its surface normals until it aligns with local gradient maxima of the target image (Fig. 2 (a)–(c)). The residual between the vertices of the undeformed surface mesh of the model and this gradient-matching surface (after Procrustes alignment) is then used to compute a new realization of the shape model.4 In this approach, the bones of the CTNC complex are fit independently. In areas adjacent to narrow joint spaces, the search for local gradient maxima may thus erroneously fit an edge of a neighboring bone. While this problem can be somewhat mitigated by adjusting the search distance, the margin of error in determining the optimal distance is only 1–5 voxels (typical joint space width). To overcome this challenge, we propose to apply ASM simultaneously to all bones forming a shape complex and to couple the shape model updates for neighboring bones by means of proximity constraints.
Figure 2.
Flowchart of ASM and the proposed cASM. (a) CBCT input image. (b) Gradient magnitude image of (a) with superimposed centroid-initialized initial mean bone shapes (orange: calcaneus, cyan: cuboid, yellow: navicular, green: talus). In (c), the mean shapes have been deformed along their normals to match local maxima of the gradient image. This aligned the calcaneus mesh with the articular surface of the talus. In conventional ASM, a new realization of the shape model would be computed using this erroneous gradient-matching surface. In cASM (d), the shape models of the bones are coupled by proximity constraints that act to push the gradient-matching surfaces apart inside the narrow joint space before a new realization of the ASM is estimated.
In cASM, each iteration also begins by deforming the current model realization to match local gradient maxima - performed simultaneously for all bones. In a crucial departure from conventional ASM, the vertices of the gradient-matching surfaces are then adjusted based on proximity criteria (Fig. 2(d)). First, we check for overlap of the gradient-matching surfaces using a triangle intersection test11. In the overlapping regions, the vertices of intersecting surfaces are pushed apart equidistantly. Next, we test for mean distance across each of the articular surfaces in the complex (listed in Fig. 1 (d)). If the mean distance between adjacent gradient-matching meshes fell outside of the min-max range for a given joint (Fig. 1 (d)), the vertices along this articular surface are moved so that their distance became equal to mean joint space width. Once the gradient-matching surfaces have been adjusted using proximity constraints, their residuals with the undeformed current model realization are used to update the model (Fig.2).
The ASM / cASM iterations were initialized using the mean shape model for each bone. The mean models were placed so that their centroids matched the centroids of the corresponding bones in a manual segmentation of the test image. Such automated initialization of model position was possible because all images had been segmented prior to leave-one-out evaluation of ASM / cASM. In a realistic scenario, a similar coarse translational alignment could be achieved by manual selection of approximate centers of each bone.
Both ASM and cASM were run for 100 iterations.12 The number of principal shape components used in the models increased every 10 iterations, starting with one (mean shape) and reaching 19 components at 100 iterations. Automated localization of anatomical landmarks was achieved by applying known point correspondences between the average landmark vertices on the mean shape (see Sec. 2.1.2) and vertices of the final realization of the active shape.
3. RESULTS AND BREAKTHROUGH WORK
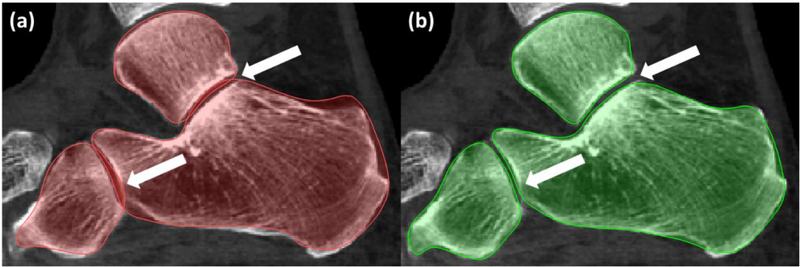
Fig. 3 (a) shows conventional ASM segmentation of an example dataset. Segmentation errors caused by individual bone ASMs matching to neighboring articular surfaces are apparent in the subtalar and calacneo-cuboid joints. The proposed cASM method with proximity constraints mitigates such errors, as illustrated for the same subject in Fig. 3 (b). Among the 21 leave-one-out experiments, collisions between the evolving shapes were detected by cASM in 17 cases for the talus, in 13 cases for the navicular, in 11 cases for the cuboid, and in 15 cases for the calcaneus. In all those cases, conventional ASM with individual model fitting would likely produce segmentations with bone overlap. In cASM, the coupling of shape models enabled identification of potential collisions to guide the models away from solutions involving bone intersections.
Figure 3.
A comparison of ASM (a) and cASM (b) segmentation of the same weight-bearing CBCT scan. Benefits of using coupled ASM with proximity constraints are apparent in the joint spaces.
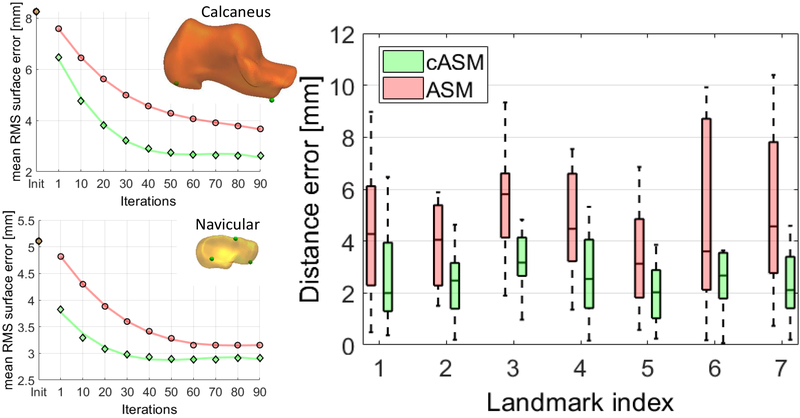
The RMS surface error (averaged across all bones of the CTNC complex and all leave-one-out experiments) compared to manual segmentation was improved from 3.6 mm with conventional ASM to 2.65 mm with cASM. Fig. 4 (left) investigates the convergence of ASM (red) and cASM (green) using calcaneus and navicular as examples. Mean RMS error of all subjects (all leave-one-out experiments) is shown as a function of shape model iteration. Faster convergence is achieved with cASM.
Figure 4.
(Left) Mean RMS surface error of the 21 subjects as function of ASM (red) and cASM (green) iterations. (Right) Distance errors of seven common anatomical bone surface landmarks obtained with ASM (red) and cASM (green). The box-and-whisker plots represent error distributions from leave-one-out experiments with 21 subjects.
The right panel of Fig. 4 shows the accuracy of landmark localization for ASM (red) and cASM (green). The plots summarize the distribution of distance errors across all leave-one-out experiments. For all landmarks, cASM achieved lower distance error (up to 50% reduction) and more consistent performance across the datasets. Error reduction was achieved not only for landmarks close to articular surfaces, but also for those that are more distant (e.g. landmark 1, calcaneal tuberosity) indicating that cASM leads to a globally improved fit of the shape model to the image.
4. CONCLUSIONS
We developed a new ASM framework for complexes of tightly interlocking shapes. The proposed coupled ASM was applied to bone segmentation and landmark identification in 3D images of the foot acquired with weight-bearing CBCT. Compared to conventional ASM, cASM achieved 26% reduction in segmentation surface error and up to 55% reduction in landmark distance error. In this feasibility study, 20 volumes were used for each leave-one-out realization of the ASM model. We are currently expanding the sample size to ~40 subjects to capture additional modes of shape variability. This will likely further reduce the segmentation and landmark distance errors. The cASM algorithm provides a general strategy for incorporating geometric constraints in shape model fitting.
Other applications of such constraints in imaging of the extremities may include ASM segmentation in the presence of known surgical components or when the bones of interest are partly truncated due to limited imaging field of view (e.g. tibia and fibula). Here, an exclusion of the implant regions or fracture sites during the ASM process might help to compensate for missing information when using a full joint model. The coupled ASM framework is thus anticipated to find broad applicability in automated analysis of weight-bearing CBCT.
ACKNOWLEDGEMENTS
This work was supported by NIH Grant R01-EB-018896 and Carestream Health (Rochester NY).
REFERENCES
- [1].Tuominen EKJ, Kankare J, Koskinen SK and Mattila KT, “Weight-bearing CT imaging of the lower extremity,” Am. J. Roentgenol 200(1), 146–148 (2013). [DOI] [PubMed] [Google Scholar]
- [2].Carrino JA, Al Muhit A, Zbijewski W, Thawait GK, Stayman JW, Packard N, Senn R, Yang D, Foos DH, Yorkston J and Siewerdsen JH, “Dedicated cone-beam CT system for extremity imaging”, Radiology, 270(3), 816–824 (2013). [DOI] [PMC free article] [PubMed] [Google Scholar]
- [3].Richter M, Zech S, Hahn S, Naef I and Merschin D, “Combination of pedCAT® for 3D Imaging in Standing Position With Pedography Shows No Statistical Correlation of Bone Position With Force/Pressure Distribution”, The Journal of Foot & Ankle Surgery 55, 240–246 (2016). [DOI] [PubMed] [Google Scholar]
- [4].Görres J, Brehler M, Franke J, Vetter SY, Grützner PA, Meinzer H-P and Wolf I, “Articular surface segmentation using active shape models for intraoperative implant assessment”, Int. J. Comput. Assist. Radiol. Surg 11, 1661–72 (2016). [DOI] [PubMed] [Google Scholar]
- [5].Brehler M, Thawait GK, Shyr W, Ramsay J, Siewerdsen JH and Zbijewski W, “Atlas-based automatic measurements of the morphology of the tibiofemoral joint”, Proc. SPIE--the Int. Soc. Opt. Eng 10137 (2017). [DOI] [PMC free article] [PubMed] [Google Scholar]
- [6].Shakoor D, Osgood GM, Brehler M, Zbijewski WB, de Cesar Netto C, Shafig B, Orapin J, Thawait GK, Shon LC and Demehri S, “Cone-beam CT measurements of distal tibio-fibular syndesmosis in asymptomatic uninjured ankles: does weight-bearing matter?”, Skeletal Radiology 48(4), 583–594 (2019). [DOI] [PubMed] [Google Scholar]
- [7].Cootes TF, Taylor CJ, Cooper DH and Graham J, “Active Shape Models-Their Training and Application”, Comput. Vis. Image Underst. 61, 38–59 (1995). [Google Scholar]
- [8].de Cesar Netto C, Schon LC, Thawait GK, da Fonseca LF, Chinanuvathana A, Zbijewski W, Siewerdsen JH, and Demehri S, “Flexible adult acquired flatfoot deformity: Comparison between weight-bearing and non-weight-bearing measurements using cone-beam computed tomography”, J Bone and Joint Surg Am. 99(18), e9 (2017). [DOI] [PubMed] [Google Scholar]
- [9].Myronenko A and Song X, “Point set registration: Coherent point drift”, IEEE transactions on pattern analysis and machine intelligence, 32(12), 2262–2275 (2010). [DOI] [PubMed] [Google Scholar]
- [10].Luthi M, Blanc R, Albrecht T, Gass T, Goksel O, Buchler P, Kistler M, Bousleiman H, Reyes M, Cattin P and Vetter T, “Statismo-A framework for PCA based statistical models”, The Insight Journal, 1–18 (2012). [Google Scholar]
- [11].Moller T, “A fast triangle-triangle intersection test”, Journal of graphics tools, 2(2), 25–30 (1997). [Google Scholar]


