Abstract
Combining HLA-DQ-gluten tetramers with mass cytometry and RNA sequencing analysis, we find that gluten-specific CD4+ T cells in the blood and intestines of patients with celiac disease display a surprisingly rare phenotype. Cells with this phenotype are also elevated in patients with systemic sclerosis and systemic lupus erythematosus, suggesting a way to characterize CD4+ T cells specific for disease-driving antigens in multiple autoimmune conditions.
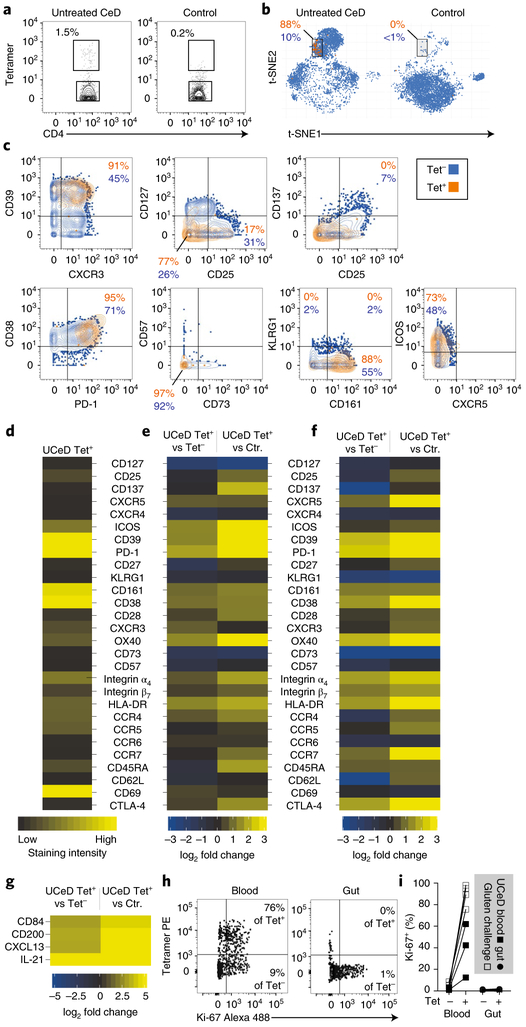
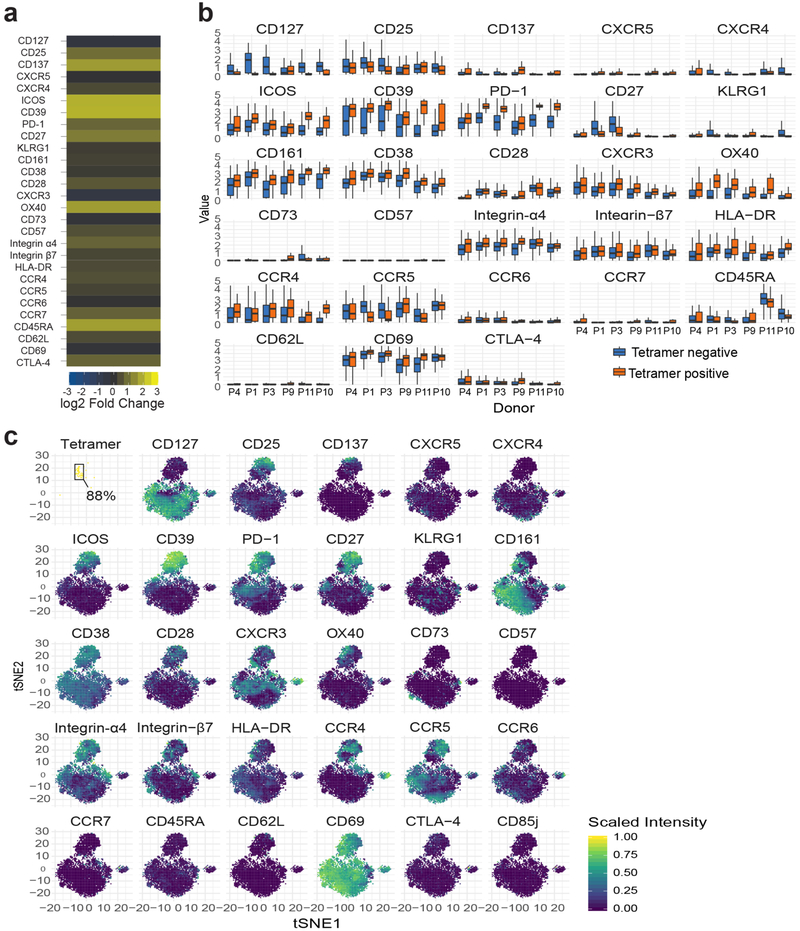
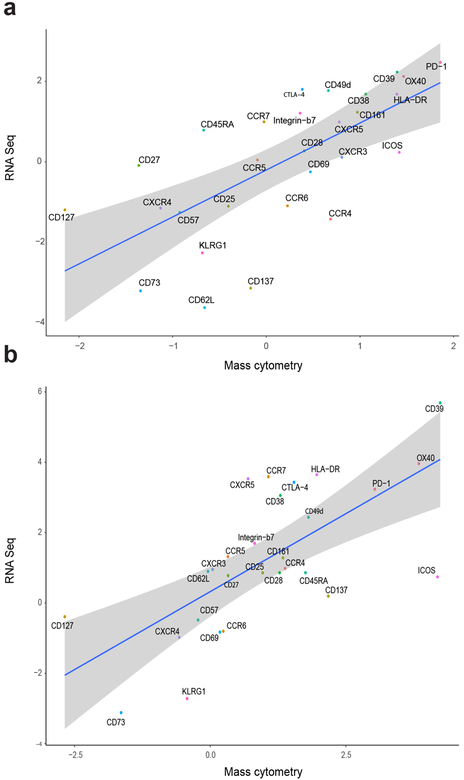
Celiac disease (CeD) is a human leukocyte antigen (HLA)-DQ2/HLA-DQ8-associated autoimmune enteropathy driven by the activation of gluten-specific CD4+ T lymphocytes upon gluten consumption1. We combined gluten peptide-HLA class II tetramers with a 43-parameter antibody panel for mass cytometry analysis (Extended Data Figs. 1 and 2 and Supplementary Table 1). We found that cells binding to these tetramers, representing five gluten peptides complexed to HLA-DQ2.5 (Supplementary Table 2), cluster within a surprisingly narrow subset of small intestinal CD4+ T cells in HLA-DQ2.5+ patients with untreated CeD and comprise 0.3–1.5% of the total (Fig. 1a,b and participants: Supplementary Table 3). These gut T cells expressed multiple activation markers (C-X-C chemokine receptor type 3 (CXCR3), CD38, CD 161, CD28, HLA-DR and 0X40 (also known as TNFRSF4)) as well as CD39 and programmed cell death protein 1 (PD-1), suggestive of chronic activation, whereas are negative for the exhaustion marker killer cell lectin-like receptor subfamily G member 1 (KLRG1) (Fig. 1c–e, Supplementary Table 4 and per donor in Extended Data Fig. 3). Importantly, the transcriptional profile of these tetramer-positive CD4+ gut T cells correlates highly with the surface marker expression (Fig. 1f and Extended Data Fig. 4).
Fig. 1|. Distinct non-proliferative phenotype of gluten-specific CD4+ gut T cells.
a, HLA-DQ2.5-gluten tetramer (tet) staining in a patient with untreated CeD (UCeD) and a control subject with mass cytometry. b, t-SNE plots of total CD4+ gut T cells in an UCeD patient and a control subject. c,d, Expression of proteins on tet+/tet− CD4+ gut T cells in an UCeD patient (c) and summarized for tet+ cells in the six merged patients with UCeD (d). CTLA-4, cytotoxic T lymphocyte protein 4. e,f, Mass cytometry-derived (e) and RNA-seq-derived (f) log2 fold-change expression of the indicated markers in tet+ versus tet− CD4+ gut T cells of patients with UCeD and compared to CD4+ gut T cells of control subjects (Ctr.). n = 6 patients with UCeD, 7 controls, 5 experiments (a–e). g, RNA-seq-derived log2 fold-change expression of the indicated markers in CD4+ gut T cells, differentially expressed in tet+ versus tet− and versus CD4+ gut T cells in control subjects. n = 5 patients with UCeD, 4 control subjects, 2 experiments (f,g). h,i, Flow cytometry-derived Ki-67 expression in tet+/tet− CD4+ blood and gut T cells of a gluten-challenged and UCeD patient, respectively (h), summarized for five gut samples, seven blood samples (four experiments) (i).
In addition, RNA sequencing (RNA-seq) analysis demonstrated that CD200, CD84, C-X-C motif chemokine 13 (CXCL13) and inter-leukin-21 (IL-21) are transcribed as well (Fig. 1g and the complete list in Supplementary Table 5). These markers are characteristic of follicular B helper T cells, except that CXCR5 was not detectable on the surface of tetramer-positive gut T cells (Fig. 1c–e), despite some transcription (Fig. 2f). Relevant to this, it was recently demonstrated that CD4+/PD-1+/CXCR5− cells, of unknown antigen specificity, are expanded in the synovium of seropositive patients with rheumatoid arthritis and express a similar phenotype to what we report here, including expression of CD200, CXCL13, IL-21, PD-1, inducible T-cell costimulator (ICOS), 0X40 and CD28 (ref.2). The authors speculated that these cells induce plasma cell differentiation in the inflamed tissue. In general, T cell-induced plasma cell differentiation should show signs of proliferation and, with respect to the gluten-specific CD4+ T cells analyzed here, the proliferation marker Ki-67 was expressed in the blood (13–98%) but not in the gut (Fig. 1h,i). Conceivably, gluten-specific T cells in CeD can promote the production of disease-specific antibodies to transglutaminase 2 and deamidated gluten peptides3. Our findings here, together with previous reports showing that these disease-specific gut plasma cells are negative for Ki-67 (refs.4,5), indicate that the disease-relevant T cells and B cells initially interact and proliferate outside the celiac lesion. Once entering the gut, T cells may interact with plasma cells via the plasma cell presentation of gluten T cell epitopes6 and influence the microenvironment. IL-21 is a key cytokine for plasma cells7 and intraepithelial lymphocytes8, both of which are increased in the celiac gut lesion1,4.
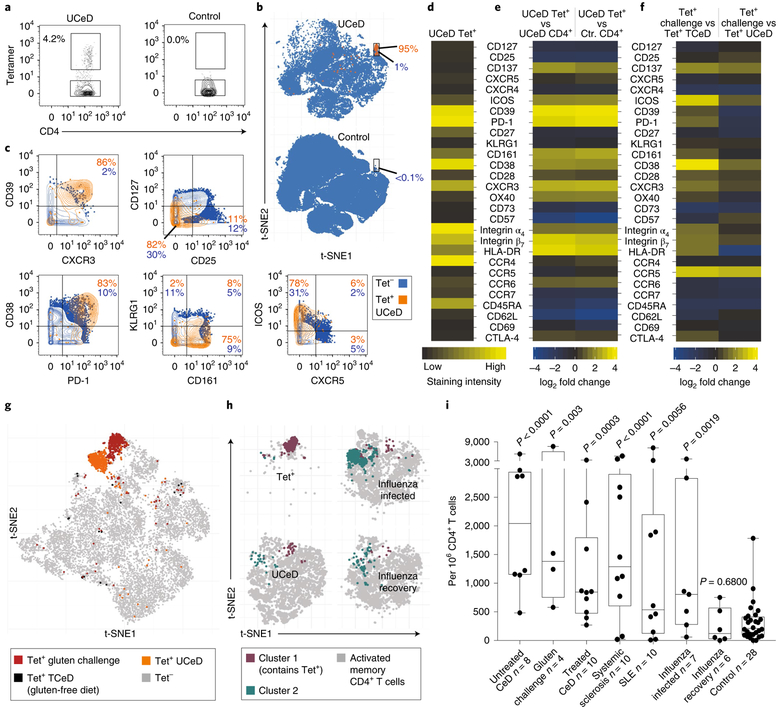
Fig. 2 |. Distinct, antigen-induced phenotype of gluten-specific CD4+ blood T cells and occurrence of a similar subset in other immune conditions.
a, HLA-DQ2.5:gluten tet staining with mass cytometry for a patient with UCeD and control subject, b, t-SNE plots with CD4+ blood T cells of a patient with UCeD and control subject, c, Expression of proteins on tet+/tet− CD4+ blood T cells of a patient with UCeD. d, Heat map with absolute expression (staining intensity) of tet+ cells, e, log2 fold change for tet+ versus pre-tet-enriched CD4+ T cells. n = 7 patients with UCeD, 10 control subjects, 9 experiments (a–e). f, log2 fold-change expression of indicated markers for tet+ CD4+ blood T cells before versus following gluten challenge of five patients with treated CeD (TCeD) and versus tet+ cells of seven patients with UCeD (same patients with UCeD in d and e). g, t-SNE plot with tet− and tet+ cells in a TCeD subject before and following gluten challenge compared to tet+ of an UCeD subject. Three representative experiments are shown in f and g. h, t-SNE plots and unsupervised clustering of activated (CD38+) memory (CD45RA−) CD4+ blood T cells in the indicated participant groups (n = 5 distinct samples in each group) and tet+ cells of seven patients with UCeD. Cluster 1, containing 75% of tet+ cells from patients with UCeD, and cluster 2, upregulated in subjects with influenza infection (Extended Data Fig. 8), are color coded, i, Unbiased prevalence estimate among the indicated participant groups (19 experiments) for cells with the same phenotype profile as tet+ cells in patients with UCeD, using a supervised classification model (Extended Data Fig. 8). P values were calculated with an unpaired, two-tailed t-test. The median frequency, interquartile range and maximum/minimum whiskers are shown for the box plots. SLE, systemic lupus erythematosus.
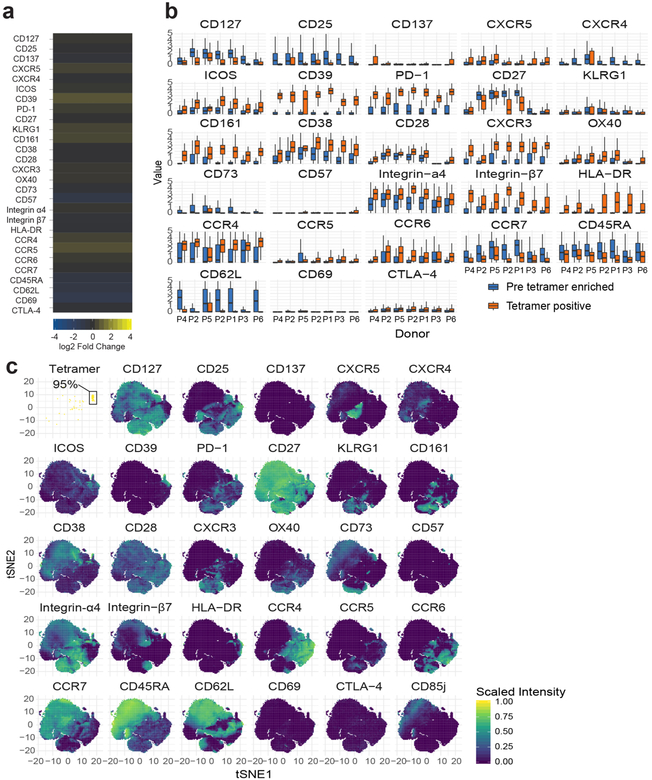
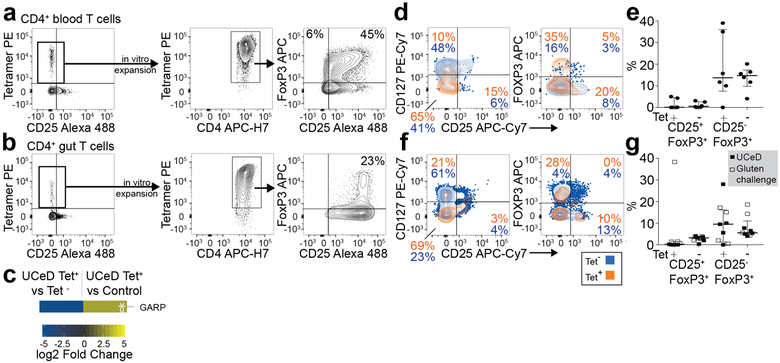
Although the relationship between lymphocytes in the blood versus those in tissues is frequently a question, here, we find that gluten tetramer-binding T cells in the blood of patients with untreated CeD largely expresses the same pattern of markers as in the gut (CXCR3+, CD38+, CD39+, PD-1+, HLA-DR+, CD161+, KLRGl−, CD28+ and OX40+; Fig. 2a–e and per donor in Extended Data Fig. 5), except for being CD69−. Furthermore, despite Ki-67 expression (Fig. 1h,i), only a small fraction of the tetramer-positive cells in the blood expressed CXCR5 (confirmed by FACS in Extended Data Fig. 6) and thus do not express a classical follicular T helper cell phenotype. As previously observed9–11, the tetramer-binding cells were almost exclusively effector memory cells (CD45RA− and CD62L−), integrin ß7+ and CD38+. It was recently reported that most gluten-specific cells express a regulatory T cell phenotype (CD127−/CD25+/Foxp3+) after gluten exposure in vitro12. While confirming this finding (Extended Data Fig. 7a,b), our ex vivo analysis revealed that these cells are CD137low, chiefly CD25− (Figs. 1 and 2), and negative for the regulatory T cell marker GARP (Extended Data Fig. 7c). In addition, although some gluten-specific cells express Foxp3, these cells were CD25− (Extended Data Fig. 7d–g). Thus, gluten-specific T cells in vivo do not express a classical regulatory T cell phenotype.
We next asked whether antigenic stimulation drives these CD4+ T cells. This involved a 3-day oral gluten challenge in five patients with CeD (previously on a gluten-free diet), which is known to mobilize preexisting clones of gluten-specific and gut-homing T cells into the blood on day6 (refs.10,13). Upon challenge, these cells upregulated markers expressed by gluten-specific cells in the patients with untreated celiac, including CD38, CD39, CXCR3, PD-1, ICOS, CD 161, C-C chemokine receptor type 5 (CCR5) and CD28 (Fig. 2f). These cells clustered in close proximity to tetramer-binding cells in untreated CeD (Fig. 2g), differing chiefly by higher CCR5 and lower CD39 expression after the gluten challenge. Taken together, specific antigen stimulation in vivo prompts gluten-specific T cells with an almost identical phenotype as those typical of untreated CeD.
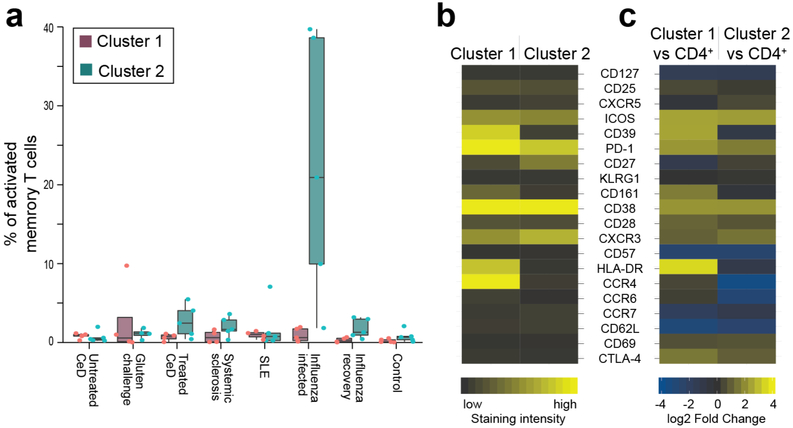
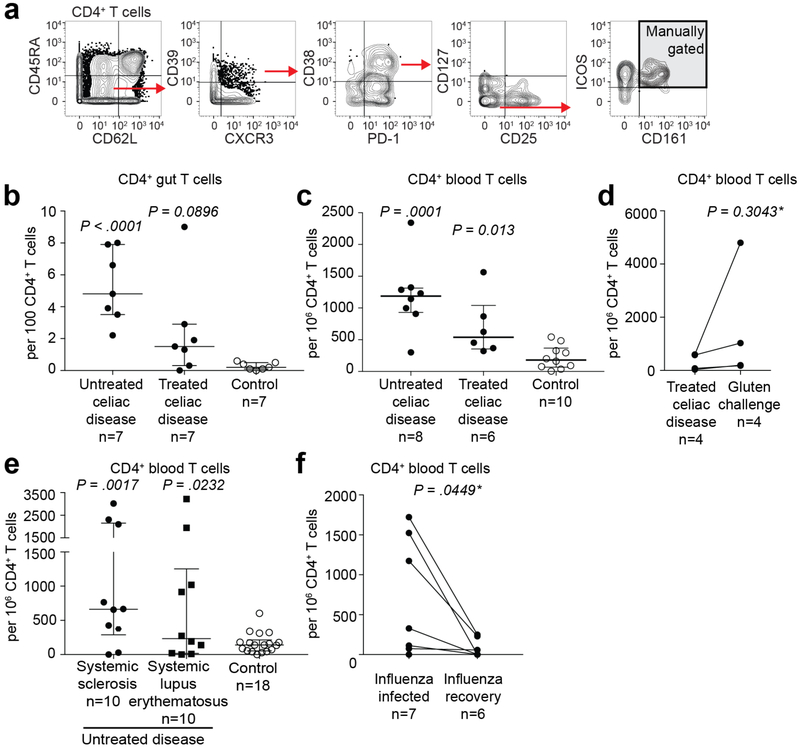
To characterize the CD4+ T cells in patients with other autoimmune conditions, we performed mass cytometry analysis in peripheral blood mononuclear cells (PBMCs) of patients with systemic sclerosis and systemic lupus erythematosus, together with CeD subjects and presumably healthy blood bank donors (participants: Supplementary Table 6 and antibody panel: Supplementary Table 7). We also included subjects suffering from acute influenza infection for comparison purposes. Unsupervised clustering of activated (CD38+), memory (CD45RA−) CD4+ blood T cells showed that, unlike in CeD and the two other autoimmune conditions, the influenza response was dominated by a CD161−/CD39− subset (Fig. 2h), which faded with disease recovery and was very low in the other samples (Extended Data Fig. 8). We then tested whether an unbiased estimation (Extended Data Fig. 9) would report elevated levels of cells with the gluten-specific T cell phenotype profile in these disease states. Strikingly, we found that seven out of eight patients with untreated CeD, eight out of ten patients with systemic sclerosis and four out of ten patients with systemic lupus erythematosus had significantly elevated numbers of CD4+ T cells with this phenotype compared to controls (Fig. 2i). Manual gating gave similar results (Extended Data Fig. 10), and we conclude that this subset is elevated in many patients with these types of autoimmunity. Although four out of seven influenza-infected individuals also showed elevated numbers of CD4+ T cells with the phenotype displayed by gluten-specific cells, this was only a minor part of an influenza response (median <2% versus 20% constituted by the CD161−/CD39− subset; Fig. 2h and Extended Data Fig. 8). It is nonetheless intriguing that CD4+ T cells with the unique phenotype of gluten-specific cells are elevated not only in autoimmune conditions but also transiently during the acute phase of a viral infection. We speculate that these cells, unlike the CD161−/CD39− cells, may represent self-antigen-specific T cell clones that cross-react with influenza antigens, as suggested by the abundance of self-specific cells in healthy humans14 and their propensity for cross-reactivity15.
In conclusion, CeD is the only human autoimmune disease in which the causative antigen is known, despite decades of effort in other systems. Here, our results, combined with similar findings in rheumatoid arthritis2, strongly suggest that there is a distinct and relatively rare type of CD4+ T lymphocytes that is common to multiple autoimmune disorders and transiently in at least one viral infectious disease. As we know that most or all of the gluten-specific T cells are in this subset in patients with CeD, it is reasonable to imagine that these cells might also be the key disease-driving T cells in other autoimmune diseases.
Methods
Human material.
All participants gave informed written consent. We obtained patient material from the Endoscopy Unit and the Rheumatology Department at Oslo University Hospital (Oslo, Norway), from the Immunology and Rheumatology Division at the Department of Medicine, and influenza patient material from the Emergency Department and the Express Outpatient Clinic at Stanford Hospital (Stanford, CA, USA). All patients with CeD were HLA-DQ2.5+ (that is, DQA1*05 and DQB1*02) or HLA-DQ8+ (that is, DQA1*03 and DQB1*03:02) and diagnosed according to the guidelines of the British Society of Gastroenterology16. The histological appearance in the duodenal mucosa was graded according to the Marsh score: normal mucosa (Marsh score 0), increased number of intraepithelial lymphocytes (Marsh score 1), hyperplastic lesion and crypt hyperplasia (Marsh score 2) and various degree of villous atrophy (Marsh score 3A–C)17,18. The studies on patient material obtained from subjects examined at Oslo University Hospital during routine follow-up were approved by the Regional Committee for Medical and Health Research Ethics South-East Norway (2010/2720). Patients with treated CeD who were challenged with gluten received one in-house-produced cookie containing 10 g of enriched flour (Validus AS) each day for 3 days and blood samples were taken on day 6 after gluten challenge when a peak in the frequency of gluten-specific CD4+ blood T cells was expected10,19 (Regional Committee for Medical and Health Research Ethics South-East Norway, 2013/1237, ClinicalTrials.gov identifier: ). Blood samples from patients during and after influenza virus infection were obtained from a cohort of patients recruited from individuals with influenza-like symptoms attended at the Emergency Department or the Express Outpatient Clinic at Stanford Hospital. The study was approved by the Stanford University Administrative Panels on Human Subjects in Medical Research and covered by IRB 22442 (Immune Responses to Influenza-like Illness). Patients who tested positive for influenza A virus through a nasopharyngeal swab test (analyzed at the Virology Lab at Stanford Hospital) were included. All the included participants also tested negative with the same swab test for influenza B virus, parainfluenza 1, 2 and 3 viruses, metapneumovirus and rhinovirus. Included participants were examined again 23 to 41 days after their initial medical examination and inclusion. One of the seven included patients did not donate blood at this second consultation. Influenza-associated symptoms of participants from the influenza cohort were documented on a patient diary and were evaluated by a research nurse at inclusion and during the follow-up visit. The definition of infection recovery was based on the resolution of influenza-like symptoms at the follow-up visit. Our study cohort of patients with autoimmune disorders other than CeD did not receive immunomodulating treatment at the time of blood draw and met classification criteria for systemic sclerosis20 or systemic lupus erythematosus21, respectively. The recruitment of these patients was covered by the Regional Committee for Medical Research Ethics in South-East Norway (2016/119) and IRB 14734 (Stanford University Immunological and Rheumatic Disease Database: Disease Activity and Biomarker Study). Buffy coats were obtained from anonymous blood donors at the Stanford Blood Center or Oslo University Hospital (blood bank).
We isolated PBMCs through density gradient centrifugation (Lymphoprep, Axis Shield). Duodenal biopsies were treated 2 × 10min with 2mM EDTA + 2% FCS in PBS at 37 °C to remove the epithelial layer prior to further digestion with collagenase (1 mg ml−1) in 2% FCS in PBS at 37 °C for 60 min. The samples were then homogenized using a 1.2-mm syringe and filtered through a 40-μm or 70-μm cell strainer to obtain single-cell suspensions. All samples were cryopreserved.
HLA class II tetramer staining and mass cytometry.
The protocol established here was partially derived from protocols on a combination of HLA class-I tetramers and mass cytometry22,23. We thawed the frozen cell samples in 20% FCS in RPMI and washed the cells in 10% FCS with Benzonase (Sigma-Aldrich/Merck, 1:10,000) in RPMI before resuspending and counting the cells in CyFACS buffer (0.1% BSA, 2mM EDTA and 0.05% sodium azide in PBS). After 450g centrifugation, cells were treated with 1:10 diluted FcR block (Miltenyi Biotek), stained with anti-CD11c, anti-CD14 and 5 μgml−1 purified anti-CD32 (clone FUN-2) to reduce nonspecific tetramer binding, and barcoded with anti-CD45 coupled with 89Y or 108Pd24 in 200 μl CyFACS buffer. Only names and staining concentrations of monoclonal antibodies that are not listed in Supplementary Tables 1 and 7 are specified here. After one wash step, the samples from patients with CeD were stained for 40 min at room temperature with HLA-DQ2.5:gluten tetramers representing the five different disease-relevant and immunodominant gluten T cell epitopes25—DQ2.5-glia-α1a, DQ2.5-glia-α2, DQ2.5-glia-ω1, DQ2.5-glia-ω2 and DQ2.5-hor3 (Supplementary Table 3)—at 15 μgml−1 each in 200 μl CyFACS buffer, in the case of peripheral blood mononuclear cells (PBMCs), or 100 μl CyFACS buffer, in the case of biopsy-derived single-cell suspensions. We also added tetramers representing HLA-DQ2.5:CLIP2 at a concentration of 20 μgml−1 to exclude tetramer background staining (Extended Data Fig. 1d). HLA-DQ2.5:gluten and HLA-DQ2.5:CLIP2 molecules were produced as previously described26 and, 2 h before cell staining, multimerized on phycoerythrin (PE)-cyanine7 (Cy7)-coupled streptavidin or allophycocyanin (APC)-Cy7-coupled streptavidin, respectively (Thermo Fisher Scientific). The cells were washed and tetramer-binding cells were metal tagged with 1.25 μl anti-PE and 1.25 μl anti-phycocyanin for 20 min on ice in 100 μΐ CyFACS buffer followed by another wash step. To facilitate tetramer enrichment, the PBMCs of patients with CeD were resuspended in 50 μl anti-Cy7 metal beads with 150 μl CyFACS buffer and incubated for 20 min on ice (combined anti-Cy7 enrichment and anti-PE staining was established with the T cell clone TCC1214P.A.27, derived from the blood of patients with CeD9, and is visualized in Fig. 1c). The cells were washed and 2% of the PBMCs of patients with CeD (pre-tetramer-enriched sample) were removed and added to 1 million CD45-barcoded carrier cells of a healthy donor to reduce cell loss and left on ice until further staining. The remaining PBMCs of patients with CeD were enriched for tetramer-binding cells on a magnetized LS column (Miltenyi Biotec). We then added 1 million CD45-barcoded PBMCs from a healthy donor to the tetramer-enriched sample (and to the biopsy-derived single-cell suspensions that had not undergone tetramer enrichment), and washed the cells once before all samples were stained for 20 min on ice with a panel of metal-coupled antibodies (Supplementary Table 1 or in the case of participants included in Extended Data Fig. 10e,f; Supplementary Table 7). After one wash step, the cells were stained for 5 min at room temperature with cisplatin (Fluidigm) at 1/1,500 concentration and washed before overnight incubation at 4°C with 1:1,000 diluted 125 μM DNA intercalator in Maxpar Fix and Perm Buffer (Fluidigm). The following day, we washed the cells in CyFACS buffer, PBS and milli-Q water (IX each) before they were analyzed in milli-Q water using a Helios instrument (Fluidigm). Unlike in the gut samples analyzed here and in previous studies on gluten-specific cells in the blood using flow cytometry9,27, we have not specified the frequency of tetramer-binding cells in the blood analyzed with mass cytometry as washing, resuspension in water and mass cytometer tubing considerably reduced the number of cells (including tetramer-binding cells) in the tetramer-enriched sample relative to the total number of CD4+ T cells in the sample.
Prior to the establishment of the protocol, we also used fluorescein-coupled streptavidin (BioLegend) and anti-fluorescein 160Gd (Fluidigm) (Extended Data Fig. 1a) and the gluten-specific T cell clone TCC1030.43 derived from the blood of patients with CeD9 to determine which fluorophore generated the best staining intensity through secondary metal-tagged antibody staining. In each experiment, we stained a gluten-specific T cell clone with the corresponding HLA-DQ2.5:gluten tetramer as a positive control for tetramer staining with mass cytometry. The T cell clones used to establish and validate the HLA class II tetramer staining with mass cytometry can be provided on request after completion of a material transfer agreement.
Flow cytometric analysis.
We prepared and stained CeD blood and biopsy material including T cell clones with HLA-DQ2.5:gluten tetramers and surface markers according to protocols described elsewhere9,13. One patient with CeD analyzed with flow cytometry was HLA-DQ8+/HLA-DQ2.5−, and for this subject, we used HLA-DQ8:gluten tetramers representing the two gluten epitopes HLA-DQ8-glia-α1 and HLA-DQ8-glia-γ1b28. Tetramer-sorted cells were cultured in vitro as previously described29. Staining for Ki-67 and Foxp3 was performed according to the manufacturer’s protocol (Thermo Fisher Scientific’s eBioscience Foxp3/Transcription Factor Staining Buffer Set). Antibodies used for flow cytometry staining are listed in Supplementary Table 8. The cells were analyzed with a LSR II instrument or sorted on a FACS Aria II instrument (BD Bioscience).
RNA-seq analysis.
Single-cell suspension of duodenal biopsies from five patients with CeD and four healthy subjects (Supplementary Table 3) were stained with PE-conjugated HLA-DQ2.5:gluten tetramers representing four immunodominant T cell epitopes of gluten: DQ2.5-glia-α1a, DQ2.5-glia-α2, DQ2.5-glia-ω1 and DQ2.5-glia-ω2 (ref.28) (Supplementary Table 2), as previously described30. Following tetramer staining, the cells were labeled with anti-CD3 BV570 (BioLegend), anti-CD4 APC-H7 (BD Biosciences), anti-CD14 Pacific Blue (BioLegend), anti-CDllc Horizon V450 (BD Bioscience), anti-CD27 PE-Cy7 (eBioscience), IgA FITC (Southern Biotech) and Live/Dead Fixable Violet Dead Cell Stain (Thermo Fisher Scientific). See also the Nature Research Reporting Summary for more details on the antibodies used. We added anti-CD27 and anti-IgA owing to a parallel study on a different cell subset. HLA-DQ2.5:gluten tetramer-positive and tetramer-negative CD4+ T cells were sorted in two separate tubes using FACS Aria II (BD Bioscience). RNA was extracted using RNeasy Micro Kit (Qiagen) and quantified on a 2100 Bioanalyzer using a RNA 6000 Pico Kit (Agilent Technologies).
Approximately 90 ng RNA was used for cDNA synthesis and amplification. cDNA synthesis was performed at 42 °C for 90 min and 70 °C for 10 min. cDNA was amplified with these PCR conditions: 95 °C for 1 min; followed by 15 cycles (98°C for 10 s; 65 °C for 30 s; and 68 °C for 3 min) and 72 °C for 10 min using the SMARTer Ultra Low Input RNA Kit for Sequencing v3 (Clontech Laboratories). Amplified cDNA was quantified using the High Sensitivity DNA Kit (Agilent Technologies). Tagmentation and adapter ligation were achieved using the Nextera XT library preparation kit (Illumina). Amplicon libraries were sequenced on NextSeq500 (Illumina) at the Norwegian Sequencing Center (http://www.sequencing.uio.no).
Statistics and data analysis.
Both mass cytometry and flow cytometry data were analyzed with Flowjo version 10.4 (Flowjo LLC) for visualization of data in two-parametric 2D plots (Figs. 1a,c and 2a,c,h and Extended Data Figs. 1a–d, 2, 6, 7a,b,d,f and 10a) and for cell quantifications (Extended Data Figs. 7e,g and 10b–f). We used the GraphPad Prism 7 software (GraphPad Software) for statistical analysis and visualization of cell frequencies (Fig. 1i and Extended Data Figs. 7e,g and 10b–f). Here, we applied an unpaired, two-tailed f-test (Extended Data Fig. 10b,c,e (the median frequency and interquartile range indicated)) or a paired, two-tailed f-test (Extended Data Fig. 10d,f) to calculate statistical significance. We also used Flowjo to exclude cells that were not CD4+ T cells (gating strategy in Extended Data Fig. 2) before exporting the fcs files, containing only CD4+ blood or gut T cells, for the generation of t-SNE (f-distributed stochastic neighbor embedding) plots31 and all other analysis presented in Figs. 1d–g and 2d–i and Extended Data Figs. 3–5, 8 and 9. The markers used to generate the t-SNE plots in Figs. 1b and 2b,g and Extended Data Figs. 3c and 5c (31 markers in both gut and blood samples, which did not include the marker for tetramer staining (165Ho anti-PE)) are identified with one asterisk in Supplementary Table 1.
Mass cytometry data (the fcs file containing only blood or gut CD4+ T cells) were loaded into R using the flowCORE package. Here, the aggregate marker intensity (Figs. 1d and 2d and Extended Data Fig. 8b) was computed as the grand mean of each donors mean marker intensity. Mass cytometry fold change (Figs. 1e and 2e,f and Extended Data Figs. 3a, 5a, 7c and 8c) was computed as the log2 fold change of the aggregate marker intensity. Heat maps, to visualize the aggregate marker intensity and the log2 fold change, were generated using ggplot2, and the t-SNE plots were generated using the Rtsne package. For t-SNE plots, box plots (Extended Data Figs. 3b and 5b), supervised classification (Fig. 2i and Extended Data Fig. 9) and fold-change significance testing (Supplementary Table 4), the raw mass cytometry intensity values were first transformed using the inverse hyperbolic sine, as described by Nowicka et al.32. In the generated box plots in Extended Data Figs. 3b and 5b (generated with ggplot2), the y axis indicates ArcSinh-transformed intensity and the boxes show the median frequency and interquartile range. Whiskers show the largest and smallest values below 1.5 times the interquartile range. In Supplementary Table 4, we used a paired, two-tailed f-test to calculate significant differences in the mean marker intensity between tetramer-positive and tetramer-negative cells from patients with CeD in the blood and the gut. In the same table, we performed an unpaired, two-tailed f-test for all other comparisons in which the test conditions were from unmatched donors (for example, patients with CeD versus healthy controls). P values were corrected for multiple testing using the Benjamini-Hochberg procedure.
In Fig. 2h and Extended Data Fig. 8, we did unsupervised clustering of activated (CD38+) memory (CD45RA−) CD4+ T cells using the FlowSOM and ConsesusClusterPlus packages. To avoid introducing bias to the clustering and the t-SNE visualization, we had a balanced number of cells and samples per disease group. Thus, we randomly selected five samples per disease, except for gluten challenge in which we only had four samples with sufficient cells. Furthermore, we sampled at most 3,707 activated cells per sample, which is the median number of cells per sample, and used these cells for clustering. For t-SNE visualization in Fig. 2h, we subsampled 807 cells per sample, which is the number of activated cells in the smallest sample. We visualized the prevalence of cells within the two clusters (cluster 1 and cluster 2) in a box plot (Extended Data Fig. 8a), indicating the median frequency and interquartile range. Here, the whiskers show the largest and smallest values below 1.5 times the interquartile range and single data points depict outliers. The markers used to generate the t-SNE plot in Fig. 2h and Extended Data Fig. 8 are listed in Extended Data Fig. 8b,c.
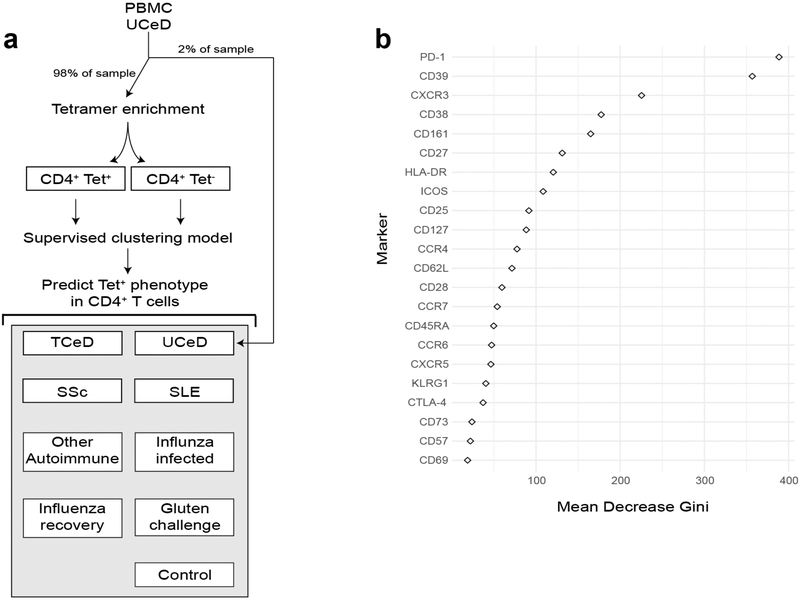
We trained a supervised classification model on tetramer-positive and tetramer-negative CD4+ T cells from tetramer-enriched PBMC samples from patients with untreated CeD (Fig. 2i, with a diagram illustrating the workflow in Extended Data Fig. 9). The model was subsequently used to obtain an unbiased prevalence estimate of CD4+ T cells with a phenotype highly similar to the gluten-specific CD4+ T cells in all included blood samples analyzed with mass cytometry (excluding the tetramer-enriched samples that were only used to train the model). More specifically, we used 10-fold cross-validation with three repeats to train a random forest model33 using caret version 6.0–79. The optimal mtry parameter for the data was selected with a grid search between one and the total number of markers divided by three. Log loss was used as a metric to select the optimal model. The doMC package, version 1.3.5, was used to parallelize model training. We used the GraphPad Prism 7 software to visualize the prevalence estimates in a box plot (Fig. 2i), which shows the median frequency and interquartile range, whereas the whiskers indicate the maximum and minimum values. Here, P values (each participant group versus the group of healthy controls) were calculated using an unpaired, two-tailed f-test. The markers used to generate the prediction model in Fig. 2i (the 22 CD4+ T cell markers that were common to the two mass cytometry staining panels in Supplementary Tables 1 and 7) are identified with two asterisks in Supplementary Table 7. The importance function of the randomForest package was used to extract the mean decrease Gini score from the final model. A high-scoring parameter is important to the model and a low-scoring value is less relevant. This Gini score is visualized in Extended Data Fig. 9b using ggplot2.
RNA-seq reads (76-bp paired end) were mapped to the human reference genome GRCh38.p7 containing alternative loci with gene annotations curated by Ensembl release 86 using Salmon34 version 0.7.2 for mapping with parameters −1 UI—useVBOpt—numBootStraps 30—seqBias—gcBias. The quasi-mapping index in Salmon was built using a default k-mer length of 31. Read counts of transcripts (including those on alternative loci) were aggregated to gene level. The raw sequencing data were processed on a secure computing platform; the TSD (Tjeneste for Sensitive Data) facilities owned by the University of Oslo, operated and developed by the TSD-service group. Further data processing was performed using R version 3.2 with the Bioconductor version 3.4 and the Tidyverse version 1.2.1 collection of packages. Estimated gene counts were loaded into R using Tximport. Gene differential expression analysis and log fold-change estimation (Fig. 1f–g and Extended Data Fig. 7c) were computed using DESeq2 (ref.35) with a design formula controlling for sample donor. A full list of the differentially expressed genes is listed with adjusted P values in Supplementary Table 5. Here, we used a significance threshold of 5 × 10⁻³ after adjusting for multiple testing. Heat maps, to visualize the log2 fold change, were generated using ggplot2, as with fold-change expression in the mass cytometry data.
Further information on methods, statistics and data analysis is provided in the Nature Research Reporting Summary.
Reporting Summary.
Further information on research design is available in the Nature Research Reporting Summary linked to this article.
Extended Data
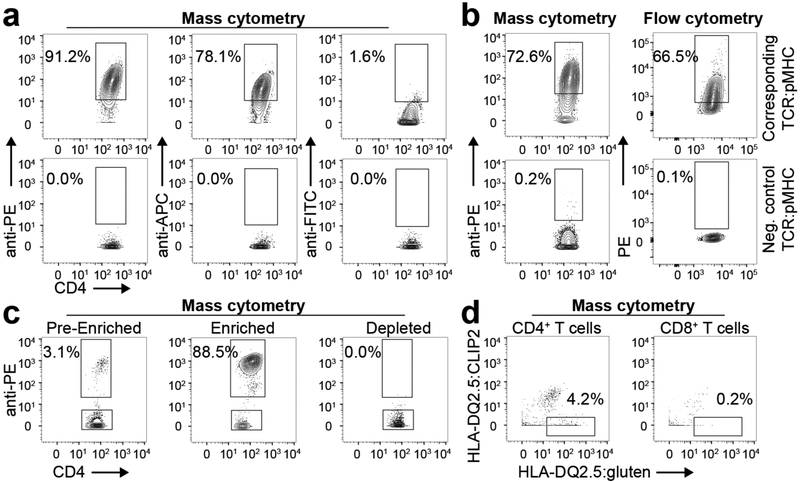
Extended Data Fig. 1 |. Establishing HLA class II tetramer staining with mass cytometry.
a, Gluten-specific T cell clone binding a corresponding or negative control HLA-DQ2.5:gluten tet reagent metal tagged with secondary binding to PE, APC or FITC (one T cell clone in one experiment), b, Comparison of tet staining in mass cytometry and flow cytometry with a gluten-specific T cell clone binding the corresponding or non-corresponding HLA-DQ2.5:gluten tet reagent (n = 8 distinct T cell clones in two mass cytometry and two flow cytometry experiments, respectively), c, Tet enrichment of a gluten-specific T cell clone binding the corresponding PE-Cy7-coupled HLA-DQ2.5:gluten tet reagent (one T cell clone in one experiment). The T cell clone was spiked into PBMCs, enriched with anti-Cy7 beads and metal tagged with anti-PE (one T cell clone in one experiment), d, Unspecific HLA-DQ2.5:gluten tet binding was excluded with APC-Cy7-coupled HLA-DQ2.5:CLIP2 and metal-tagged anti-APC (n = 7 patients with UCeD and 10 controls in 9 experiments. Here, two distinct T cell clones and three PBMC samples were analyzed in two pilot experiments before the tet staining approach was established).
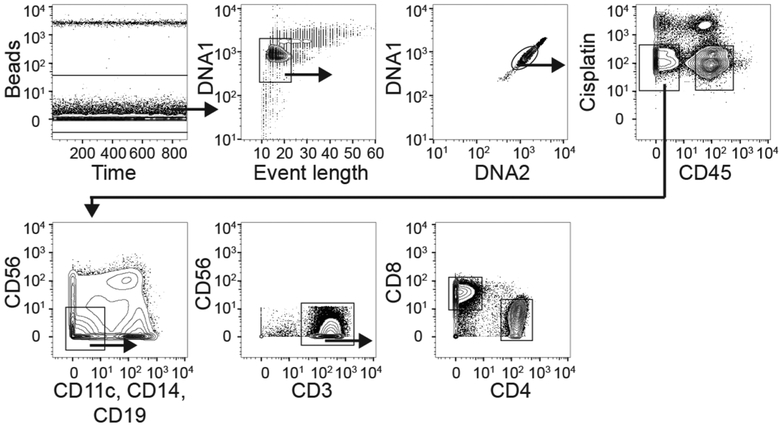
Extended Data Fig. 2 |. Gating strategy for cells analyzed with mass cytometry.
From the initial plot to the plot and gate that encounters CD4+ blood or gut T cells. Anti-CD45 coupled with 89Y or 108Pd was used for sample barcoding.
Extended Data Fig. 3 |. On the CD4+ gut T cells analyzed with mass cytometry.
a, Heat map showing the fold-change expression of indicated markers in CD4+ HLA-DQ2.5:gluten tet-negative gut T cells of six patients with UCeD versus CD4+ gut T cells of seven healthy controls (five experiments in total), b, Expression level of mass cytometry panel markers (Supplementary Table 1) in gluten tet-positive and tet-negative CD4+ gut T cells in six patients with UCeD (five experiments). The y axis indicates the ArcSinh-transformed intensity. Box plots show the median frequency, the interquartile range and the whiskers show largest and smallest values below 1.5 times the interquartile range, c, t-SNE plots separately highlighting the presence of cells expressing the markers in a and b in CD4+ gut T cells merged from 1 patient with UCeD and 1 control subject (1 of n = 6 patients with UCeD and 1 of n = 7 controls, 5 experiments). For comparison, the location of HLA-DQ2.5:gluten tet-binding CD4+ gut T cells of the same patient is visualized in the upper left plot.
Extended Data Fig. 4 |. Mass cytometry and RNA-seq data correlation.
a,b, Correlation between RNA-seq-derived and mass cytometry-derived fold-change expression of HLA-DQ2.5:gluten tet-positive versus HLA-DQ2.5:gluten tet-negative CD4+ gut T cells in patients with UCeD (a) and versus CD4+ gut T cells in controls (corresponding data depicted as a heat map in Fig. 1e,f) (b). For RNA-seq data: n = 5 patients with UCeD, 4 control subjects in 2 experiments. For mass cytometry data: n = 6 patients with UCeD, 7 controls in 5 experiments. The shaded region indicates the 95% confidence interval around the regression line.
Extended Data Fig. 5 |. On the CD4+ blood T cells analyzed with mass cytometry.
a, Heat map showing the log2 fold-change expression of indicated markers in CD4+ blood T cells of seven patients with UCeD (pre-tet-enriched sample) versus ten healthy controls in nine experiments, b, Expression level of mass cytometry panel markers (Supplementary Table 1) in gluten tet-positive and pre-tet-enriched CD4+ blood T cells in seven patients with UCeD (six experiments). The y axis indicates the ArcSinh-transformed intensity values. The box plots show the median frequency, the interquartile range and the whiskers show the largest and smallest values below 1.5 times the interquartile range, c, t-SNE plots separately highlighting the presence of cells expressing the markers in a and b in CD4+ blood T cells merged from 1 healthy control and 1 patient with UCeD (1 of n = 7 patients with UCeD and 1 of n = 10 controls in 9 experiments). For comparison, the location of HLA-DQ2.5:gluten tet-binding CD4+ blood T cells of the same patient with UCeD is visualized in the upper left plot.
Extended Data Fig. 6 |. Flow cytometry staining confirms CXCR5/IC0S expression.
General gating strategy for flow cytometry analysis of tet-binding cells, including the expression of CXCR5 and ICOS in tet-positive and tet-negative (+/−) CD4+ blood T cells in one patient with UCeD (in one experiment).
Extended Data Fig. 7 |. Expression of regulatory T cell-associated markers on gluten-specific CD4+ T cells in vitro and ex vivo.
a, CD4+ blood T cells of a patient with UCeD were HLA-DQ2.5:gluten tet-sorted ex vivo and cultured in vitro with phytohemmagglutinin and irradiated PBMCs for 2 weeks before re-staining with HLA-DQ2.5:gluten tets to analyze for the expression of Foxp3 and CD25 (n = 2,1 experiment), b, The same experiment as in a, only with tet-sorted CD4+ gut T cells from the patient in a (n = 1,1 experiment), c, RNA-seq-derived log2 fold-change expression of glycoprotein A repetitions predominant (GARP) in tet+ (<2 GARP transcripts per million) versus tet− CD4+ gut T cells of five patients with UCeD and in tet+ of five patients with UCeD versus CD4+ gut T cells of four control subjects. GARP was differentially expressed in tet+ versus tet− cells, but not when compared to CD4+ gut T cells in controls (indicated by asterisks) (differentially expressed genes in Supplementary Table 5). d,e, Ex vivo flow cytometry staining of tet+/− CD4+ gut T cells from a patient with UCeD with anti-CD127, anti-CD25 and anti-Foxp3 (d) and summarized CD25/Foxp3 staining in gut biopsies of five patients with HLA-DQ2.5+ UCeD and one patient with UCeD HLA-DQ8+ (five experiments) (e). The median frequency and interquartile range are indicated. f,g, Tet+/− CD4+ blood T cells from a patient with UCeD with anti-CD127, anti-CD25 and anti-Foxp3 (f) and summarized CD25/FoxP3 staining in blood of five patients with UCeD and four gluten-challenged patients with UCeD (four experiments) (g). The median frequency and interquartile range are indicated. Samples in a and b were stained with a different anti-CD25 antibody than samples in d, e, f, and g.
Extended Data Fig. 8 |. Different pattern of activated CD4+ T cells in patients with autoimmune diseases versus influenza infection.
a, In Fig. 2h, t-SNE visualization and unsupervised clustering of activated (CD38+) memory (CD45RA−) CD4+ blood T cells in indicated participant groups and gluten tet-positive (tet+) cells of patients with UCeD are shown. One cluster containing 75% of tet+ cells (cluster 1) from seven patients with UCeD and one cluster dramatically upregulated in subjects with influenza infection (cluster 2) are color coded in Fig. 2h. The prevalence of activated CD4+ memory T cells belonging to cluster 1 and cluster 2, respectively, for each indicated participant group is shown. Here, we randomly selected n = 5 distinct samples per participant group, except for the gluten challenge group for which we only had n = 4 distinct samples with sufficient cells. The median frequency and the interquartile range are shown, as well as the whiskers, showing the largest and smallest values below 1.5 times the interquartile range. The single data points depict outliers. b,c, Heat map of the indicated proteins in cluster 1 and cluster 2 with absolute expression (staining intensity) (b) and versus CD4+ blood T cells depicted as the log2 fold change of the grand mean of donor marker intensity (c).
Extended Data Fig. 9 |. Supervised clustering model predicting the gluten-specific T cell profile.
a, Diagram illustrating the workflow for model training and prediction. PBMC samples from donors with UCeD are split into two parts as indicated. One part (right) is not tet enriched and is later used for estimation of gluten-specific T cell profile cell prevalence within the sample. The tet-enriched part (left) is used to train a random forest classification model using repeated K-fold cross-validation on the phenotype of the tet-positive cells, b, Scatter plot of the mean decrease in the Gini score for each predictor provides information on how important the predictor variables are to the final model.
Extended Data Fig. 10 |. Cells with profile of gluten-specific CD4+ T cells in celiac, autoimmune and viral disease identified with manual gating.
a, Manual gating strategy with markers giving a well-defined shift in staining intensity that define gluten-specific T cells, encompassing 41% and 48% of HLA-DQ2.5:gluten tet-binding CD4+ T cells in the gut and CD4+ effector memory T cells in the blood, respectively, in patients with UCeD (although the gluten-specific cells were phenotypically similar, not all of the cells had a staining intensity for all ten markers above or below the manually set threshold, as also visualized in Figs. 1c and 2c). Here, visualized in the peripheral blood of a patient with UCeD. b–d, Frequency of cells gated as in a in the gut (b) and in the blood (c) (pre-tet-enriched sample) of patients with UCeD, TCeD (gluten-free diet) and healthy controls, and in patients with TCeD before and following gluten challenge (differing from gating encountering gluten-specific cells in patients with UCeD chiefly by lower CD39 expression, as also visualized in Fig. 2f) (d). Blood and gut samples analyzed in 12 and six experiments, respectively. Gluten challenge samples were analyzed in two experiments. e,f, Frequency of cells gated as in a within patients with the indicated autoimmune disorders and different set as in b of control subjects (seven experiments in total) (e), and within a cohort during and after influenza infection (f) (three experiments in total). Statistics: an unpaired, two-tailed t-test was used and the median frequency and interquartile range are indicated in b, c and e. *A paired, two-tailed t-test was used and the lines indicate paired samples in d and f.
Supplementary Material
Acknowledgements
We thank the patients participating in this study, S. Furholm, C. Hinrichs and M. H. Bakke for collecting patient material at the Endoscopy Unit (Oslo University Hospital—Rikshospitalet), the Stanford-LPCH Vaccine Program with S. Swope and S. Mackey for the study of patients with influenza virus infection, A. Nau (Davis group), M. Leipold (The Human Immune Monitoring Center, Stanford University) and Brith Bergum (Flow Cytometry Core Facility, University of Bergen) for technical assistance with the Helios mass cytometers, B. Simonsen and S. R. Lund (Sollid group) for producing the biotinylated HLA-DQ2.5:gluten molecules, M. K. Johannesen (Sollid group) for laboratory technical assistance, K. J. Rolfsen (University of Oslo) for producing the cookies for gluten challenge, G. K. Sandve (University of Oslo) for critical inputs on RNA-seq data analysis in addition to V. K. Sarna (University of Oslo) and L. Chung (Stanford Medicine) for help with the clinical assessment of patients. We also thank the Flow Cytometry Core Facility (Oslo University Hospital—Rikshospitalet and Radiumhospitalet) and the Stanford Shared FACS Facility for technical assistance. We express our gratitude to the funding bodies of this research: The University of Oslo Scientia Fellows program, co-funded by the University of Oslo World-leading research program on human immunology (WL-IMMUNOLOGY) (L.M.S.) and by the EC FP7 Maria Sklodowska-Curie COFUND Programme (GA 609020) (A.C. and L.M.S.); Stiftelsen KG Jebsen (project SKGJ-MED-017) (L.M.S. and K.E.A.L.); The Unger-Vetlesen Medical Fund (A.C.); The U.S.-Norwegian Fulbright Foundation for educational exchange (A.C.); Fondsstiftelsen (Oslo University Hospital) (A.C.); The Howard Hughes Medical Institute (M.M.D.); The Simons Foundation (M.M.D.); The National Institutes of Health; U19-AI057229 (M.M.D.), U19-AI110491 (P.J.U.), ULI TR001085 (C.L.D.) and ROI AI125197–01 (P.J.U.); The Donald E. and Delia B. Baxter Foundation (P.J.U.); The Henry Gustav Floren Trust (P.J.U.); and a gift from Elizabeth F. Adler (P.J.U.).
Footnotes
Data and code availability
The raw sequences of the RNA-seq data are deposited at the EGA European Genome Phenome Archive (https://ega-archive.org/studies/EGAS00001003017). The source code is available on https://github.com/eivindgl/natmed_gluten_tcell_mass_cytometry. All other data supporting the findings of this study are available from the corresponding authors on request.
Online content
Any methods, additional references, Nature Research reporting summaries, source data, statements of data availability and associated accession codes are available at https://doi.org/10.1038/s41591-019-0403-9.
Additional information
Extended data is available for this paper at https://doi.org/10.1038/s41591-019-0403-9.
Supplementary information is available for this paper at https://doi.org/10.1038/s41591-019-0403-9.
Publisher’s note: Springer Nature remains neutral with regard to jurisdictional claims in published maps and institutional affiliations.
Competing interests
The authors declare no competing interests.
References
- 1.Abadie V et al. Annu. Rev. Immunol 29, 493–525 (2011). [DOI] [PubMed] [Google Scholar]
- 2.Rao DA et al. Nature 542, 110–114 (2017). [DOI] [PMC free article] [PubMed] [Google Scholar]
- 3.Sollid LM et al. Gut 41, 851–852 (1997). [DOI] [PMC free article] [PubMed] [Google Scholar]
- 4.Di Niro R et al. Nat. Med 18, 44–445 (2012). [Google Scholar]
- 5.Steinsbo O et al. Nat. Commun 5, 4041 (2014). [DOI] [PMC free article] [PubMed] [Google Scholar]
- 6.Hoydahl LS, et al. Gastroenterology https://doi.Org/10.1053/j.gastro.2018.12.013 (2018).
- 7.Moens L et al. Front. Immunol 5, 65 (2014). [DOI] [PMC free article] [PubMed] [Google Scholar]
- 8.Kooy-Winkelaar YM et al. Proc. Natl Acad. Sei. USA 114, E980–E989 (2017). [DOI] [PMC free article] [PubMed] [Google Scholar]
- 9.Christophersen A et al. United European Gastroenterol. J 2, 268–278 (2014). [DOI] [PMC free article] [PubMed] [Google Scholar]
- 10.Raki M et al. Proc. Natl Acad. Sei. USA 104, 2831–2836 (2007). [DOI] [PMC free article] [PubMed] [Google Scholar]
- 11.Du Pre MF et al. Am. J. Gastroenterol 106, 1147–1159 (2011). [DOI] [PMC free article] [PubMed] [Google Scholar]
- 12.Cook L et al. J. Allergy Clin. Immunol 140, 1592–1603 (2017). [DOI] [PubMed] [Google Scholar]
- 13.Risnes LF et al. J. Clin. Invest 128, 2642–2650 (2018). [DOI] [PMC free article] [PubMed] [Google Scholar]
- 14.Yu W et al. Immunity 42, 929–941 (2015). [DOI] [PMC free article] [PubMed] [Google Scholar]
- 15.Su LF et al. Immunity 38, 373–383 (2013). [DOI] [PMC free article] [PubMed] [Google Scholar]
- 16.Ludvigsson JF et al. Gut 63, 1210–1228 (2014). [DOI] [PMC free article] [PubMed] [Google Scholar]
- 17.Marsh MN et al. Baillieres Clin. Gastroenterol 9, 273–293 (1995). [DOI] [PubMed] [Google Scholar]
- 18.Oberhuber G et al. Eur. J. Gastroenterol. Hepatol 11, 1185–1194 (1999). [DOI] [PubMed] [Google Scholar]
- 19.Anderson RP et al. Nat. Med 6, 337–342 (2000). [DOI] [PubMed] [Google Scholar]
- 20.van den Hoogen F et al. Ann. Rheum. Dis 72, 1747–1755 (2013). [DOI] [PubMed] [Google Scholar]
- 21.Hochberg MC Arthritis Rheum. 40, 1725 (1997). [DOI] [PubMed] [Google Scholar]
- 22.Newell EW et al. Immunity 36, 142–152 (2012). [DOI] [PMC free article] [PubMed] [Google Scholar]
- 23.Newell EW et al. Nat. Biotechnol 31, 623–629 (2013). [DOI] [PMC free article] [PubMed] [Google Scholar]
- 24.Mei HE et al. J. Immunol 194, 2022–2031 (2015). [DOI] [PMC free article] [PubMed] [Google Scholar]
- 25.Shan L et al. Science 297, 2275–2279 (2002). [DOI] [PubMed] [Google Scholar]
- 26.Quarsten H et al. J. Immunol 167, 4861–4868 (2001). [DOI] [PubMed] [Google Scholar]
- 27.Christophersen A et al. J. Immunol 196, 2819–2826 (2016). [DOI] [PubMed] [Google Scholar]
- 28.Sollid LM et al. Immunogenetics 64, 455–460 (2012). [DOI] [PMC free article] [PubMed] [Google Scholar]
- 29.Molberg Ø et al. Methods Mol. Med 41, 105–124 (2000). [DOI] [PubMed] [Google Scholar]
- 30.Bodd M et al. Eur. J. Immunol 43, 2605–2612 (2013). [DOI] [PubMed] [Google Scholar]
- 31.van der Maaten L et al. J. Mach. Learn. Res 9, 2579–2605 (2008). [Google Scholar]
- 32.Nowicka M et al. F1000Res. 6, 748 (2017). [DOI] [PMC free article] [PubMed] [Google Scholar]
- 33.Andy L et al. R News 2, 18–22 (2002). [Google Scholar]
- 34.Patro R et al. Nat. Methods 14, 417–419 (2017). [DOI] [PMC free article] [PubMed] [Google Scholar]
- 35.Love MI et al. Genome Biol. 15, 550 (2014). [DOI] [PMC free article] [PubMed] [Google Scholar]
Associated Data
This section collects any data citations, data availability statements, or supplementary materials included in this article.


