Abstract
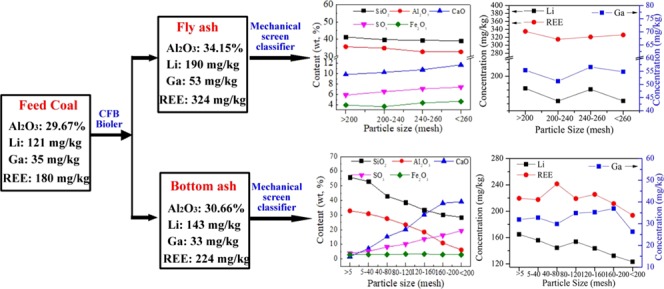
Feed coal, fly ash (FA), and bottom ash (BA) were collected from a 300 MW circulating fluidized bed boiler. A mechanical screen classifier was used to separate and obtain particles with different sizes. The distribution of valuable elements, including aluminum (Al), lithium (Li), and gallium (Ga), and rare earth elements (REE) in the samples was investigated. Results indicate that the contents of SiO2 and Al2O3 in sized ash particles decreased as the particle size decreased; meanwhile, the contents of CaO, SO3, and Fe2O3 apparently increased. The sulfur-fixing product anhydrite tended to be distributed in the fine ash particles. The valuable elements were more enriched in FA than in BA. The Li, Ga, and REE were evenly distributed in FA particles with different sizes. Separating ash particles with a superhigh concentration of these rare elements was difficult using the mechanical screen, but a part of the anhydrite or CaO in circulating fluidized bed ash could be removed easily. The Li and REE in the feed coal were highly associated with quartz, kaolinite, and other fractions containing SiO2 and Al2O3. No definitive relationship between the Ga concentration and Al2O3 content in the feed coal and ash samples was observed.
1. Introduction
Coal is the primary fossil energy resource in China, and the yield of coal production in the country reached 3.41 Gt in 2016.1 Coal gangue and coal sludge produced from coal mining and washing processes are regarded as industrial solid wastes, and their average production is approximately 15–25% of the raw coal production in China.2,3 Circulating fluidized bed (CFB) combustion technology has great fuel flexibility, and CFB boilers can burn the worst grade of available fuels.4 Electric power generation via coal gangue combustion in a CFB boiler is a potential method for heavily consuming these wastes. In recent years, the amount of CFB boilers has been increasing in China, especially in the Shanxi Province. Combustion in these CFB boilers generates large amounts of fly ash (FA) and bottom ash (BA) solid wastes, which are presently underutilized. With low economic benefits, CFB FA and BA have been mainly used in the building material industry as fillers in brick manufacturing and additives in cement and concrete.5 Large amounts of CFB ash could not be consumed and are still dumped into ponds or piled on land. The irregular accumulation and inappropriate disposal of ashes endanger human health and the environment.
Many coalfields with high content of valuable elements, such as aluminum (Al), lithium (Li), gallium (Ga), and rare earth elements (REE) have been discovered in Northwest China, especially in Inner Mongolia and Shanxi Province.6,7 Compared with common Chinese and worldwide coals, the coals from Jungar, Inner Mongolia are more highly enriched with Al, Li, Ga, and REE.8,9 Sun et al.10 found that the Li, Ga, and Al contents of the coals from the Pingshuo Mining District, Ningwu Coalfield, Shanxi Province in China have reached an economically valuable level. In addition, the contents of these valuable elements in coal gangue from these districts are evidently higher than those in coal because these valuable elements are mainly found in the inorganic matter of coals.11 Most of these inorganic valuable elements in coal gangue or coal are moved to FA and BA during combustion in the CFB boilers.12,13 The recycling of these valuable metals from coal ash not only conserves natural resources and reduces environmental impacts but also utilizes ash with high economic benefit.14 Generally, the selection of recovery technology and recovery cost is considerably influenced by the concentration of valuable elements in coal ash. Understanding the distribution of valuable elements in FA and BA is essential for the improvement of recovery technology. Furthermore, coal ash is a complex mixture and is assumed to be composed of various particles. The particle size and distribution of elements are uneven due to the different formation conditions of coal ash. Ke et al.15 corroborated that the larger CFB ash particles were composed of some hard materials such as quartz, mullite, and glass particles with different sizes have different chemical composition and mineral matter. Li et al.16 investigated the distribution characteristics of heavy metals in different sizes of FA from a sewage sludge circulating fluidized bed incinerator and corroborated that the heavy metal contents of small-sized FA were higher than those of large-sized FA. Raclavská et al.17 studied the enrichment and distribution of 24 elements within the subsieve particle size distribution ranges of FA from waste incinerator plants and affirmed that a great enrichment of the majority of elements was observed for a particle size range of <100 μm and was attributed to the vaporization and condensation mechanisms. López-Antón et al.18 investigated the behavior of thallium in a 50 MW industrial circulating fluidized bed combustion plant and the distribution of thallium among BA and FA. They contended that thallium is relatively homogeneously distributed in all of the ash samples regardless of their composition but is slightly related to surface area, which in turn is dependent on particle size and unburned carbon content. Most studies on element distribution in coal ash are focused on deleterious elements.19−22 However, the distribution characteristics of valuable elements, including Al, Li, Ga, and REE, in different sizes of FA and BA from industrial CFB boilers are unclear to date. In addition, extracting the rare elements from coal ash is difficult due to the relatively low concentration of rare elements in coal ash. The difficulty in extraction will be reduced, and the economics of valuable element extraction will be enhanced if certain size fractions are more enriched in these valuable elements. Furthermore, whether the simplest mechanical screening can be used to increase the concentration of rare elements in coal ash with specific particle size is still unclear.
In this work, the mineral matter, chemical composition, and rare element (Li, Ga, and REE) content in feed coal, FA, and BA from a 300 MW circulating fluidized bed in a coal gangue power plant are investigated. A mechanical screen classifier is used to separate particles in different sizes of FA and BA. The distribution characteristics of mineral matter, oxides, and rare elements in the sized particles are investigated systematically. This study mainly aims to clarify the distribution and enrichment of valuable elements in the differently sized feed coal, FA, and BA from the industrial CFB boiler.
2. Results and Discussion
2.1. Characteristics of Feed Coal
2.1.1. Particle Size Distribution
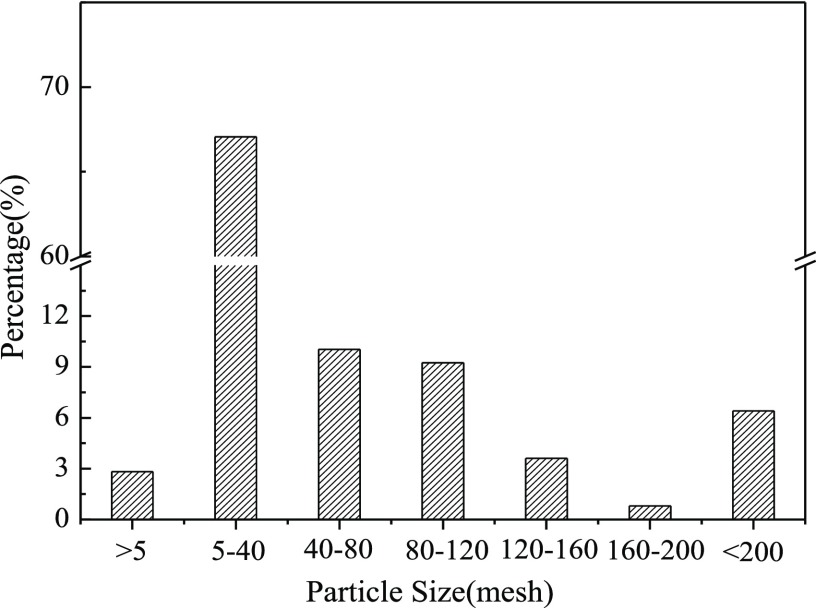
Figure 1 depicts the particle size distribution of feed coal. The percentage of 5–40 mesh coal particles is the highest (reaches up to 67%), and the percentage of other particle sizes is less than 10%. Compared with the particle size of feed coal in a pulverized coal furnace, the size of feed coal in the CFB furnace is relatively bigger (0.4–3 mm).
Figure 1.
Particle size distribution of feed coal.
2.1.2. Proximate Analysis
Table 1 exhibits the proximate analysis of sized feed coal samples. The ash contents of coal particles with different sizes vary. As the particle size decreases, the ash content in coal particles gradually decreases, indicating that more inorganic matter exists in coarse coal particles. In contrast, the content of fixed carbon in coal particles increases with the decrease in particle size.
Table 1. Proximate Analysis of Feed Coal Samples with Different Sizesa.
| proximate
analysis (wt %, d) |
||||
|---|---|---|---|---|
| particle size (mesh) | M | A | V | FC |
| >5 | 1.45 | 74.28 | 14.26 | 10.01 |
| 5–40 | 1.52 | 73.45 | 15.11 | 9.92 |
| 40–80 | 1.61 | 72.19 | 15.27 | 10.93 |
| 80–120 | 1.70 | 70.56 | 15.68 | 12.06 |
| 120–160 | 1.73 | 68.37 | 16.21 | 13.69 |
| 160–200 | 1.67 | 65.26 | 15.51 | 17.56 |
| <200 | 1.58 | 62.79 | 15.99 | 19.64 |
M, moisture; A, ash; V, volatile matter; FC, fixed carbon.
2.1.3. Mineral Matter
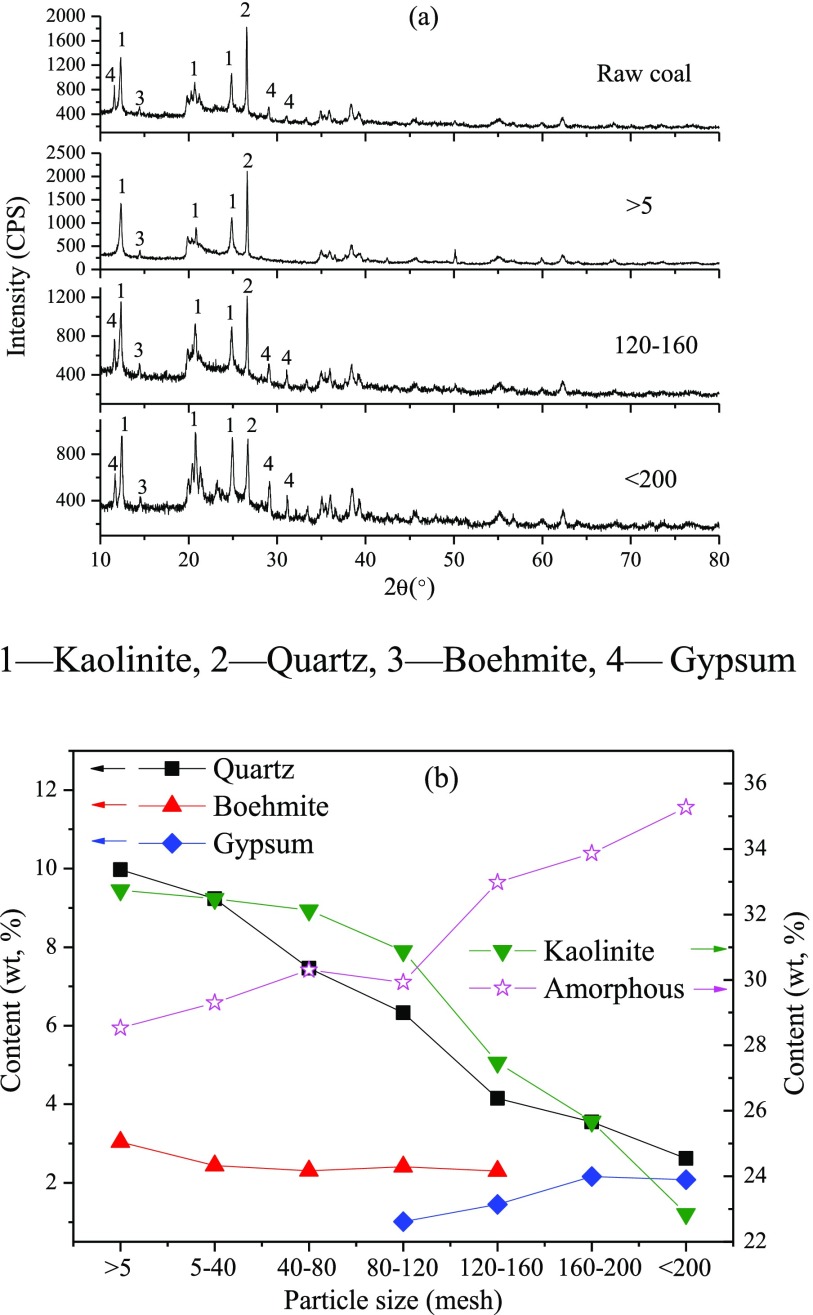
Figure 2 illustrates the mineral matter and their contents in coal samples with different particle sizes. The X-ray diffraction (XRD) patterns of coal particles with sizes of 5–40, 40–80, 80–120, and 160–200 mesh are not given because they are similar to the patterns illustrated in Figure 2. The major minerals in feed coal are kaolinite (2SiO2·Al2O3·2H2O) and quartz (SiO2). The feed coal also contains a small amount of boehmite (AlOOH) and gypsum (CaSO4·2H2O). The mineral matter content in coal varies with the size of coal particle. The content of kaolinite in coal particles bigger than 80 mesh decreases slightly as the particle size decreases and then decreases dramatically when the coal particle size is smaller than 120 mesh. The content of quartz in coal particles decreases with the decrease in particle size. The boehmite is mainly distributed in the coarse coal particles (>160 mesh), whereas the gypsum is mainly distributed in the fine coal particles (<80 mesh). In addition to crystalline minerals, coal also contains noncrystallized inorganic matter, which is usually referred to as amorphous matter.23 The main chemical composition of amorphous matter in coal should be SiO2 and Al2O3 based on the chemical composition of inorganic matter and mineral content in coal. The content of amorphous matter in coal particles increases gradually with the decrease in particle size.
Figure 2.
Mineral matter (a) and their contents (b) in feed coal particles with different sizes.
2.1.4. Chemical Composition
Table 2 presents the major chemical composition and rare element content in raw feed coal and sized coal particles. The distribution of mineral matter in coal particles with different sizes causes the chemical composition variation of coal particles. Overall, the contents of SiO2 and Al2O3 decrease gradually as the coal particle size decreases, whereas the contents of Fe2O3, CaO, and SO3 show an increasing trend with the decrease in coal particle size. The decrease of kaolinite and quartz with a decrease in feed coal particle size results in the decrease in SiO2 and Al2O3 contents in the fine coal particles. The variation of CaO and SO3 content in the coal particles with different sizes is caused by the distribution of gypsum in feed coal particles. The concentration variation trend of Li and REE with coal particle size is consistent with that of SiO2 and Al2O3. Unlike Li and REE, Ga is evenly distributed in coal particles.
Table 2. Chemical Composition of Inorganic Matter in Feed Coal Particles with Different Sizes.
| |
feed
coal particles with different sizes |
||||||||
|---|---|---|---|---|---|---|---|---|---|
| chemical composition | raw | >5 | 5–40 | 40–80 | 80–120 | 120–160 | 160–200 | <200 | |
| major composition (wt %, coal basis) | SiO2 | 34.23 | 37.26 | 35.19 | 32.49 | 30.55 | 28.67 | 27.28 | 26.14 |
| Al2O3 | 29.67 | 31.18 | 29.34 | 27.52 | 26.01 | 24.37 | 23.21 | 21.46 | |
| Fe2O3 | 2.36 | 1.27 | 1.98 | 3.04 | 3.48 | 3.58 | 3.69 | 3.94 | |
| CaO | 1.98 | 0.41 | 1.32 | 2.15 | 2.67 | 3.02 | 3.22 | 3.75 | |
| SO3 | 2.49 | 0.38 | 1.67 | 2.44 | 2.83 | 3.17 | 4.38 | 5.21 | |
| rare elements (mg/kg, coal basis) | Li | 121 | 134 | 108 | 85 | 77 | 63 | 49 | 37 |
| Ga | 35 | 35 | 33 | 37 | 32 | 37 | 29 | 32 | |
| REE | 180 | 211 | 185 | 170 | 153 | 135 | 141 | 114 | |
| La | 3.10 | 4.75 | 4.57 | 3.44 | 3.89 | 3.01 | 3.91 | 2.56 | |
| Ce | 21.58 | 21.58 | 17.15 | 14.44 | 11.36 | 13.16 | 11.16 | 8.60 | |
| Pr | 15.58 | 21.97 | 18.76 | 14.29 | 11.02 | 11.58 | 10.15 | 7.41 | |
| Nd | 54.43 | 62.81 | 54.47 | 55.14 | 45.62 | 40.82 | 49.64 | 36.72 | |
| Sm | 5.64 | 7.48 | 5.95 | 4.39 | 4.66 | 5.59 | 4.76 | 4.77 | |
| Eu | 1.31 | 1.55 | 1.43 | 1.35 | 1.17 | 0.75 | 1.14 | 0.22 | |
| Gd | 5.21 | 6.87 | 5.45 | 5.08 | 5.29 | 5.76 | 6.87 | 5.30 | |
| Tb | 3.94 | 7.32 | 5.75 | 4.23 | 2.05 | 1.64 | 1.44 | 0.71 | |
| Dy | 5.40 | 5.56 | 5.20 | 4.85 | 4.69 | 3.46 | 4.72 | 2.27 | |
| Ho | 0.56 | 0.96 | 0.65 | 0.35 | 0.69 | 0.13 | 0.38 | 0.05 | |
| Er | 27.43 | 28.32 | 27.31 | 26.36 | 22.84 | 17.31 | 16.32 | 14.84 | |
| Tm | 2.94 | 4.28 | 3.06 | 2.68 | 2.93 | 2.30 | 3.67 | 1.51 | |
| Yb | 2.74 | 2.47 | 2.25 | 2.18 | 1.98 | 1.53 | 1.62 | 1.33 | |
| Lu | 5.26 | 5.42 | 6.16 | 5.49 | 6.19 | 4.81 | 3.81 | 3.86 | |
| Y | 25.00 | 29.98 | 27.10 | 26.16 | 28.56 | 23.22 | 21.72 | 23.78 | |
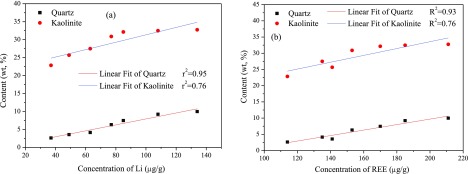
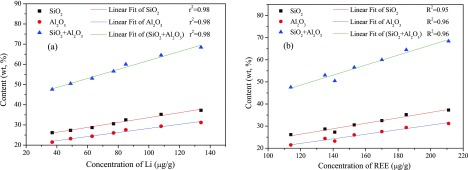
Figure 3 shows the concentration of Li and REE as a function of the contents of quartz and kaolinite. The Li and REE concentrations in feed coal particles are highly correlated with the content of quartz. A clear relationship is found between the concentration of Li/REE and the content of kaolinite, although r2 is lower than that of quartz. Figure 4 shows that the Li and REE concentrations in feed coal particles are highly correlated with the contents of SiO2 and Al2O3 and their sum. These results confirm that the occurrence of Li and REE in coals is related to minerals and amorphous fractions. Karayigit et al.24 found that Li is closely related to the aluminosilicates in coal. Lewińska-Preis et al.25 proved that Li in the Kaffioyra coal was bound to minerals and that 72% of Li was associated with organic matter in Longyearbyen coal. Sun et al.26 claimed that the content of Li was much higher in inorganic matter than that in organic matter. This result implies that the occurrence of Li in coal deeply depends on the type, origin, and characteristics of coal. Coal gangue containing abundant kaolinite accounts for approximately 60% of the feed coal. Hence, the Li and REE in the feed coal are associated with quartz, kaolinite, and other fractions containing SiO2 and Al2O3.
Figure 3.
Relationship between the concentration of (a) Li and (b) REE and contents of quartz and kaolinite.
Figure 4.
Relationship between the concentration of (a) Li and (b) REE and contents of SiO2, Al2O3, and their sum.
Gallium is generally related to clay minerals, boehmite or other aluminum-containing fractions, and probably as substitute for Al in the framework structure of minerals.8 In addition, Ga may occur in organic matter in some coals.27 However, no definitive relationship between the concentration of Ga and the contents of kaolinite, boehmite, organic matter, and Al2O3 in the feed coal is observed in this work.
2.2. Comparison of Chemical Composition between FA and BA
Table 3 shows the chemical composition of FA and BA.
Table 3. Chemical Composition of FA and BA.
| |
FA samples |
BA
samples |
|||||||||
|---|---|---|---|---|---|---|---|---|---|---|---|
| chemical composition | FA1 | FA2 | FA3 | FA4 | average | BA1 | BA2 | BA3 | BA4 | average | |
| major composition (wt %, ash basis) | SiO2 | 39.27 | 38.21 | 39.64 | 40.03 | 39.29 | 44.97 | 44.17 | 44.41 | 45.49 | 44.76 |
| Al2O3 | 33.46 | 34.95 | 33.98 | 34.21 | 34.15 | 30.49 | 30.22 | 31.25 | 30.67 | 30.66 | |
| CaO | 10.07 | 9.20 | 9.65 | 9.44 | 9.59 | 10.62 | 11.02 | 10.69 | 10.14 | 10.62 | |
| Fe2O3 | 4.48 | 3.96 | 4.01 | 4.20 | 4.16 | 3.29 | 2.62 | 2.42 | 2.40 | 2.68 | |
| SO3 | 5.65 | 6.17 | 5.81 | 6.17 | 5.95 | 5.23 | 5.17 | 4.55 | 5.37 | 5.08 | |
| MgO | 1.93 | 2.32 | 2.05 | 2.33 | 2.16 | 0.70 | 0.89 | 0.87 | 0.76 | 0.81 | |
| LOI | 2.51 | 2.65 | 2.81 | 2.25 | 2.55 | 3.36 | 3.48 | 3.50 | 3.82 | 3.54 | |
| rare elements (mg/kg, ash basis) | Li | 204 | 180 | 183 | 192 | 190 | 146 | 144 | 139 | 141 | 143 |
| Ga | 54 | 53 | 51 | 55 | 53 | 34 | 32 | 31 | 35 | 33 | |
| REE | 331 | 332 | 314 | 318 | 324 | 211 | 226 | 233 | 224 | 224 | |
| La | 9.37 | 8.45 | 7.74 | 9.22 | 8.69 | 5.62 | 6.04 | 6.67 | 4.99 | 5.83 | |
| Ce | 29.88 | 31.80 | 31.47 | 32.29 | 31.36 | 19.75 | 23.64 | 22.85 | 21.18 | 21.86 | |
| Pr | 26.06 | 25.07 | 22.42 | 23.32 | 24.22 | 12.41 | 13.07 | 11.08 | 15.46 | 13.01 | |
| Nd | 172 | 173 | 167 | 173 | 171 | 111 | 121 | 124 | 122 | 120 | |
| Sm | 7.64 | 7.61 | 7.56 | 7.76 | 7.64 | 5.06 | 5.03 | 4.94 | 4.99 | 5.00 | |
| Eu | 5.51 | 5.98 | 5.01 | 6.19 | 5.67 | 3.41 | 2.80 | 2.32 | 2.31 | 2.71 | |
| Gd | 2.95 | 3.47 | 3.30 | 2.18 | 2.98 | 2.47 | 2.14 | 3.31 | 1.68 | 2.40 | |
| Tb | 6.02 | 5.30 | 5.54 | 5.16 | 5.51 | 3.34 | 2.99 | 3.52 | 2.95 | 3.20 | |
| Dy | 4.03 | 3.90 | 3.65 | 2.52 | 3.53 | 2.39 | 2.19 | 3.21 | 2.08 | 2.47 | |
| Ho | 0.76 | 0.70 | 0.62 | 0.46 | 0.63 | 0.38 | 0.37 | 0.49 | 0.38 | 0.41 | |
| Er | 23.69 | 23.26 | 20.30 | 17.46 | 21.18 | 11.51 | 11.69 | 16.03 | 13.05 | 13.07 | |
| Tm | 3.63 | 3.63 | 3.20 | 2.41 | 2.34 | 1.50 | 1.90 | 2.15 | 2.32 | 1.97 | |
| Yb | 2.37 | 2.47 | 2.11 | 2.41 | 2.34 | 1.27 | 1.14 | 1.43 | 1.31 | 1.29 | |
| Lu | 3.30 | 3.60 | 2.73 | 2.49 | 3.03 | 1.52 | 1.53 | 2.06 | 2.20 | 1.83 | |
| Y | 33.74 | 33.65 | 30.87 | 31.20 | 32.36 | 28.84 | 31.02 | 28.46 | 27.22 | 28.89 | |
The loss of ignition (LOI) of BA is higher than that of FA due to the high content of unburned carbon or unreacted limestone in BA. The content of SiO2 in FA is lower than that in BA, whereas the contents of Al2O3, Fe2O3, and MgO in FA are higher than those in BA. These results indicate that the inorganic matter rich in SiO2 tends to be distributed in coarse BA particles and that the inorganic matter rich in Al2O3 is more likely to enter the fine FA particles. Table 2 affirms that the contents of CaO and SO3 are enriched in the fine particles. However, the contents of CaO and SO3 in FA are similar to those in BA caused by the addition of limestone (CaCO3), which is used for catching sulfur oxide in the flue gas in this plant. The particle size range of limestone is 0.08–2.5 mm, and the content of the 0.63–2.5 mm particle is the highest in the feed limestone.28 Compared with the FA, the feed limestone is coarser. Therefore, the sulfur-fixing product anhydrite (CaSO4) and unreacted limestone/lime enter the BA easily.29 The particle size of limestone can decrease dramatically due to the decomposition of limestone at high temperatures. A part of fine limestone and its derivative particles enter the FA, leading to similar contents of CaO and SO3 in the FA and BA.
Table 3 shows that the concentration of rare elements in the FA particle is higher than that in the BA particle, indicating that the Li, Ga, and REE are more abundant in fine FA particles during coal combustion. Elements, such as Al, Li, Ga, and REE, in ash are widely considered to be valuable elements, which can be extracted for recycling. They can also be concentrated from coal to FA during coal combustion. The content of alumina in FA is approximately 15% higher than that in coal. Compared to those in coal, the concentrations of Li, Ga, and REE in FA increase by approximately 57, 51, and 80%, respectively.
2.3. Composition of Ash Particles with Different Sizes
2.3.1. Particle Size Distribution
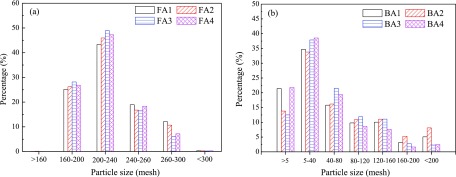
Figure 5 shows the particle size distribution of the ash samples. The weights of particles with the sizes of >160 mesh and <300 mesh are extremely low. The particle size distribution of FA is narrow, ranging from 160 to 300 mesh. Particles in the range of 200–240 mesh account for approximately half of the FA particles. Unique working conditions, including coarse feed coal and the relatively low combustion temperature, cause the FA collected from the CFB boiler to be distinctly coarser than the FA collected from the pulverized coal plant.30
Figure 5.
Particle size distribution of (a) FA and (b) BA.
In contrast, the particle size distribution of BA is wide, ranging from 5 to 200 mesh, and the particles with sizes between 5 and 40 mesh hold the largest proportion of BA.
2.3.2. Composition of FA Particles with Different Sizes
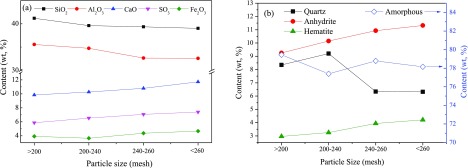
The main chemical composition and mineral content in FA particles with different sizes are determined by X-ray fluorescence (XRF) and XRD, respectively. The results of the FA1–FA4 samples are similar. Therefore, only the results of FA1 are illustrated in Figure 6 to avoid redundancy. The contents of SiO2 and Al2O3 in FA decrease slightly as the particle size decreases; meanwhile, the contents of CaO, SO3, and Fe2O3 increase. The mineral matter in FA comprises quartz, anhydrite, and hematite (Fe2O3). The amount of crystalline minerals accounts for ∼20% of FA quality and the other is the amorphous component. The kaolinite in feed coal decomposes above 600 °C and transforms into amorphous matter including metakaolin and amorphous Al and Si oxides, which would transform to mullite or other crystalline aluminosilicates above 1000 °C.31,32 However, the operation temperature of CFB boilers is 800–900 °C. The amorphous metakaolin, Al, and Si oxides cannot transform to crystalline mineral and still exist in the ash. Similar to the content variation of quartz in feed coal particles, the quartz content decreases with the decrease in FA particle size. Limestone (CaCO3) powder is used for capturing sulfur oxide in the flue gas in this plant, and it transforms into anhydrite during coal combustion. The content of anhydrite in fine FA particles is higher than that in coarse FA particles. Iron oxide in FA mainly exists in the form of hematite according to their similar contents in FA.
Figure 6.
Content variation of (a) main components and (b) minerals in FA1 with particle size.
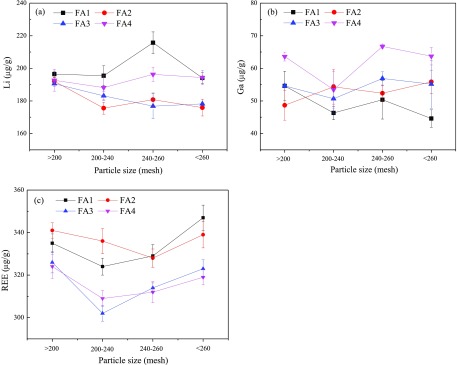
Figure 7 depicts the content variation of Li, Ga, and REE in FA with particle size. Results demonstrate that the distribution of Li, Ga, and REE in FA particles with 200–260 mesh is basically homogeneous. Previous studies20,33 have noted that the heavy metals or some trace elements were more abundant in the small-sized FA particles. However, no definitive trend in variation of Li, Ga, and REE was observed between the FA particles with different sizes. Generally, the volatile elements tend to be enriched in fine FA particles. These indicate that the Li, Ga, and REE in the coal are nonvolatile or weak-volatile elements under CFB conditions.
Figure 7.
Content variation of (a) Li, (b) Ga, and (c) REE in FA with particle size.
Figures 3 and 4 show that the Li and REE in the feed coal are associated with quartz, kaolinite, and other fractions containing SiO2 and Al2O3. However, the relationship is not observed in the FA particles. The inorganic matter, including minerals in feed coal, underwent a series of complex changes during the combustion process. The chemical structure of inorganic matter and the environment of rare elements have changed, which may lead to the scattered distribution of these rare elements in FA.
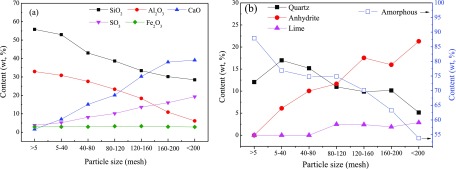
Figure 8 illustrates the content variation of the main chemical components and mineral matter in BA1 particles with different sizes. Similar to the element distribution in the FA particles, the contents of SiO2 and Al2O3 in BA decrease as the particle size decreases; meanwhile, the contents of CaO and SO3 increase. The mineral matter in BA comprises quartz, anhydrite, and lime (CaO). Limestone decomposes to form lime at high temperatures. A small amount of lime cannot react with sulfur oxide to form anhydrite and remains in the BA. Hematite is not found in BA. Figure 8b shows that the quartz tends to be distributed in coarse BA particles and anhydrite and lime tend to be distributed in fine BA particles. Minerals containing Al2O3 are not detected in FA and BA. Hence, all of the Al2O3 exist in CFB coal ash in the form of amorphous matter. The content of amorphous matter in the BA particles decreases with the decrease in particle size.
Figure 8.
Content variation of (a) main components and (b) minerals in BA1 with particle size.
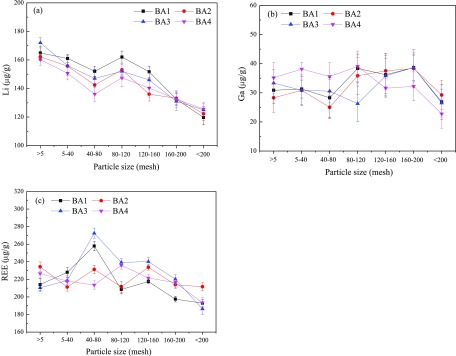
Figure 9 illustrates the variation of Li, Ga, and REE concentrations in BA with particle size. Overall, the concentration of Li in BA decreases with the decrease in particle size. Figure 9b shows that Ga is evenly distributed in the BA particles of 5–200 mesh size. Figure 9c demonstrates that the concentration of REE in the 40–80 mesh sized BA particles is slightly higher than that in other sizes of BA particles. The concentration of REE in BA particles decreases when the particle size is smaller than 160 mesh.
Figure 9.
Variation of (a) Li, (b) Ga, and (c) REE concentration in BA with particle size.
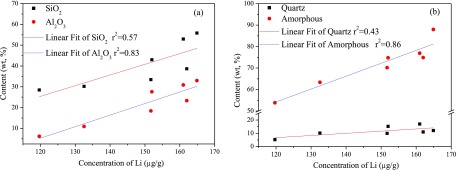
Figure 10 indicates that the Li concentration in BA is poorly correlated with the content of SiO2 and quartz compared with the relationship in feed coal. In contrast, the Li concentration in the BA is positively correlated with the contents of Al2O3 and amorphous fractions. However, no definitive relationship is observed between the concentration of Ga/REE and the contents of minerals or other oxides in the BA.
Figure 10.
Relationship between Li concentration and major chemical composition (a) and mineral contents (b).
3. Conclusions
Al is mainly found in feed coal in kaolinite and boehmite. A small amount of Al exists in the amorphous matter of feed coal. The average contents of Li, Ga, and REE are concentrated at 121, 35, and 180 mg/kg in the feed coal, respectively. The contents of Al, Li, and REE in the feed coal decrease gradually with the decrease in coal particle size. Ga is evenly distributed in sized coal particles.
These valuable elements are more enriched in FA than in BA. The average contents of Al2O3 and Li, Ga, and REE are concentrated at 34.15% and 190, 53, and 324 mg/kg in FA, respectively. The content of Al2O3 in FA is approximately 15% higher than that in coal. Compared to those in coal, the concentrations of Li, Ga, and REE in FA increase by approximately 57, 51, and 80%, respectively.
For the FA and BA, the contents of SiO2 and Al2O3 decrease as the particle size decreases; meanwhile, the contents of CaO, SO3, and Fe2O3 increase. The sulfur-fixing mineral anhydrite is enriched in the fine particles, whereas Al2O3 is enriched in the coarse particles. However, no significant variation is found in the concentrations of Li, Ga, and REE in the FA particles with different sizes. The concentration of Li in BA decreases with the decrease in particle size.
These rare elements are not enriched in a certain size particle and are evenly distributed in the sized FA particles. Enrichment of these rare elements in FA particles with a certain size using the mechanical screen is difficult, but a part of anhydrite or CaO in FA and BA can possibly be removed using this method.
The Li and REE in the feed coal are highly associated with quartz, kaolinite, and other fractions containing SiO2 and Al2O3. The Li concentration in the BA is positively correlated with the contents of Al2O3 and amorphous fractions. However, no definitive relationship between the Ga concentration and contents of minerals containing Al2O3, organic matter, and other fractions in the feed coal and ash samples is observed. A thorough understanding of the physical and chemical nature of FA and BA from an industrial CFB boiler is invaluable in the proper utilization of this important resource. Data in this study can be helpful in the development of an efficient utilization technology of CFB FA.
4. Materials and Methods
4.1. Materials and Preparation
Feed coal, FA, and BA were collected in Pingshuo Coal Gangue Power Plant in the north of Shanxi Province in China, which generates electricity using mixtures of coal gangue and weathered coal as raw materials. Feed coal (5 kg) was collected on the conveyer belt. To investigate the distribution of valuable elements in coal with different particle sizes, the feed coal was sieved using a stack of nested sieves with the following meshes: 5, 40, 80, 120, 160, and 200 (about 3080, 385, 193, 128, 96, and 77 μm, respectively). The coal particles after sieving were ground to less than 77 μm using a grinder for 20 min.
FA and BA were collected from the outlet of the precipitator and slag separator, respectively. First, the FA was collected each day at 5:00 am, 10:00 am, 17:00 pm, and 22:00 pm, respectively. These ash samples were mixed evenly to guarantee representative ash samples. The BA samples were collected using the same method. The FA and BA samples were collected at the same time. The fly ash samples collected in four days were denoted as FA1, FA2, FA3, and FA4, respectively. The BA samples collected in four days were denoted as BA1, BA2, BA3, and BA4, respectively.
The FA samples were sieved using a stack of nested sieves with the following meshes: 160, 200, 240, 260, and 300 (about 96, 77, 64, 59, and 51 μm, respectively). The BA samples were sieved using a stack of nested sieves with the following meshes: 5, 40, 80, 120, 160, and 200 (about 3080, 385, 193, 128, 96, and 77 μm, respectively). The sieving operation generally lasted 30–60 min depending on the particle size and the amount of sample loaded. The weight of particles with different sizes was recorded, and the mass fraction of these particles was calculated.
4.2. Analytical Methods
4.2.1. Proximate Analysis of Coal Sample
The proximate analysis of coal sample was conducted according to the Chinese National Standards GT/T 212-2008.
4.2.2. Measurement of Chemical Composition
The main chemical compositions of all samples were measured by X-ray fluorescence (XRF, Bruker, S8 Tiger).
To analyze the chemical composition of inorganic matters and mineral matter in coal samples accurately, the organic matter in the coal was removed by oxygen plasma oxidation in a K1050X plasma furnace (Quorum Technologies Ltd.). The acquired ash sample was referred to as low-temperature ash (denoted LTA).
The LTA, FA, and BA samples (0.1g) were digested using a mixture of 4 mL of aqua regia (VHCl/VHNO3 = 3:1) and 2 mL of n hydrofluoric acid (HF) at 180 °C for 60 min in a microwave digestion system (Anton Paar, 3000). Then, the contents of Li, Ga, and REE in digestion solution were determined by an inductively coupled plasma emission spectrometer (Thermo Scientific, ICAP6000).
4.2.3. Determination of Mineral Matter
X-ray powder diffractometer (XRD, D2, Bruker) with Cu Kα radiation was used to determine the mineral matter in specimens, which were scanned with a 2θ step size of 0.02° from 10 to 80°. The mineral matter in ash samples was quantified by TOPAS software (Version 4.2, Bruker). Zinc oxide was added into ash samples to determine the content of minerals and amorphous matter.34 The detailed method was given in other literature data.35
Acknowledgments
This work was supported by the National Natural Science Foundation of China (U1610254), the key scientific and technological project of Shanxi Province (MC2016-05) in China, and the Program for Sanjin Scholars of Shanxi Province. We are grateful to the China Scholarship Council for funding the author as a visiting scholar (201808140012) at The University of Western Australia.
Glossary
Abbreviations
- CFB
circulating fluidized bed
- LTA
low-temperature ash
- FA
fly ash
- BA
bottom ash
- XRD
X-ray diffraction
- XRF
X-ray fluorescence
The authors declare no competing financial interest.
References
- National Bureau of Statistics of the People’s Republic of China . http://www.stats.gov.cn/tjsj/zxfb/201702/t20170228_1467575.html, 2017. (accessed Feb 02, 2017).
- Zhou C. C.; Liu G. J.; Yan Z. C.; et al. Transformation behavior of mineral composition and trace elements during coal gangue combustion. Fuel 2012, 97, 644–650. 10.1016/j.fuel.2012.02.027. [DOI] [Google Scholar]
- Liu H.; Zhenling L. Recycling utilization patterns of coal mining waste in China. Resour., Conserv. Recycl. 2010, 54, 1331–1340. 10.1016/j.resconrec.2010.05.005. [DOI] [Google Scholar]
- Silva L. F. O.; Oliveira M. L. S.; Kautzmann R. M.; et al. Geochemistry and mineralogy of coal-fired circulating fluidized bed combustion fly ashes. Coal Combust. Gasif. Prod. 2014, 6, 6–28. 10.4177/CCGP-D-14-00005.1. [DOI] [Google Scholar]
- Pei Y. L.; Wei C. D.; Yang D. F.; et al. Study on characteristics and comprehensive utilization of circulating fluidized bed ash. Fly Ash Compr. Util. 2006, 5, 14–16. (in Chinese with English abstract). [Google Scholar]
- Dai S. F.; Jiang Y. F.; Ward C. R.; et al. Mineralogical and geochemical compositions of the coal in the Guanbanwusu Mine, Inner Mongolia, China: Further evidence for the existence of an Al (Ga and REY) ore deposit in the Jungar Coalfield. Int. J. Coal Geol. 2012, 98, 10–40. 10.1016/j.coal.2012.03.003. [DOI] [Google Scholar]
- Wang J.; Wang Q.; Shi J.; Li Z. Distribution and enrichment mode of Li in the No. 11 coal seam from Pingshuo mining district, Shanxi province. Energy Explor. Exploit. 2015, 33, 203–216. 10.1260/0144-5987.33.2.203. [DOI] [Google Scholar]
- Li J.; Zhuang X. G.; Yuan W.; et al. Mineral composition and geochemical characteristics of the Li-Ga-rich coals in the Buertaohai-Tianjiashipan mining district, Jungar Coalfield, Inner Mongolia. Int. J. Coal Geol. 2016, 167, 157–175. 10.1016/j.coal.2016.09.018. [DOI] [Google Scholar]
- Hu P. P.; Hou X. J.; Zhang J. B.; Li S. P.; Wu H.; Damø A. J.; Li H. Q.; Wu Q. S.; Xi X. G. Distribution and occurrence of lithium in high-alumina-coal fly ash. Int. J. Coal Geol. 2018, 189, 27–34. 10.1016/j.coal.2018.02.011. [DOI] [Google Scholar]
- Sun Y. Z.; Zhao C. L.; Zhang J. Y.; et al. Concentrations of valuable elements of the coals from the Pingshuo Mining District, Ningwu Coalfield, northern China. Energy Explor. Exploit. 2013, 31, 727–744. 10.1260/0144-5987.31.5.727. [DOI] [Google Scholar]
- Xiao L.; Zhao B.; Duan P. P.; Shi Z. X.; Ma J. L.; Lin M. Y. Geochemical characteristics of trace elements in the No.6 coal seam from the Chuancaogedan Mine, Jungar Coalfield, Inner Mongolia, China. Minerals 2016, 6, 28 10.3390/min6020028. [DOI] [Google Scholar]
- Oboirien B. O.; Thulari V.; North B. C. Major and trace elements in coal bottom ash at different oxy coal combustion conditions. Appl. Energy 2014, 129, 207–216. 10.1016/j.apenergy.2014.04.091. [DOI] [Google Scholar]
- Taggart R. K.; Hower J. C.; Dwyer G. S.; Hsu-Kim H. Trends in the rare earth element content of U. S.-based coal combustion fly ashes. Environ. Sci. Technol. 2016, 50, 5919–5926. 10.1021/acs.est.6b00085. [DOI] [PubMed] [Google Scholar]
- Xu D. H.; Li H. Q.; Bao W. J.; et al. A new process of extracting alumina from high-alumina coal fly ash in NH4HSO4 + H2SO4 mixed solution. Hydrometallurgy 2016, 165, 336–344. 10.1016/j.hydromet.2015.12.010. [DOI] [Google Scholar]
- Ke X. W.; Li D. F.; Zhang M.; Jeon C. H.; Cai R. X.; Cai J.; Liu J. F.; Yang H. R. Ash formation characteristics of two Indonesian coals and the change of ash properties such as particle size. Fuel Process. Technol. 2019, 186, 73–80. 10.1016/j.fuproc.2018.12.020. [DOI] [Google Scholar]
- Li Y. L.; Cui R. Q.; Yang T. H.; et al. Distribution characteristics of heavy metals in different size fly ash from a sewage sludge circulating fluidized bed incinerator. Energy Fuels 2017, 31, 2044–2051. 10.1021/acs.energyfuels.6b02676. [DOI] [Google Scholar]
- Raclavská H.; Corsaro A.; Hartmann-Koval S.; et al. Enrichment and distribution of 24 elements within the sub-sieve particle size distribution ranges of fly ash from wastes incinerator plants. J. Environ. Manage. 2017, 203, 1169–1177. 10.1016/j.jenvman.2017.03.073. [DOI] [PubMed] [Google Scholar]
- López-Antón M. A.; Spears D. A.; Díaz-Somoano M.; et al. Enrichment of thallium in fly ashes in a Spanish circulating fluidized-bed combustion plant. Fuel 2015, 146, 51–55. 10.1016/j.fuel.2015.01.007. [DOI] [Google Scholar]
- Oboirien B. O.; Thulari V.; North B. C. Enrichment of trace elements in bottom ash from coal oxy-combustion: Effect of coal types. Appl. Energy 2016, 177, 81–86. 10.1016/j.apenergy.2016.04.118. [DOI] [Google Scholar]
- Fu B.; Hower J. C.; Dai S. F.; Mardon S. M.; Liu G. J. Determination of chemical speciation of Arsenic and Selenium in high-As coal combustion ash by X-ray photoelectron spectroscopy: examples from a Kentucky Stocker ash. ACS Omega 2018, 3, 17637–17645. 10.1021/acsomega.8b02929. [DOI] [PMC free article] [PubMed] [Google Scholar]
- Zhang Y. S.; Shang P. F.; Wang J. W.; et al. Trace element (Hg, As, Cr, Cd, Pb) distribution and speciation in coal-fired power plants. Fuel 2017, 208, 647–654. 10.1016/j.fuel.2017.07.064. [DOI] [Google Scholar]
- Tian Q. Z.; Guo B. L.; Nakama S.; et al. Distributions and leaching behaviors of toxic elements in fly ash. ACS Omega 2018, 3, 13055–13064. 10.1021/acsomega.8b02096. [DOI] [PMC free article] [PubMed] [Google Scholar]
- Wang X. M.; Wang X. M.; Pan S. D.; et al. Occurrence of analcime in the middle Jurassic coal from the Dongsheng coalfield, northeastern Ordos Basin, China. Int. J. Coal Geol. 2018, 196, 126–138. 10.1016/j.coal.2018.07.004. [DOI] [Google Scholar]
- Karayigit A. I.; Bulut Y.; Karayigit G.; et al. Mass balance of major and trace elements in a coal-fired power plant. Energy Sources, Part A 2006, 28, 1311–1320. 10.1080/009083190910523. [DOI] [Google Scholar]
- Lewińska-Preis L.; Fabiańska M. J.; Cmiel S.; et al. Geochemical distribution of trace elements in Kaffioyra and Longyearbyen coals, Spitsbergen, Norway. Int. J. Coal Geol. 2009, 80, 211–223. 10.1016/j.coal.2009.09.007. [DOI] [Google Scholar]
- Sun Y.; Zhao C.; Li Y; et al. Li distribution and mode of occurrences in Li-bearing coal seam #6 from the Guanbanwusu mine, Inner Mongolia, northern China. Energy Explor. Exploit. 2012, 30, 109–130. 10.1260/0144-5987.30.1.109. [DOI] [Google Scholar]
- Dai S. F.; Ren D. Y.; Chou C. L.; et al. Mineralogy and geochemistry of the No.6 coal (Pennsylvanian) in the Junger coalfield, Ordos Basin, China. Int. J. Coal Geol. 2006, 66, 253–270. 10.1016/j.coal.2005.08.003. [DOI] [Google Scholar]
- Zhao J. T.; Cheng F. Q.; Yang F. L.; et al. Particle size distribution and thermal decomposition behavior of limestone for desulfurization of CFB. Coal Convers. 2018, 41, 34–41. (in Chinese with English abstract). [Google Scholar]
- Ma Z. B.; Chang K. K.; Yan K. Z.; et al. Characteristics of fly ash and slag in circulating fluidized bed under different conditions. Coal Clean Technol. 2016, 22, 20–25. (in Chinese with English abstract). [Google Scholar]
- Dai S. F.; Zhao L.; Hower J. C.; et al. Petrology, mineralogy, and chemistry of size-fractioned fly ash from the Jungar power plant, Inner Mongolia, China, with emphasis on the distribution of rare earth elements. Energy Fuels 2014, 28, 1502–1514. 10.1021/ef402184t. [DOI] [Google Scholar]
- Mukherjee S.; Srivastava S. K. Minerals transformations in northeastern region coals of India on heat treatment. Energy Fuels 2006, 20, 1089–1096. 10.1021/ef050155y. [DOI] [Google Scholar]
- Vassileva C. G.; Vassilev S. V. Behaviour of inorganic matter during heating of Bulgarian coals 1. Lignites. Fuel Process. Technol. 2005, 86, 1297–1333. 10.1016/j.fuproc.2005.01.024. [DOI] [Google Scholar]
- Tang Q.; Liu G. J.; Zhou C. C.; et al. Distribution of trace elements in feed coal and combustion residues from two coal-fired power plants at Huainan, Anhui, China. Fuel 2013, 107, 315–322. 10.1016/j.fuel.2013.01.009. [DOI] [Google Scholar]
- Ma Z. B.; Bai J.; Li W.; Bai Z. Q.; Kong L. X. Mineral transformation in char and its effect on coal char gasification reactivity at high temperatures, part 1: mineral transformation in char. Energy Fuels 2013, 27, 4545–4554. 10.1021/ef4010626. [DOI] [Google Scholar]
- Ward C. R.; French D. Determination of glass content and estimation of glass composition in fly ash using quantitative X-ray diffractometry. Fuel 2006, 85, 2268–2277. 10.1016/j.fuel.2005.12.026. [DOI] [Google Scholar]


