

Abstract
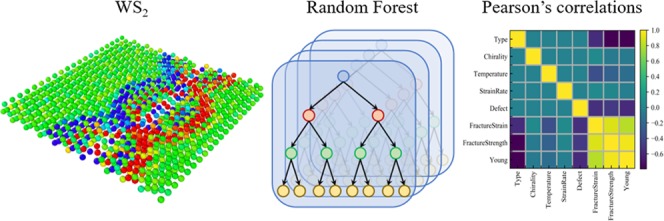
One of two-dimensional transition metal dichalcogenide materials, tungsten disulfide (WS2), has aroused much research interest, and its mechanical properties play an important role in a practical application. Here the mechanical properties of h-WS2 and t-WS2 monolayers in the armchair and zigzag directions are evaluated by utilizing the molecular dynamics (MD) simulations and machine learning (ML) technique. We mainly focus on the effects of chirality, system size, temperature, strain rate, and random vacancy defect on mechanical properties, including fracture strain, fracture strength, and Young’s modulus. We find that the mechanical properties of h-WS2 surpass those of t-WS2 due to the different coordination spheres of the transition metal atoms. It can also be observed that the fracture strain, fracture strength, and Young’s modulus decrease when temperature and vacancy defect ratio are enhanced. The random forest (RF) supervised ML algorithm is employed to model the correlations between different impact factors and target outputs. A total number of 3600 MD simulations are performed to generate the training and testing dataset for the ML model. The mechanical properties of WS2 (i.e., target outputs) can be predicted using the trained model with the knowledge of different input features, such as WS2 type, chirality, temperature, strain rate, and defect ratio. The mean square errors of ML predictions for the mechanical properties are orders of magnitude smaller than the actual values of each property, indicating good training results of the RF model.
1. Introduction
Two-dimensional (2D) materials have attracted the research interest from both academia and industries due to their glorious properties,1−4 since graphene was successfully obtained from the graphite for the first time using mechanical exfoliation in 2004.5 Although graphene possesses outstanding thermal, electrical, and mechanical properties,6−8 the characteristic of zero band gap limits its direct applications in nanoelectronics, such as field effect transistors (FETs),9 which drives the researcher to discover novel 2D materials with the desired semiconducting features. Transition metal dichalcogenides (TMDCs) are emerging materials with fascinating physical properties,10,11 which have the chemical formula of MX2 (M is a transition metal atom and X is a chalcogen atom). TMDCs have direct band gaps and can be widely used in FETs,12 planar batteries,13 and nanogenerators.14 In the TMDC family, it has been demonstrated that tungsten disulfide (WS2) has a direct energy gap of ∼2 eV, a strong spin–orbit coupling, and the splitting of valence bands at K/K′ points, which ensures that WS2 be the next-generation candidate in nanoelectronics, spintronics, and optoelectronics.15−17 Ovchinnikov et al. have reported that the WS2-based FETs displayed excellent electrical properties,18 such as the n-type behavior with a high room-temperature on/off current ratio of ∼106. Moreover, at low temperatures, the metallic behavior in the WS2-based FETs was possessed at high charge carrier densities and mobilities as high as ∼140 cm2 V–1 s–1 (above 300 cm2 V–1 s–1 for bilayers). The thermal conductivity of WS2 monolayer has been evaluated by experimental measurement19 and first-principles theory,20 which were equal to 32 W m–1K–1 and 31.8 W m–1 K–1, respectively.
Although the electrical and thermal properties of WS2 have been widely investigated, its mechanical properties such as the deformation and fracture under different temperatures and pressures have not been given enough attention. Several works have been performed to evaluate the mechanical properties of several other TMDCs. Bertolazzi et al. experimentally measured Young’s moduli of monolayer and bilayer MoS2 and the values were 270 ± 100 GPa and 200 ± 100 GPa, respectively.21 By making use of the first-principles theory, Young’s moduli of MoS2 were investigated to be 200.2 ± 0.2 GPa and 200.4 ± 0.4 GPa in armchair and zigzag directions, respectively; the corresponding ultimate strengths were equal to 23.6 GPa and 16.1 GPa.22 The averaged Young’s modulus of suspended MoS2 nanosheets was measured to be 330 ± 70 GPa, which was equivalent to graphene oxide.23 It has been displayed that the mechanical properties of WSe2 were independent of the layer thickness.24 For multilayer WSe2, the fracture strength and fracture strain were 12.4 GPa and 0.073, respectively, and Young’s modulus was 167.3 ± 6.7 GPa. Also, by utilizing the molecular dynamics (MD) simulation, MoSe2 monolayer was found to possess different fracture strengths and fracture strains along the armchair and zigzag directions, which both decreased with increased temperature.25 However, to the best of our knowledge, there are no systematical investigations about the mechanical properties of WS2 under the effects of different phases, chiralities, temperatures, strain rates, and vacancy defects. Therefore, it is worth evaluating the mechanical responses of WS2 to enrich this research gap.
Applications of machine learning (ML) techniques in material science have attracted growing attention in recent years.26−28 Most of the models used in property predictions are supervised ML algorithms, meaning the model needs to be trained on large amounts of dataset to find the inherent correlations between the input features and output targets. The dataset for ML algorithms can be obtained either experimentally or numerically. For numerical studies, the generation of the training dataset is computationally intensive and time consuming, which creates a tremendous challenge. Recently, with the help of high-performance supercomputers, the training dataset can be obtained within a reasonable amount of time by carefully selecting and designing the sampling properties and data structures. Random forest (RF) is a versatile and robust ensemble ML algorithm based on decision trees for both classification and regression problems,29 which can gain accuracy as the trees grow without suffering from overtraining. It has been successfully employed in several fields such as image classification,30 voice recognition,31 weather forecast,32 and material classification.33 On account of its extraordinary capability, the RF algorithm is utilized to predict the mechanical properties of WS2 with the help of MD generated training dataset in this work.
TMDCs possess several structural phases on account of the different coordination spheres of the transition metal atoms. The features of two stable phases are trigonal prismatic (h-phase) and octahedral (t-phase) coordination of metal atoms. In this work, we systematically apply MD and ML techniques to investigate the effects of WS2 type, chirality, size, temperature, strain rate, and defect ratio on mechanical properties. First, the chirality dependence and size dependence of mechanical properties of WS2 are evaluated. Afterward, we analyze the effects of temperature, strain rate, and vacancy defect on fracture performances of WS2. Finally, after training the ML algorithm with MD results, ML is further applied to predict the fracture strains, fracture strengths, and Young’s moduli on h-WS2 and t-WS2.
2. Methodology
Random forest machine learning algorithm is an ensemble technique that can be used in both classification and regression tasks. The RF algorithm is composed of multiple decision trees (DTs)34 and a technique called Bootstrap Aggregation, also known as bagging.35 It utilizes the same learning algorithm but train each learner on a different set of data. The RF algorithm combines multiple DTs in determining the final output rather than relying on individual DTs. Mean square errors (MSEs) are applied to assess the model performances, which is calculated by the following equation
| 1 |
where n is the number of samples, i is the sample index, y is the target value, and ŷ is the predicted value. An illustration of the RF algorithm is shown in Figure 1. Each box with a blue background color represents an individual DT, and the RF is composed of an ensemble of DTs. There are two general issues with ML model trainings, i.e., overfitting and underfitting. The overfitting problem can be caused by the ML algorithm being too complex for the training data or the dataset is too small. An overfitted model will predict the training data with very high accuracy or very low MSE but has poor generalization performances on the test or new data. This is due to the fact that the model is learning from the noise of the data instead of the actual relationships between variables. In contrast to overfitting, an underfitted model could not describe the training data and therefore misses the trends, which also means the model cannot be generalized to new data. For example, underfitting could occur when using a linear model to describe a second-order polynomial dataset. Since the RF algorithm is a very versatile approach, underfitting is unlikely to occur for the dataset used in this work. To battle the overfitting problem and validate the trained model, a 10-fold cross-validation is used.
Figure 1.

Illustration of random forest machine learning algorithm.
All simulations are performed utilizing the open source software Large-scale Atomic/Molecular Massively Parallel Simulator (LAMMPS).36Figure 2 displays the atomic configurations of h-WS2 and t-WS2. The pink solid spheres represent W atoms, and yellow solid spheres represent S atoms. The armchair and zigzag chiralities are along the x direction and y direction, respectively. To model the W and S atom interactions within the h-WS2 and t-WS2 monolayers, the two different Stillinger–Weber potentials developed by Jiang et al. are employed, respectively.37 The time step is set as 0.5 fs. Periodic boundary conditions are employed in all directions to eliminate the edge effects. Moreover, we add a vacuum layer of 10 nm in the z direction to avoid the atomic interaction with the system image. The simulation process is as follows: we first relax the original WS2 structure using the Polak–Ribiere version of the conjugate gradient algorithm. The system is then switched to the isothermal–isobaric ensemble (NPT) to further eliminate the system residuary stress at 0 bar for 300 ps. Thereafter, the WS2 system is elongated with a designated strain rate, where the elongation of WS2 system will abide by the following equation
| 2 |
where L0 is the original system length, Lt is the length of the system at time t, and ε is the strain rate. We apply the uniaxial displacement along either the armchair or zigzag direction and hold the pressure along the other two directions as zero. For each simulation, five independent simulations with different velocity seeds (initial conditions) are performed, and the final values are calculated by averaging each simulation with the standard deviations shown as error bars.
Figure 2.
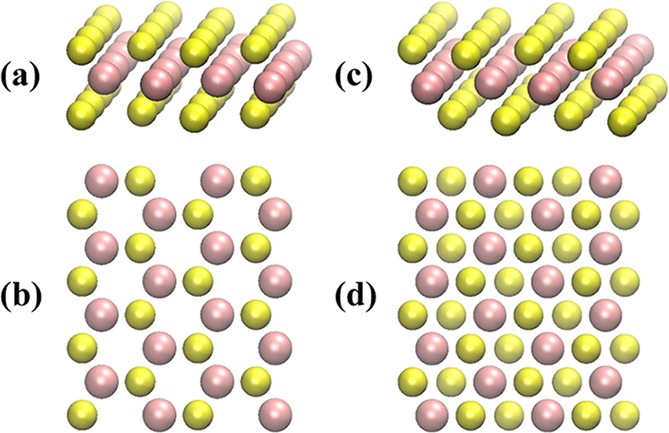
(a, b) Side and top views of h-WS2. (c, d) Side and top views of t-WS2.
We perform 3600 (2 types × 2 directions × 6 temperatures × 5 strain rates × 6 defect ratios × 5 initial conditions) MD simulations as input files to generate enough data points for the ML algorithms, which are organized in a hierarchical structure. When 3600 MD simulations are finished, we collect all strain–stress results and postprocess them using a MATLAB script. Afterward, the fracture strain, fracture strength, and Young’s modulus with a given type, direction, temperature, strain rate, and vacancy can be extracted. Finally, 80% of MD results are then inputted into the ML algorithms for the model training and 20% of the data points are isolated to test the ML model performance.
3. Results and Discussion
3.1. Effects of Chirality and Size
First, the chirality dependence of the mechanical properties of WS2 is studied. The system is stretched after the relaxation process in NPT at 1 K by employing a constant strain rate of 1 × 10⁻⁴ ps–1 in the armchair or zigzag direction. The strain–stress relations for h-WS2 and t-WS2 with size 5.42 × 6.26 nm2 (x × y nm2) are depicted in Figure 3. At the small strain level, the linear variation in the strain–stress curves can be observed from Figure 3, which reveals the elastic mechanical response. On the contrary, the relation between stress and the applied strain under high strain values becomes nonlinear, and plastic deformation generates for both h-WS2 and t-WS2. Moreover, with the further increased strain, the stress finally arrives at the maximum value and suddenly drops down, which is due to the system fracture. We attribute this elastic–plastic deformation transition to the phase transformation in WS2 during elongation.25
Figure 3.
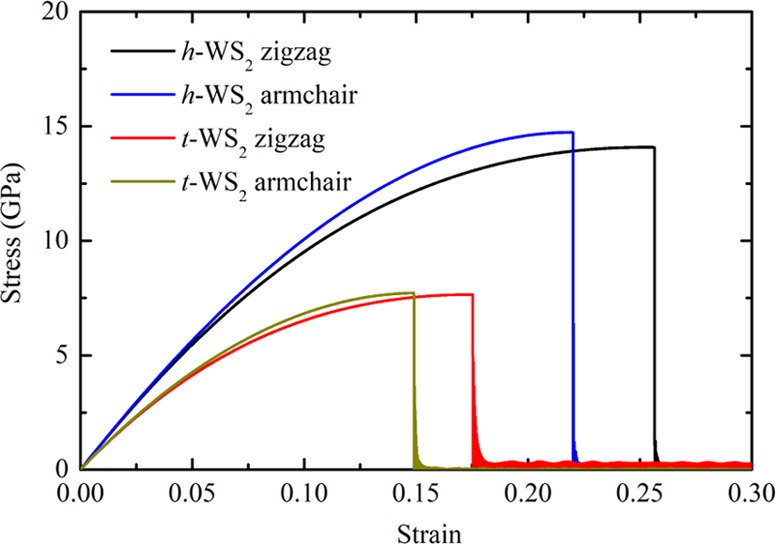
Strain–stress profiles of h-WS2 and t-WS2 in the zigzag and armchair directions at 1 K and a strain rate of 1 × 10⁻⁴ ps–1.
The fracture strength is defined as the maximum stress the system can withstand, and the corresponding strain represents the fracture strain. The h-WS2 possesses the higher averaged fracture strength and fracture strain in the armchair and zigzag directions, which are equal to 14.74 GPa, 0.22 and 14.09 GPa, 0.25, severally. However, the lower fracture strengths and strains for t-WS2 are 7.72 GPa, 0.15 and 7.65 GPa, 0.17, respectively. Afterward, Young’s moduli of WS2 are calculated by fitting the low strain level (<0.02) stress–strain curves. For h-WS2, the calculated Young’s moduli are 119.44 GPa and 117.89 GPa along the armchair and zigzag directions, respectively, and for t-WS2, the corresponding Young’s moduli are 95.38 GPa and 94.11 GPa. We attribute the mechanical discrepancy between h-WS2 and t-WS2 to the phase structure difference. Due to the different coordination spheres of the transition metal atoms, WS2 displays the discrepant bond stretching and bending interactions in these two phases, which subsequently leads to diverse physical properties. For instance, h-WS2 acts as a semiconductor, whereas t-WS2 similar to metal has no band gap.38 From Figure 3, we also find that there are weak anisotropies in both h-WS2 and t-WS2 owing to the variations of bond length (W–S and S–S) and bond angle (S–W–S) under the tensile stress.39 To exhibit the fracture differences between h-WS2 and t-WS2, Figure 4 displays the crack propagations along the armchair direction. It can be observed that the force required to break the bonding in t-WS2 is much lower than that in h-WS2. This phenomenon coincides with the results displayed in Figure 3. The similar phenomenon has been reported in other 2D materials.22,40,41 It has been reported that the calculated Young’s moduli of borophene along the armchair and zigzag directions at 1 K are ∼1203 GPa and ∼562 GPa, respectively, and the obvious difference mechanical properties between disparate chirality could be observed.40 Similarly, Mortazavi demonstrated that the ultimate tensile strength of C3N monolayer in the armchair direction was around 2.4 GPa larger than that in the zigzag direction.41 It should be noted that even though the mechanical properties along different directions are similar at a low strain level, the deformation behaviors at a high strain level depict the significant discrepancy, which consists well with the first-principles calculation of MoS2 monolayer.22
Figure 4.

Crack formation and propagation in the armchair direction of (a) h-WS2 and (b) t-WS2. The color bar denotes the atomic forces in the unit of eV Å–1.
In general, the physical properties of 2D materials exhibit size dependence with the effect of the material edge. For example, due to phonon boundary scattering, the thermal conductivities of MoS2 and MoSe2 will decrease with the reduction of the material length.11 Hence, it is significant to investigate the size dependence of the mechanical properties of WS2. Here we build other three dimensions of h-WS2 and t-WS2 monolayers with sizes 1.08 × 1.25, 10.84 × 12.52, and 21.69 × 25.04 nm2, aside from the previous 5.42 × 6.26 nm2. The relations between calculated fracture strain, fracture strength, and Young’s moduli and system sizes are depicted in Figure 5. We can notice that the fracture strains, fracture strengths, and Young’s moduli of h-WS2 and t-WS2 keep convergent with the varied size, which manifests that WS2 shows size-independent in current size range. Therefore, we choose the system of 5.42 × 6.26 nm2 in subsequent MD simulations to save computational cost.
Figure 5.
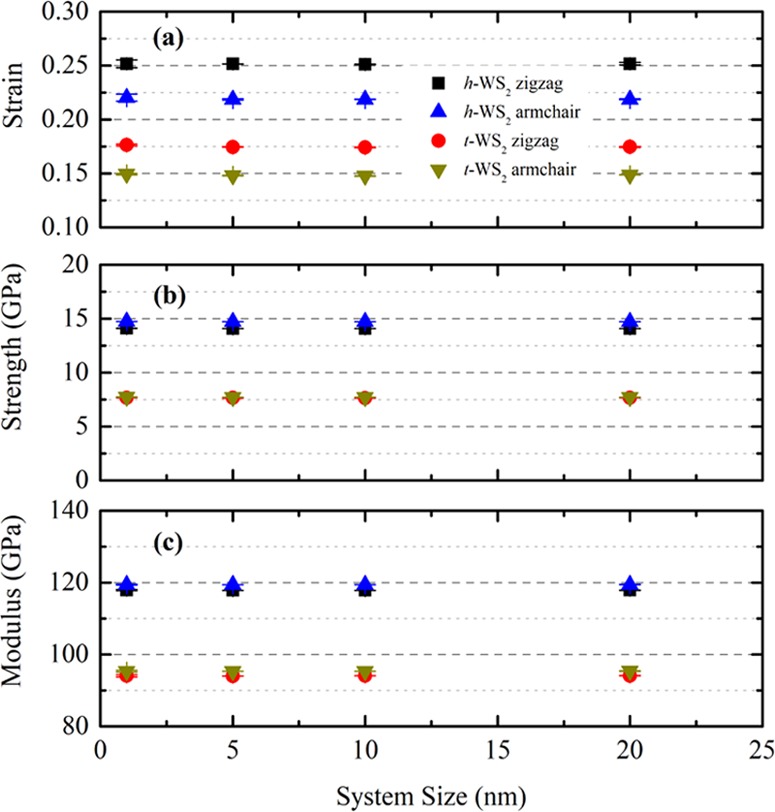
Convergence of (a) fracture strain, (b) fracture strength, and (c) Young’s modulus with system dimensions at 1 K and a strain rate of 1 × 10⁻⁴ ps–1. Each data point is averaged from five independent simulations with different initial conditions. The error bars represent standard deviations.
3.2. Effects of Temperature and Strain Rate
In practical applications, the nanoelectronics is frequently operated under versatile physical environment, for example, extreme temperature and high loading strain rate, which can alter the mechanical properties of structural materials or even cause unexpected structural failures. Therefore, here we analyze the influences of temperature and strain rate on the mechanical properties of the WS2.
Different temperatures of 1, 100, 200, 300, 400, and 500 K are employed in the NPT ensemble. In view of the similar variation trends for t-WS2, the strain–stress profiles for h-WS2 variations with temperature are only displayed in Figure 6. It can be found that the increased temperature makes the fracture phenomena arise earlier in both directions for h-WS2. The fracture strain, fracture strength, and Young’s modulus with different temperatures are also calculated by using the same method in the above studies, which are depicted in Figure 7. When the temperature increases from 1 to 500 K, the fracture strains along the armchair and zigzag directions decline monotonically from 0.22 to 0.13, from 0.25 to 0.14 (for h-WS2) and from 0.15 to 0.06, from 0.17 to 0.07 (for t-WS2); the corresponding fracture strengths accordingly decrease by 22.79%, 19.92% and 40.65%, 39.82%. This temperature-induced reduction in the WS2 mechanical properties resembles with other 2D materials.42,43 The effect of temperature may stem from the following three reasons: (1) The kinetic energy is transferred into strain energy during the deformation due to tensile stress, and the kinetic energy of atoms increases at the elevated temperature, which decreases the strain energy.44 (2) Due to the applied tensile stress, the binding energy between atoms decreases, which generates the lower energy barrier for breaking the chemical bonds.25,44,45 (3) The thermal fluctuations of atoms enhance at elevated temperature, and cause that the lower energy barrier is more likely to be overcome.42 Based on the above discussion, we can deduce that high temperature accelerates the fracture formation and propagations in both h-WS2 and t-WS2. Although the fracture strain and fracture strength exhibit the obvious temperature dependence, the temperature sensitivity of Young’s modulus is relatively slight. The calculated Young’s moduli along the armchair and zigzag directions are slightly reduced from 119.44 to 113.59 GPa, from 117.89 to 111.77 GPa (for h-WS2), and from 95.38 to 82.81 GPa, from 94.11 to 81.75 GPa (for t-WS2), severally. It can also be observed that since t-WS2 are apt to deform, the temperature sensitivities of the mechanical properties of t-WS2 are more obvious than those of h-WS2.
Figure 6.
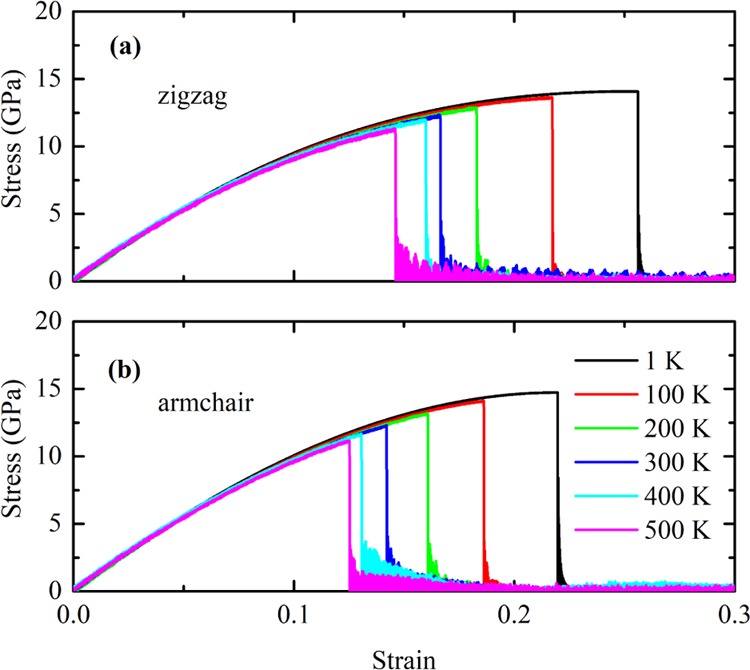
Variations of strain–stress curves with temperature from 1 to 500 K for h-WS2 in the (a) zigzag and (b) armchair directions with a constant strain rate of 1 × 10⁻⁴ ps–1.
Figure 7.

Effects of temperature on (a) fracture strain, (b) fracture strength, and (c) Young’s modulus of h-WS2 and t-WS2 in the zigzag and armchair directions with a constant strain rate of 1 × 10⁻⁴ ps–1. Each data point is averaged from five independent simulations with different initial conditions. The error bars represent standard deviations.
Moreover, we set different strain rates of 1 × 10⁻⁴ (i.e., the aforementioned strain rate), 2.5 × 10⁻⁴, 5 × 10⁻⁴, 1 × 10⁻³, and 2.5 × 10⁻³ ps–1 in MD simulations to study the effect of strain rate. The relations between strain rate and fracture strains, fracture strengths, and Young’s moduli of h-WS2 and t-WS2 at 1 K are shown in Figure 8. We observe that the fracture strains and fracture strengths keep almost unchanged and the calculated Young’s moduli have an unconspicuous reduction with an increased strain rate. Our results agree well with the previous results about the effect of strain rate on the mechanical properties of MoSe2.25
Figure 8.
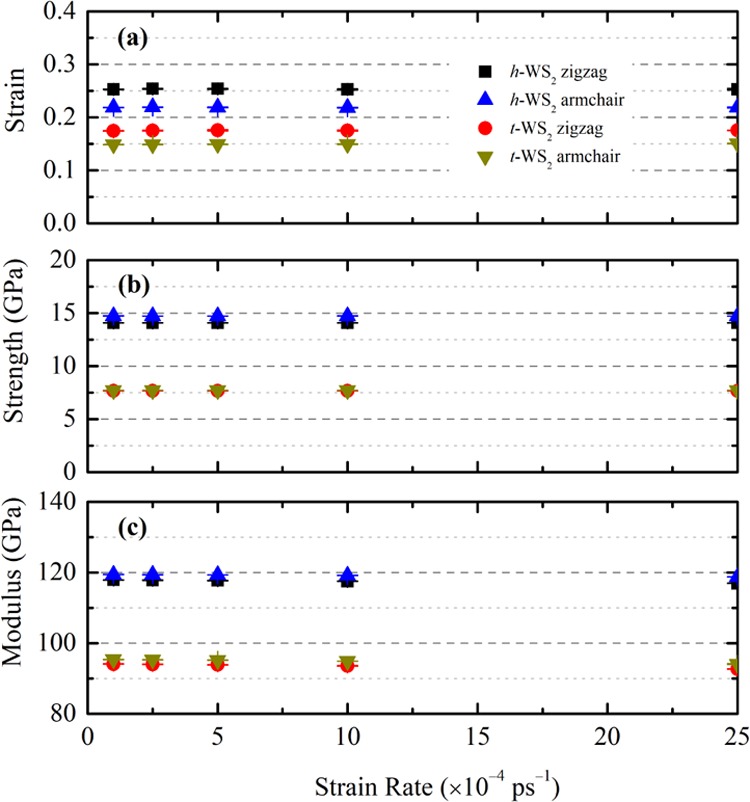
Effect of strain rate from 1 to 25 × 10–4 ps–1 on (a) fracture strain, (b) fracture strength, and (c) Young’s modulus of h-WS2 and t-WS2 in the zigzag and armchair directions at 1 K.
3.3. Effect of Vacancy Defect
Previous investigations have reported that vacancy defects can alter and tune the physical and chemical properties of 2D materials.46,47 It has been observed that the electronic transport was transformed by generating defect-induced localized states in defective MoS2.46 Furthermore, the increasing vacancy defects decreased the thermal conductivity of graphene due to the enhanced phonon defect scattering and the suppressed low frequency phonons.47 The general method for the synthesis of high-quality WS2 is chemical vapor deposition on SiO2/Si,48 hexagonal boron nitride,49 or reusable Au foil substrates.50 However, owing to the imperfection of chemically grown process in 2D materials, structure defects including vacancies are particularly noticeable.51 Therefore, it is worthy of evaluating mechanical responses with different vacancy defect ratios. In graphene monolayer, the type of defect can also affect the thermal and mechanical properties, which includes the single-vacancy defect, double-vacancy defect, multi-vacancy defect, and Stone–Wales defect.52−55 To investigate the effect of defects on the mechanical properties in WS2, we created random defects including different vacancy defect types with vacancy concentration from 0 to 5% in both h-WS2 and t-WS2.
Effects of vacancy defect on the mechanical properties of h-WS2 and t-WS2 at 1 K and 1 × 10⁻⁴ ps–1 are shown in Figure 9. When the vacancy defect ratio increases from 0 to 5%, the fracture strengths for h-WS2 and t-WS2 in the armchair and zigzag directions will decrease by 48.35%, 49.67% and 44.26%, 48.73%, respectively; the decline proportions of the fracture strain are 54.89%, 60.41% and 51.30%, 62.10%. Moreover, the corresponding Young’s moduli strictly reduce from 119.44 to 92.15 GPa, from 117.89 to 90.00 GPa and from 95.38 to 73.62 GPa, from 94.11 to 72.44 GPa with vacancy defects up to 5%. The similar effect of vacancy defects has been observed in other 2D systems.22,42,56 Gan et al. using the first-principles theory investigated the effect of regular vacancy defect, i.e., 3 × 3 × 1 MoS2 supercell structure with one sulfur missing vacancy, on Young’s moduli and ultimate strengths. They found that this vacancy defect could reduce Young’s moduli and fracture strengths from 200.0 ± 0.2 to 194.2 ± 0.2 GPa, from 23.6 to 17.8 GPa and from 200.4 ± 0.2 to 191.8 ± 0.4 GPa, from 16.1 to 15.4 GPa in the armchair and zigzag directions, respectively.22 The defect dependence of mechanical properties of phosphorene was investigated by utilizing the MD simulations. When the vacancy concentration was 2%, in comparison with the pristine structure, the fracture strength of phosphorene along the armchair and zigzag directions decreased by 39% and 41%, respectively; the corresponding fracture strains dropped by 34% and 39%.42 The effect of vacancy defect may be attributed to the following points: (1) The WS2 monolayers have stress concentration at the vacancy defects, where the stress concentration can affect the fracture behaviors.57,58 (2) The fracture of WS2 monolayers is originated by the nucleation of a vacancy defect, and the increasing vacancy defect enhances the nucleation phenomenon. (3) The integrity of pristine WS2 can be broken by vacancy defects, and the vacancies disorder and weaken the W–S bond interaction.22,42,56 As a consequence, the subsistent vacancy defects accelerate the formation and extension of crack under the tensile stress.
Figure 9.
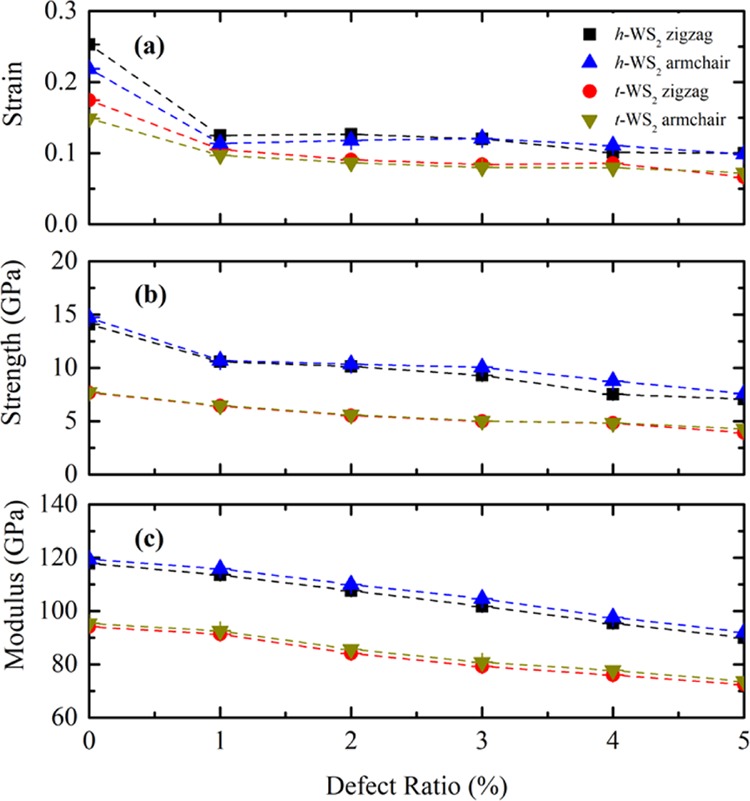
Effects of defect from 0 to 5% on (a) fracture strain, (b) fracture strength, and (c) Young’s modulus of h-WS2 and t-WS2 in the zigzag and armchair directions at 1 K and a strain rate of 1 × 10⁻⁴ ps–1.
3.4. Machine Learning Predictions
The mechanical properties of h-WS2 and t-WS2 are calculated in both zigzag and armchair directions under six different temperatures, five different strain rates, and six different defect ratios. Therefore, each data point is associated with five input features, i.e., type, chirality, temperature, strain rate, and defect ratio, and three output target values, i.e., fracture strain, fracture strength, and Young’s modulus. The dataset is split into training and testing with portions of 80% and 20%, respectively. We use a 10-fold cross-validation to inspect the accuracies of trained models for the sake of flagging overfitting or selection bias. It should be noticed that the dataset is split using a stratified method rather than the random method, which can ensure the effect of the most important feature on the training results. Figure 10 displays the evaluated Pearson’s correlation between each pair of input features and output targets. The correlation coefficient ranges from −1 to 1 corresponding to the strongest negative and positive correlations. It is observed that the type of WS2 has the strongest impact on its fracture strain, fracture strength, and Young’s modulus. However, since there are only two categories for the WS2 types, it is less likely to have a biased data selection compared to other features. Therefore, the second most significant impact factor, i.e., defect, is used for the data split. We employ the feature scaling to get better results and normalize all input values between 0 and 1 to uniform the distribution of feature spaces.
Figure 10.
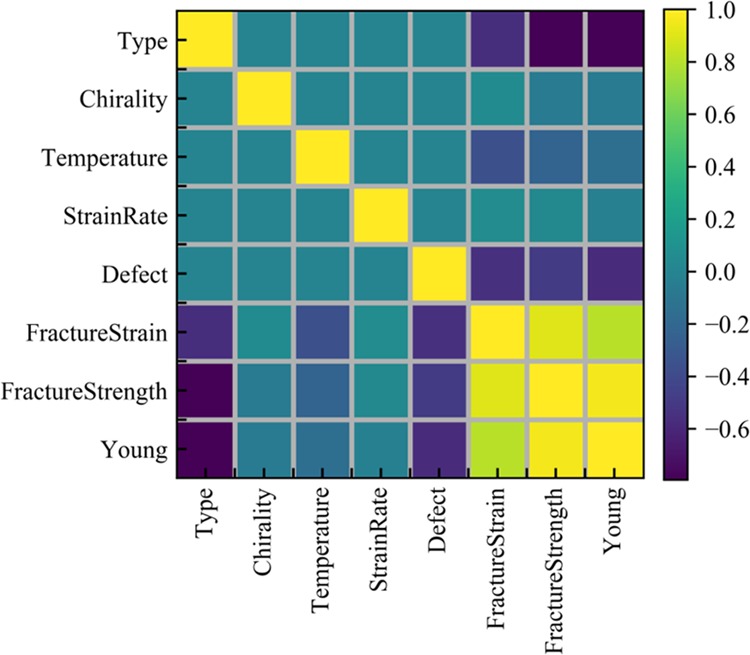
Pearson’s correlations among different features and target outputs.
To find the best parameter for the RF algorithm, a grid search method is used to determine the optimal values to be used for the hyperparameters. Two hyperparameters, i.e., max-depth and n-estimator, are optimized in the grid search. The max-depth refers to the maximum depth of the tree and n-estimator is the number of the trees in the forest. Ideally, the performance of the model will increase with the growing number of trees but one needs to be cautious to avoid the overfitting problems. A list of max-depth values ranging from 3 to 10 is explored. For n-estimator, different values of 1, 10, 100, 1000, and 2000 are used. The best combinations of max-depth and n-estimator are 9 and 1000, respectively. A 10-fold cross-validation is conducted to verify the accuracy of the trained model as well as overfitting. Once the model is trained, the RF regressor is used to predict the mechanical properties of WS2 on the test data. As shown in Figure 11, the predicted mechanical properties from the trained RF model soundly match those generated from the MD simulations, indicating the validity of the ML model. The overall MSEs for fracture strain, fracture strength, and Young’s modulus are 9.2 × 10⁻⁶, 1.9 × 10⁻² GPa, and 3.8 GPa, respectively, which are several orders of magnitude lower than the corresponding properties.
Figure 11.
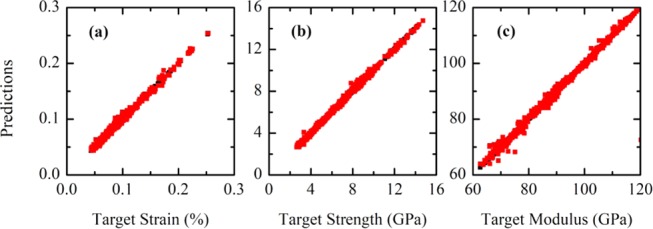
Comparisons of ML predicted (a) fracture strain, (b) fracture strength, and (c) Young’s modulus with MD simulation results. The red and black square dots represent ML predicted and target values, respectively.
Even though the mechanical properties of h-WS2 and t-WS2 monolayers can be successfully predicted by the RF regressor, it is worth noting that there are some limitations associated with the current trained model. To save computational time, only five impact factors including system type, chirality, temperature, strain rate, and defect were considered in this work. Therefore, the model cannot be employed on systems where other impact factors such as isotopic doping or chemical functionalization existence; otherwise, the addition of each new impact factor would drastically bring out the increase of computational time. Meanwhile, the model is specifically trained on the mechanical properties of WS2, and new train datasets are required for other materials. Nevertheless, the successful implementation of the machine learning technique to mechanical property prediction sheds some light on data-driven materials studies and paves the way for solving engineering problems using the state-of-the-art artificial intelligence approach.
4. Conclusions
In conclusion, the mechanical properties of h-WS2 and t-WS2 monolayers are investigated systematically using the MD simulations and machine learning technique. The trained ML model can predict the mechanical properties of WS2 with the knowledge of input features including WS2 type, chirality, temperature, strain rate, and defect ratio. The MSEs between ML predicted and MD simulation generated results are 9.2 × 10⁻⁶, 1.9 × 10⁻² GPa, and 3.8 GPa for fracture strain, fracture strength, and Young’s modulus, respectively, which are several orders of magnitude lower than the corresponding properties. On account of the different coordination spheres of the transition metal atoms, the fracture strain, fracture strength, and Young’s modulus of t-WS2 are lower than those of h-WS2. The fracture strain reduction ratios of h-WS2 and t-WS2 in the armchair and zigzag directions are 41.20%, 43.08% and 57.78%, 60.82%, respectively, as the temperature enhances from 1 to 500 K. Furthermore, the fracture strengths accordingly decrease by 22.79%, 19.92% and 40.65%, 39.82%. We attribute the decrease of mechanical properties to the decreased strain energy, the decreased binding energy, and the enhanced atoms thermal fluctuations. The fracture strains and fracture strengths are almost unchanged, and the calculated Young’s moduli have the trivial reduction with the increased strain rate. The increasing vacancy defect from 0 to 5% is found to decrease the fracture strain, fracture strength, and Young’s modulus on account of the stress concentrations, the increasing fracture nucleation, the disorderly W–S bonds, and the material softening.
Acknowledgments
This work was supported by the National Natural Science Foundation of China (No. 51806123), the Shandong Provincial Natural Science Foundation, China (No. ZR2018BEE025), the China Postdoctoral Science Foundation (No. 2018M642654), and the Fundamental Research Funds of Shandong University, China (No. 2018TB007). The simulations were performed utilizing the Holland Computing Center of the University of Nebraska, which receives support from the Nebraska Research Initiative.
The authors declare no competing financial interest.
References
- Xiong Z.; Wang X.; Lee K. H. K.; Zhan X.; Chen Y.; Tang J. Thermal transport in supported graphene nanomesh. ACS Appl. Mater. Interfaces 2018, 10, 9211–9215. 10.1021/acsami.8b00097. [DOI] [PubMed] [Google Scholar]
- Wang X.; Hong Y.; Ma D.; Zhang J. Molecular dynamics study of thermal transport in a nitrogenated holey graphene bilayer. J. Mater. Chem. C 2017, 5, 5119–5127. 10.1039/C7TC01536D. [DOI] [Google Scholar]
- Han D.; Wang X.; Ding W.; Chen Y.; Zhang J.; Xin G.; Cheng L. Phonon thermal conduction in a graphene-C3N heterobilayer using molecular dynamics simulations. Nanotechnology 2019, 30, 075403 10.1088/1361-6528/aaf481. [DOI] [PubMed] [Google Scholar]
- Mortazavi B.; Makaremi M.; Shahrokhi M.; Fan Z.; Rabczuk T. N-graphdiyne two-dimensional nanomaterials: semiconductors with low thermal conductivity and high stretchability. Carbon 2018, 137, 57–67. 10.1016/j.carbon.2018.04.090. [DOI] [Google Scholar]
- Novoselov K. S.; Geim A. K.; Morozov S. V.; Jiang D.; Zhang Y.; Dubonos S. V.; Grigorieva I. V.; Firsov A. A. Electric field effect in atomically thin carbon films. Science 2004, 306, 666. 10.1126/science.1102896. [DOI] [PubMed] [Google Scholar]
- Bolotin K. I.; Sikes K. J.; Jiang Z.; Klima M.; Fudenberg G.; Hone J.; Kim P.; Stormer H. L. Ultrahigh electron mobility in suspended graphene. Solid State Commun. 2008, 146, 351–355. 10.1016/j.ssc.2008.02.024. [DOI] [Google Scholar]
- Balandin A. A.; Ghosh S.; Bao W.; Calizo I.; Teweldebrhan D.; Miao F.; Lau C. N. Superior thermal conductivity of single-layer graphene. Nano Lett. 2008, 8, 902–907. 10.1021/nl0731872. [DOI] [PubMed] [Google Scholar]
- Lee C.; Wei X.; Kysar J. W.; Hone J. Measurement of the elastic properties and intrinsic strength of monolayer graphene. Science 2008, 321, 385–388. 10.1126/science.1157996. [DOI] [PubMed] [Google Scholar]
- Singh A. K.; Yakobson B. I. Electronics and magnetism of patterned graphene nanoroads. Nano Lett. 2009, 9, 1540–1543. 10.1021/nl803622c. [DOI] [PubMed] [Google Scholar]
- Wang Q. H.; Kalantar-Zadeh K.; Kis A.; Coleman J. N.; Strano M. S. Electronics and optoelectronics of two-dimensional transition metal dichalcogenides. Nat. Nanotechnol. 2012, 7, 699. 10.1038/nnano.2012.193. [DOI] [PubMed] [Google Scholar]
- Hong Y.; Zhang J.; Zeng X. C. Thermal conductivity of monolayer MoSe2 and MoS2. J. Phys. Chem. C 2016, 120, 26067–26075. 10.1021/acs.jpcc.6b07262. [DOI] [Google Scholar]
- Radisavljevic B.; Radenovic A.; Brivio J.; Giacometti V.; Kis A. Single-layer MoS2 transistors. Nat. Nanotechnol. 2011, 6, 147. 10.1038/nnano.2010.279. [DOI] [PubMed] [Google Scholar]
- Wan J.; Bao W.; Liu Y.; Dai J.; Shen F.; Zhou L.; Cai X.; Urban D.; Li Y.; Jungjohann K.; Fuhrer M. S.; Hu L. In situ investigations of Li-MoS2 with planar batteries. Adv. Energy. Mater. 2014, 5, 1401742 10.1002/aenm.201401742. [DOI] [Google Scholar]
- He M.; Lin Y.-J.; Chiu C.-M.; Yang W.; Zhang B.; Yun D.; Xie Y.; Lin Z.-H. A flexible photo-thermoelectric nanogenerator based on MoS2/PU photothermal layer for infrared light harvesting. Nano Energy 2018, 49, 588–595. 10.1016/j.nanoen.2018.04.072. [DOI] [Google Scholar]
- Sik Hwang W.; Remskar M.; Yan R.; Protasenko V.; Tahy K.; Doo Chae S.; Zhao P.; Konar A.; Xing H.; Seabaugh A.; Jena D. Transistors with chemically synthesized layered semiconductor WS2 exhibiting 105 room temperature modulation and ambipolar behavior. Appl. Phys. Lett. 2012, 101, 013107 10.1063/1.4732522. [DOI] [Google Scholar]
- Zeng H.; Liu G.-B.; Dai J.; Yan Y.; Zhu B.; He R.; Xie L.; Xu S.; Chen X.; Yao W.; Cui X. Optical signature of symmetry variations and spin-valley coupling in atomically thin tungsten dichalcogenides. Sci. Rep. 2013, 3, 1608 10.1038/srep01608. [DOI] [PMC free article] [PubMed] [Google Scholar]
- Perea-López N.; Elías A. L.; Berkdemir A.; Castro-Beltran A.; Gutiérrez H. R.; Feng S.; Lv R.; Hayashi T.; López-Urías F.; Ghosh S.; Muchharla B.; Talapatra S.; Terrones H.; Terrones M. Photosensor device based on few-layered WS2 films. Adv. Funct. Mater. 2013, 23, 5511–5517. 10.1002/adfm.201300760. [DOI] [Google Scholar]
- Ovchinnikov D.; Allain A.; Huang Y.-S.; Dumcenco D.; Kis A. Electrical transport properties of single-layer WS2. ACS Nano 2014, 8, 8174–8181. 10.1021/nn502362b. [DOI] [PubMed] [Google Scholar]
- Peimyoo N.; Shang J.; Yang W.; Wang Y.; Cong C.; Yu T. Thermal conductivity determination of suspended mono- and bilayer WS2 by Raman spectroscopy. Nano Res. 2015, 8, 1210–1221. 10.1007/s12274-014-0602-0. [DOI] [Google Scholar]
- Peng B.; Zhang H.; Shao H.; Xu Y.; Zhang X.; Zhu H. Thermal conductivity of monolayer MoS2, MoSe2, and WS2: interplay of mass effect, interatomic bonding and anharmonicity. RSC Adv. 2016, 6, 5767–5773. 10.1039/C5RA19747C. [DOI] [Google Scholar]
- Bertolazzi S.; Brivio J.; Kis A. Stretching and breaking of ultrathin MoS2. ACS Nano 2011, 5, 9703–9709. 10.1021/nn203879f. [DOI] [PubMed] [Google Scholar]
- Gan Y.; Zhao H. Chirality effect of mechanical and electronic properties of monolayer MoS2 with vacancies. Phys. Lett. A 2014, 378, 2910–2914. 10.1016/j.physleta.2014.08.008. [DOI] [Google Scholar]
- Castellanos-Gomez A.; Poot M.; Steele G. A.; van der Zant H. S. J.; Agraït N.; Rubio-Bollinger G. Elastic properties of freely suspended MoS2 nanosheets. Adv. Mater. 2012, 24, 772–775. 10.1002/adma.201103965. [DOI] [PubMed] [Google Scholar]
- Zhang R.; Koutsos V.; Cheung R. Elastic properties of suspended multilayer WSe2. Appl. Phys. Lett. 2016, 108, 042104 10.1063/1.4940982. [DOI] [Google Scholar]
- Wang X.; Hong Y.; Wang M.; Xin G.; Yue Y.; Zhang J. Mechanical properties of molybdenum diselenide revealed by molecular dynamics simulation and support vector machine. Phys. Chem. Chem. Phys. 2019, 21, 9159–9167. 10.1039/C8CP07881E. [DOI] [PubMed] [Google Scholar]
- Butler K. T.; Davies D. W.; Cartwright H.; Isayev O.; Walsh A. Machine learning for molecular and materials science. Nature 2018, 559, 547–555. 10.1038/s41586-018-0337-2. [DOI] [PubMed] [Google Scholar]
- Ferguson A.; Hachmann J. Machine learning and data science in materials design: a themed collection. Mol. Syst. Des. Eng. 2018, 3, 429–430. 10.1039/C8ME90007H. [DOI] [Google Scholar]
- Zhang Y.; Ling C. A strategy to apply machine learning to small datasets in materials science. npj Comput. Mater. 2018, 4, 25 10.1038/s41524-018-0081-z. [DOI] [Google Scholar]
- Ho T. K. In Random decision forests, Proceedings of the Third International Conference on Document Analysis and Recognition (Volume 1) - Volume 1, IEEE Computer Society, 1995; p 278.
- Zhu L.; Wu M. H.; Wan X. K.; Zhao N.; Xiong W. Image recognition of rapeseed pests based on random forest classifier. Int. J. Inf. Technol. Web Eng. 2017, 12, 1–10. 10.4018/IJITWE.2017070101. [DOI] [Google Scholar]
- Zvarevashe K.; Olugbara O. O. In Gender voice recognition using random forest recursive feature elimination with gradient boosting machines, 2018 International Conference on Advances in Big Data, Computing and Data Communication Systems (icABCD), 2018.
- Wolff B.; Kramer O.; Heinemann D. Selection of numerical weather forecast features for pv power predictions with random forests. Lect. Notes Comput. Sci. 2017, 10097, 78–91. 10.1007/978-3-319-50947-1_8. [DOI] [Google Scholar]
- Zhao Z. M.; Li C. H.; Shi H.; Zou Q. Material classification using random forest. Adv. Mater. Res. 2011, 301–303, 73–79. 10.4028/www.scientific.net/AMR.301-303.73. [DOI] [Google Scholar]
- Quinlan J. R. Induction of decision trees. Mach. Learn. 1986, 1, 81–106. 10.1007/BF00116251. [DOI] [Google Scholar]
- Breiman L. Bagging predictors. Mach. Learn. 1996, 24, 123–140. 10.1007/BF00058655. [DOI] [Google Scholar]
- Plimpton S. Fast parallel algorithms for short-range molecular-dynamics. J. Comput. Phys. 1995, 117, 1–19. 10.1006/jcph.1995.1039. [DOI] [Google Scholar]
- Jiang J.-W.; Zhou Y.-P.. Parameterization of Stillinger-Weber potential for two- dimensional atomic crystals; IntechOpen: London, 2017. [Google Scholar]
- Manzeli S.; Ovchinnikov D.; Pasquier D.; Yazyev O. V.; Kis A. 2D transition metal dichalcogenides. Nat. Rev. Mater. 2017, 2, 17033 10.1038/natrevmats.2017.33. [DOI] [Google Scholar]
- Gan Y.; Zhao H. Chirality and vacancy effect on phonon dispersion of MoS2 with strain. Phys. Lett. A 2016, 380, 745–752. 10.1016/j.physleta.2015.11.029. [DOI] [Google Scholar]
- Zhou Y.; Jiang J. Molecular dynamics simulations for mechanical properties of borophene: parameterization of valence force field model and Stillinger-Weber potential. Sci. Rep. 2017, 7, 45516 10.1038/srep45516. [DOI] [PMC free article] [PubMed] [Google Scholar]
- Mortazavi B. Ultra high stiffness and thermal conductivity of graphene like C3N. Carbon 2017, 118, 25–34. 10.1016/j.carbon.2017.03.029. [DOI] [Google Scholar]
- Sha Z.-D.; Pei Q.-X.; Zhang Y.-Y.; Zhang Y.-W. Atomic vacancies significantly degrade the mechanical properties of phosphorene. Nanotechnology 2016, 27, 315704 10.1088/0957-4484/27/31/315704. [DOI] [PubMed] [Google Scholar]
- Mortazavi B.; Fan Z.; Pereira L. F. C.; Harju A.; Rabczuk T. Amorphized graphene: a stiff material with low thermal conductivity. Carbon 2016, 103, 318–326. 10.1016/j.carbon.2016.03.007. [DOI] [Google Scholar]
- Fang T.; Chang W.; Yang J. Temperature effect on mechanical properties of graphene sheets under tensile loading. Dig. J. Nanomater. Biostruct. 2012, 7, 1811–1816. [Google Scholar]
- Zhurkov S. N. Kinetic concept of the strength of solids. Int. J. Fract. 1984, 26, 295–307. 10.1007/BF00962961. [DOI] [Google Scholar]
- Qiu H.; Xu T.; Wang Z.; Ren W.; Nan H.; Ni Z.; Chen Q.; Yuan S.; Miao F.; Song F.; Long G.; Shi Y.; Sun L.; Wang J.; Wang X. Hopping transport through defect-induced localized states in molybdenum disulphide. Nat. Commun. 2013, 4, 2642 10.1038/ncomms3642. [DOI] [PubMed] [Google Scholar]
- Hu S.; Chen J.; Yang N.; Li B. Thermal transport in graphene with defect and doping: phonon modes analysis. Carbon 2017, 116, 139–144. 10.1016/j.carbon.2017.01.089. [DOI] [Google Scholar]
- Rosenberger M. R.; Chuang H.-J.; McCreary K. M.; Li C. H.; Jonker B. T. Electrical characterization of discrete defects and impact of defect density on photoluminescence in monolayer WS2. ACS Nano 2018, 12, 1793–1800. 10.1021/acsnano.7b08566. [DOI] [PubMed] [Google Scholar]
- Okada M.; Sawazaki T.; Watanabe K.; Taniguch T.; Hibino H.; Shinohara H.; Kitaura R. Direct chemical vapor deposition growth of WS2 atomic layers on hexagonal boron nitride. ACS Nano 2014, 8, 8273–8277. 10.1021/nn503093k. [DOI] [PubMed] [Google Scholar]
- Gao Y.; Liu Z.; Sun D.-M.; Huang L.; Ma L.-P.; Yin L.-C.; Ma T.; Zhang Z.; Ma X.-L.; Peng L.-M.; Cheng H.-M.; Ren W. Large-area synthesis of high-quality and uniform monolayer WS2 on reusable Au foils. Nat. Commun. 2015, 6, 8569 10.1038/ncomms9569. [DOI] [PMC free article] [PubMed] [Google Scholar]
- Zhou W.; Zou X.; Najmaei S.; Liu Z.; Shi Y.; Kong J.; Lou J.; Ajayan P. M.; Yakobson B. I.; Idrobo J.-C. Intrinsic structural defects in monolayer molybdenum disulfide. Nano Lett. 2013, 13, 2615–2622. 10.1021/nl4007479. [DOI] [PubMed] [Google Scholar]
- Chu K.; Wang J.; Liu Y. P.; Geng Z. R. Graphene defect engineering for optimizing the interface and mechanical properties of graphene/copper composites. Carbon 2018, 140, 112–123. 10.1016/j.carbon.2018.08.004. [DOI] [Google Scholar]
- Kim K.; Nam K. H.; Lee J.; Kim H. J.; Goh M.; Ku B. C.; You N. H. Effect of defect-healing in graphene nanosheets on the mechanical properties of polyimide nanocomposites. Carbon 2017, 122, 614–621. 10.1016/j.carbon.2017.06.102. [DOI] [Google Scholar]
- Gao Y. F.; Jing Y. H.; Liu J. Q.; Li X. C.; Meng Q. Y. Tunable thermal transport properties of graphene by single-vacancy point defect. Appl. Therm. Eng. 2017, 113, 1419–1425. 10.1016/j.applthermaleng.2016.11.160. [DOI] [Google Scholar]
- Tan S. H.; Tang L. M.; Xie Z. X.; Pan C. N.; Chen K. Q. Effect of pentagon-heptagon defect on thermal transport properties in graphene nanoribbons. Carbon 2013, 65, 181–186. 10.1016/j.carbon.2013.08.012. [DOI] [Google Scholar]
- Ansari R.; Ajori S.; Motevalli B. Mechanical properties of defective single-layered graphene sheets via molecular dynamics simulation. Superlattices Microstruct. 2012, 51, 274–289. 10.1016/j.spmi.2011.11.019. [DOI] [Google Scholar]
- Shirazi A. H. N.; Abadi R.; Izadifar M.; Alajlan N.; Rabczuk T. Mechanical responses of pristine and defective C3N nanosheets studied by molecular dynamics simulations. Comput. Mater. Sci. 2018, 147, 316–321. 10.1016/j.commatsci.2018.01.058. [DOI] [Google Scholar]
- Dewapriya M. A. N.; Rajapakse R. K. N. D. Molecular dynamics simulations and continuum modeling of temperature and strain rate dependent fracture strength of graphene with vacancy defects. J. Appl. Mech. 2014, 81, 081010 10.1115/1.4027681. [DOI] [Google Scholar]