Abstract
Response surface methodology was applied to optimize the processing parameters (dosage of NaOH, dosage of H2O2, reaction temperature, liquid-to-solid ratio, stirring rate, and reaction time) that affected the leaching process of vanadium and chromium. The results indicated that the leaching process of vanadium was significantly affected by the dosage of NaOH and dosage of H2O2 used in the experiments, whereas the processing parameters affected the leaching efficiency of chromium in the following order: dosage of H2O2 (F) > reaction temperature (C) > dosage of NaOH (A) > reaction time (B) > stirring rate (D) > liquid-to-solid ratio (E). Almost 98.60% of vanadium and 79.82% of chromium were leached out during the leaching process.
1. Introduction
Vanadium and chromium are important national strategy resources and widely used in petrochemical industry, catalysts, and iron steel because of their excellent physicochemical properties.1−8 To date, many technologies have been applied to leach out vanadium and chromium. Roasting-leaching is a common technology for vanadium extraction. Vanadium in low valence is oxidized to sodium vanadate with the addition of sodium salt in sodium-roasting technology.9 Also, calcium-roasting technology has been applied to overcome some problems associated with sodium-roasting technology, such as the amount of harmful gases like Cl2 and SO2 and agglomeration during roasting process with sodium salts at low melting points. Lime or limestone was added to the slag, and vanadium in low valence was oxidized to CaV2O6, Ca2V2O7, and Ca3V2O8.10−1410−14 The parameters affecting the leaching efficiency of vanadium including the dosage of CaO and roasting temperature and the roasting mechanism have attracted much more attention. Acid leaching technology was applied in leaching out vanadium from stone coal or was coupled with calcium-roasting technologies.15−17 Liquid-phase oxidation technologies including electro-oxidation and submolten salt technology were also used to leach out vanadium.18−22
In many cases, the single-parameter experiment method was applied to investigate the parameters affecting the hydrometallurgical process, in which only one parameter changed and others held constant. In these processes, only the effect of a single processing parameter was investigated, whereas the interactions among different parameters were ignored.23−25 In recent studies,21 the parameters affecting the leaching efficiency of vanadium and chromium including the dosage of NaOH, reaction time, stirring rate, reaction temperature, liquid-to-solid ratio, and dosage of H2O2 from vanadium–chromium residues were studied, whereas the effects of interactions among different parameters were ignored. Moreover, also which was the most significant parameter is still unknown. Response surface methodology (RSM)26−30 is an efficient method that offers a large amount of information from a relatively small number of experiments, allowing the observation of both the effect of the independent variables on the response and their possible interactions. In addition, it has been extensively applied for the optimization study of test parameters and obtained response surfaces. Therefore, the aim of this article was mainly to optimize the leaching conditions of the leaching process of vanadium–chromium residues oxidized with H2O2 in alkaline medium. The optimal leaching conditions were optimized by RSM. The experimental results could provide the technical basis for the hydrometallurgical technologies for leaching of vanadium and chromium.
2. Results and Discussion
2.1. Single-Parameter Experiments
The recent studies21,22 showed that the six processing parameters including the dosage of NaOH, dosage of H2O2, reaction time, reaction temperature, stirring rate, and liquid-to-solid ratio affected the leaching efficiency of vanadium and chromium significantly. Vanadium and chromium could be easily leached out with the addition of H2O2 in alkaline medium.
2.2. Analysis of the Adequacy of the Fitted Model
Experiments were carried out to analyze the effect of processing parameters on the leaching efficiencies of vanadium and chromium. The design points and experimental results are presented in detail in Table S1.
2.2.1. Natural Logarithm Model for the Leaching Efficiency of Vanadium
The natural logarithm model, which was used to express the simulated results, for the leaching efficiency of vanadium after insignificant terms (p-values > 0.1) is presented in eq 1
 |
1 |
The results of the responses for the leaching efficiency of vanadium with analysis of variance are given in detail in Table 1. The F-value and p-value for the model were 7.12 and 0.0005, respectively, which indicated that the model was significant and could be used to describe the optimization process.
Table 1. Analysis of Variance (Results for Vanadium Model)a.
| source | S | Z | mean square | F-value | p-value probability |
|---|---|---|---|---|---|
| model | 32.29 | 27 | 1.1 | 7.12 | 0.0005 |
| residual | 2.02 | 12 | 0.17 | ||
| lack of fit | 1.81 | 7 | 0.26 | 6.33 | 0.0295 |
| pure error | 0.20 | 5 | 0.041 |
R2 = 0.9412, Radj2 = 0.8090, pre-R2 = −9.6804, adequate precision = 12.013.
2.2.2. Square-Root Model for the Leaching Efficiency of Chromium
The square-root model, which was used to express the simulated results, for the leaching efficiency of chromium after insignificant terms (p-values > 0.1) is presented in eq 2
 |
2 |
The results for chromium are given in detail in Table 2. The F-value for the model was 68.59. The corresponding p-value for the model was < 0.0001, which indicated that the model was significant and could be used to describe the optimization process.
Table 2. Analysis of Variance (Results for Chromium Model)a.
| source | S | Z | mean square | F-value | p-value probability |
|---|---|---|---|---|---|
| model | 127.24 | 27 | 4.71 | 68.59 | <0.0001 |
| residual | 0.82 | 12 | 0.069 | ||
| lack of fit | 0.41 | 7 | 0.058 | 0.69 | 0.6830 |
| pure error | 0.42 | 5 | 0.084 |
R2 = 0.9936, Radj2 = 0.9791, pre-R2 = 0.5136, adequate precision = 29.068.
2.3. Response Surfaces and Contour Plots
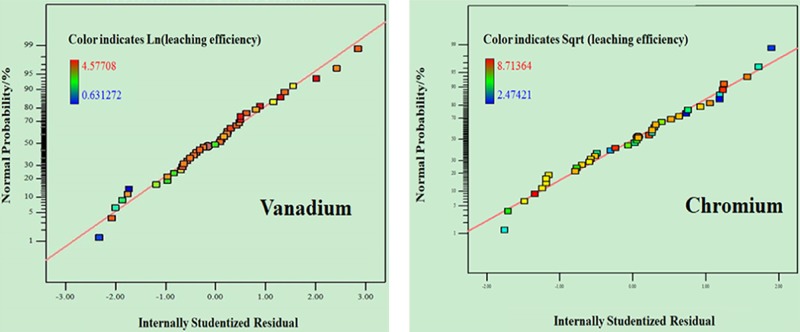
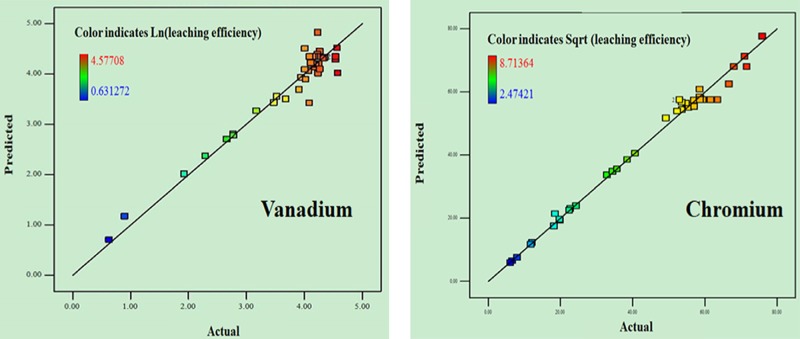
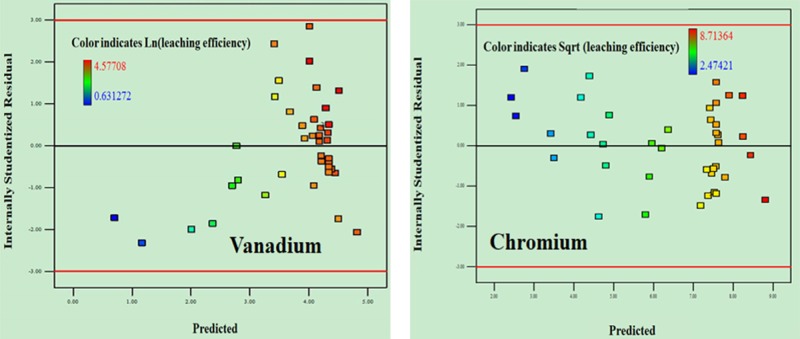
It could be seen from Figure 1 that the internally studentized residuals were almost in a straight line, which indicated that the normal probability was in a normal distribution. Also, the leaching efficiency of vanadium was more stable than that of chromium. The predicted results versus actual results are plotted in Figure 2. It was shown that the predicted leaching efficiency of chromium was more in agreement with the actual results than that of the leaching efficiency of vanadium. This also meant that the simulated model was valid and could be used to predict the actual results. Figure 3 shows the plot of the internally studentized residual responses versus the predicted responses; the internally studentized residual responses were random and had no obvious regulation. This indicated that the actual results were dependent on the processing parameters.
Figure 1.
Plot of normal probability vs the internally studentized residuals.
Figure 2.
Predicted responses vs the actual values.
Figure 3.
Internally studentized residuals vs the predicted responses.
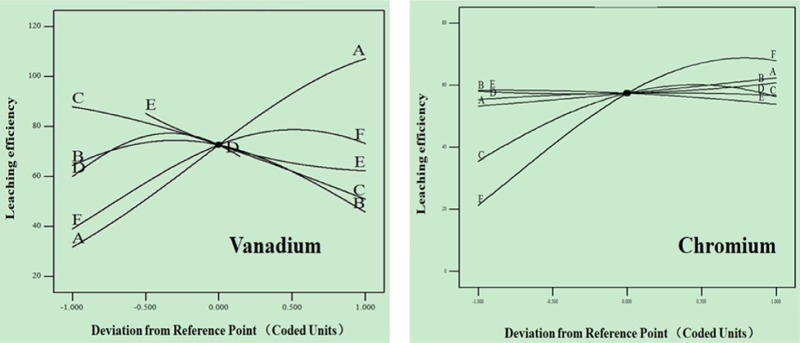
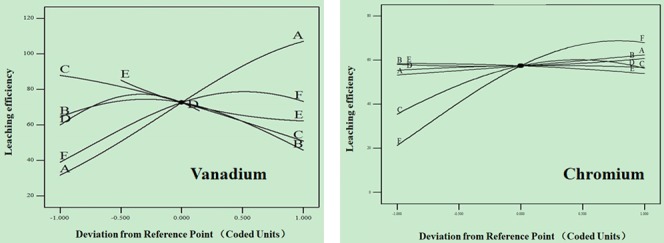
The perturbation plot in Figure 4 shows a comparison of all of the processing parameters. The leaching efficiency response results were drawn by changing only one processing parameter over its range while keeping the other processing parameters constant. For the leaching process of vanadium, the influence of processing parameters on the obtained leaching efficiency response followed the order: dosage of NaOH (A) > dosage of H2O2 (F) > reaction temperature (C) > liquid-to-solid ratio (E) > stirring rate (D) > reaction time (B). The comparatively sharp line of dosage of NaOH significantly affected the leaching efficiency. Note that the coefficient of the dosage of NaOH in eq 2 is extremely high. The increase of NaOH increased the reaction activity of the hydroxide ions and enabled the oxidation reactions to be thermodynamically more favorable.21 It also intensified the oxidation solubility and mass transfer efficiency during the leaching process. eq 2 and the perturbation plot show that the reaction time and stirring rate exhibited parabola effects. The leaching efficiency increased linearly with the increase of the dosage of NaOH and dosage of H2O2 in the chosen design space.
Figure 4.
Perturbation plot for the leaching efficiencies of vanadium and chromium (A: dosage of NaOH; B: dosage of H2O2; C reaction time; D: reaction temperature; E: stirring rate; and F: liquid-to-solid ratio).
While taking the leaching process of chromium into account, the influence of processing parameters on the obtained leaching efficiency response followed the order: dosage of H2O2 (F) > reaction temperature (C) > dosage of NaOH (A) > reaction time (B) > stirring rate (D) > liquid-to-solid ratio (E). The dosage of H2O2 (F) significantly affected the leaching efficiency of chromium, and the reaction temperature (C) exhibited curvature effects, whereas other parameters had no significant effects. The leaching efficiency of chromium was significantly affected by the dosage of H2O2,21,2221,22 whereas it was hardly leached out in alkaline leaching without H2O2.3131 In other words, the leaching process of chromium was dependent on the addition of H2O2.
Three-dimensional plots were applied to investigate the interaction among processing parameters. In such plots, two processing parameters were changed while keeping the other four processing parameters constant. The results given in detail in Figures S1–S8 show that the leaching efficiency of vanadium was increased with the increasing dosage of NaOH. Moreover, the leaching efficiency of chromium was significantly affected by the dosage of NaOH and dosage of H2O2.
2.4. Optimization of Leaching Parameters and the Model Validation
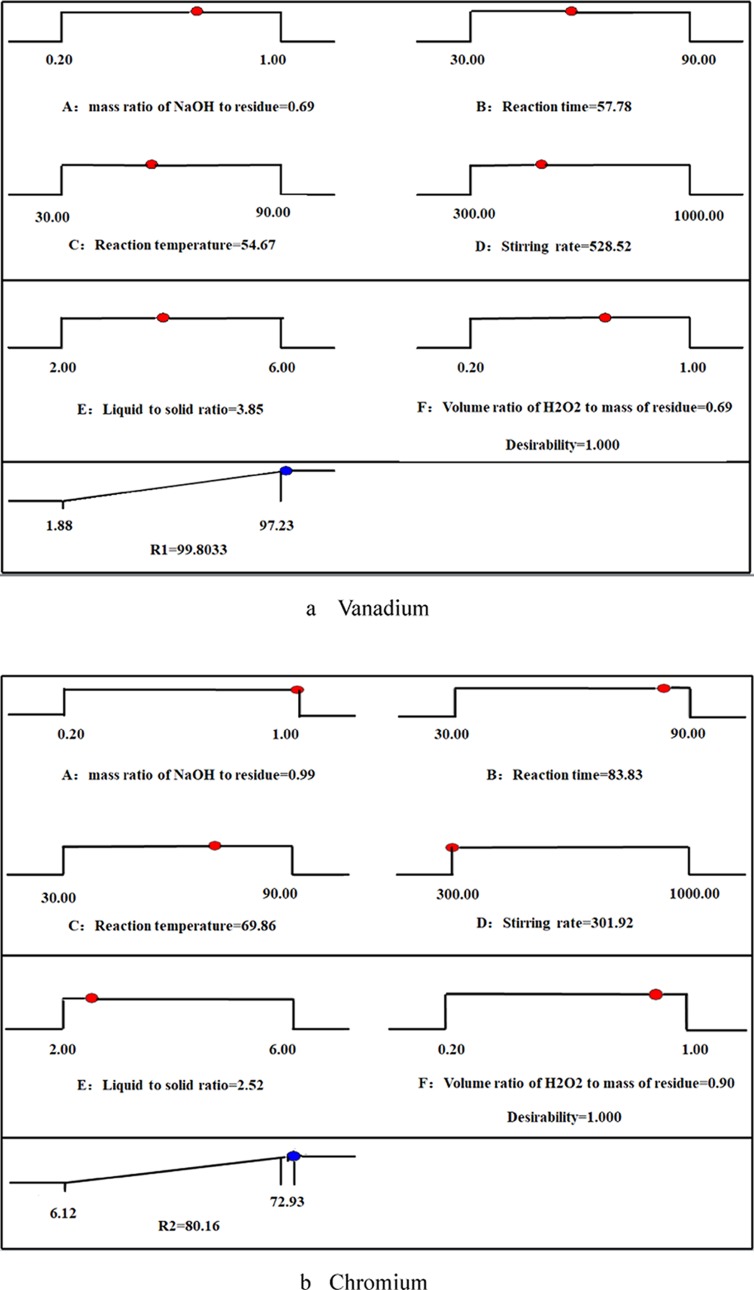
The effects of a single parameter and interaction among parameters were discussed above. The optimal leaching conditions were also investigated. Optimum conditions were obtained when all of the processing parameters were selected “within the range” and the leaching efficiency of vanadium or chromium was maximum. The processing parameters and related responses are given in detail in Table 3 and Figure 5. The selected optimum conditions with a desirability value of 1.000 were predicted to reach 99.80 and 80.16% for the leaching efficiencies of vanadium and chromium, respectively. In Table 3, the results showed great agreement between the simulated predicted results and experimental results, which confirmed the validity of the model in simulating the leaching process of vanadium and chromium from vanadium–chromium residues.
Table 3. Actual and Predicted Results under the Optimum Conditions Predicted via RSM.
| optimum conditions |
leaching
efficiency/% |
|||||||
|---|---|---|---|---|---|---|---|---|
| mNaOH/mresidue | VH2O2/mresidue | reaction time/min | reaction temperature/°C | stirring rate/rpm | liquid-to-solid-mass ratio | actual | predicted | |
| vanadium | 0.70 | 0.70 | 60 | 60 | 550 | 4 | 98.60 | 99.80 |
| chromium | 1.00 | 0.90 | 84 | 70 | 300 | 2.50 | 79.82 | 80.16 |
Figure 5.
Desirability ramp for numerical optimization.
3. Conclusions
In this study, the effects of six processing parameters (dosage of NaOH, dosage of H2O2, reaction temperature, liquid-to-solid ratio, stirring rate, and reaction time) on the leaching efficiencies of vanadium and chromium from vanadium–chromium residues were studied. The optimal processing parameters were obtained from RSM.
-
(1)
The leaching efficiency of vanadium was significantly affected by the dosage of NaOH and dosage of H2O2 during the experiments. The leaching efficiency of vanadium was up to 98.60% at optimum technological parameters: dosage of NaOH of 0.70 g/g, dosage of H2O2 of 0.70 mL/g, reaction time of 60 min, reaction temperature of 60 °C, stirring rate of 550 rpm, and liquid-to-solid ratio of 4 mL/g.
-
(2)
The optimal processing parameters were obtained from RSM, and the influence of processing parameters on the obtained rate response followed the order: dosage of H2O2 (F) > reaction temperature (C) > dosage of NaOH (A) > reaction time (B) > stirring rate (D) > liquid-to-solid ratio (E). Under the optimal conditions, the leaching efficiency of chromium was 79.82%: dosage of NaOH of 0.99 g/g, dosage of H2O2 of 0.90 mL/g, reaction time of 84 min, reaction temperature of 70 °C, stirring rate of 300 rpm, and liquid-to-solid ratio of 2.5 mL/g.
4. Experimental Section
4.1. Materials
The vanadium–chromium residue was collected from Pangang Group Co., Ltd., Chengdu, China. Also, it was precipitated from waste water containing vanadium and chromium in low valence from an iron and steel mill. The residue was dried and ground to fine particles before experiments. The chemical composition of the residue is given in detail in the references.21
4.2. Experimental Procedure
All experiments were conducted in a thermostatic mixing water bath pot. Before the experiments, a predetermined concentration of NaOH solution was added to the beaker, and then the residue was added as the appropriate temperature was reached. Then, H2O2 was manually added. The leachate was obtained by vacuum filtration after a required time. The detailed processes can be seen in the refs21, 22, 31. The concentrations of vanadium and chromium in the filtrate were determined by inductively coupled plasma-optical emission spectrometry.18,32−34 The leaching efficiencies of vanadium (ηV) and chromium (ηCr) are calculated in eqs 3 and 4, respectively, as follows
| 3 |
| 4 |
where CV and CCr are the concentrations (g/L) of vanadium and chromium in the filtrate, respectively; V is the volume (mL) of the leachate; ωV and ωCr are the mass fractions of vanadium and chromium in the residue, respectively; and m (g) is the mass of the vanadium–chromium residue used in the leaching experiments.
4.3. Experimental Optimization
The experiment design and optimization methods were according to the reference.23 Central composite design (CCD) was applied to analyze the effect of processing parameters on the leaching efficiencies of vanadium and chromium from the vanadium–chromium residue. The operation processing parameters included the dosage of NaOH, dosage of H2O2, reaction time, reaction temperature, stirring rate, and liquid-to-solid ratio. The actual values for each processing parameter are given in detail in Table 4.
Table 4. Actual Values of Process Variables.
| level |
||||
|---|---|---|---|---|
| variable | unit | –1 | 0 | 1 |
| A: mNaOH/mresidue | g/g | 0.2 | 0.6 | 1.0 |
| B: reaction time | min | 30 | 60 | 90 |
| C: reaction temperature | °C | 30 | 60 | 90 |
| D: stirring rate | rpm | 300 | 500 | 700 |
| E: liquid-to-solid-mass ratio | mL/g | 3 | 4 | 6 |
| F: VH2O2/mresidue | mL/g | 0.2 | 0.6 | 1.0 |
Acknowledgments
This work was supported by the Chongqing Science and Technology Commission (CN) (No. cstc2018jcyjAX0018), the National Natural Science Foundation of China (No. 21576033), and the Talent Introduction Project of Yangtze Normal University (No. 2017KYQD117).
Supporting Information Available
The Supporting Information is available free of charge on the ACS Publications website at DOI: 10.1021/acsomega.8b02708.
CCD experimental matrix and experimental results for this study (Table S1); response surface plots for factors (A to B, C, D, and E) (Figure S1); response surface plots for factors (B to C, D, E, and F) (Figure S2); response surface plots for factors (A to F and C to D, E, and F) (Figure S3); response surface plots for factors (D to E, F and E to F) (Figure S4); response surface plots for factors (A to B, C, D, and E) (Figure S5); response surface plots for factors (B to C, D, E, and F) (Figure S6); response surface plots for factors (A to F and C to D, E, and F) (Figure S7); response surface plots for factors (D to E, F and E to F) (Figure S8) (PDF)
The authors declare no competing financial interest.
Supplementary Material
References
- Nicholas N. J.; da Silva G.; Kentish S.; Stevens G. W. Use of Vanadium(V) Oxide as a Catalyst for CO2 Hydration in Potassium Carbonate Systems. Ind. Eng. Chem. Res. 2014, 53, 3029–3039. 10.1021/ie403836e. [DOI] [Google Scholar]
- Leiviskä T.; Matusik J.; Muir B.; Tanskanen J. Vanadium removal by organo-zeolites and iron-based products from contaminated natural water. J. Cleaner Prod. 2017, 167, 589–600. 10.1016/j.jclepro.2017.08.209. [DOI] [Google Scholar]
- Moskalyk R. R.; Alfantazi A. M. Processing of vanadium: a review. Miner. Eng. 2003, 16, 793–805. 10.1016/S0892-6875(03)00213-9. [DOI] [Google Scholar]
- Pet’kov V. I.; Sukhanov M. V.; Shipilov A. S.; Kurazhkovskaya V. S.; Borovikova E. Y.; Sakharov N. V.; Ermilova M. M.; Orekhova N. V. Synthesis and structure of alkali metal zirconium vanadate phosphates. Russ. J. Inorg. Chem. 2013, 58, 1015–1021. 10.1134/S0036023613090167. [DOI] [Google Scholar]
- Peng H.; Liu Z.; Tao C. Chaotic Phenomenon in Vanadium Redox Flow Battery. Int. J. Petrochem. Sci. Eng. 2017, 2, 48. 10.15406/ipcse.2017.02.00031. [DOI] [Google Scholar]
- Peng H.; Liu Z.; Tao C. Adsorption Process of Vanadium (V) with Melamine. Water, Air, Soil Pollut. 2017, 228, 272. 10.1007/s11270-017-3452-z. [DOI] [Google Scholar]
- Peng H.; Liu Z.; Tao C. Adsorption kinetics and isotherm of vanadium with melamine. Water Sci. Technol. 2017, 75, 2316–2321. 10.2166/wst.2017.094. [DOI] [PubMed] [Google Scholar]
- Peng H.; Liu Z.; Tao C. Electrochemical oscillation of vanadium ions in anolyte. J. Electrochem. Sci. Eng. 2017, 7, 139. 10.5599/jese.406. [DOI] [Google Scholar]
- Wen J.; Jiang T.; Xu Y.; Cao J.; Xue X. Efficient extraction and separation of vanadium and chromium in high chromium vanadium slag by sodium salt roasting-(NH4)2SO4 leaching. J. Ind. Eng. Chem. 2018, 10.1016/j.jiec.2018.11.043. [DOI] [Google Scholar]
- Wen J.; Jiang T.; Zhou M.; Gao H.; Liu J.; Xue X. Roasting and leaching behaviors of vanadium and chromium in calcification roasting–acid leaching of high-chromium vanadium slag. Int. J. Miner., Metall. Mater. 2018, 25, 515–526. 10.1007/s12613-018-1598-3. [DOI] [Google Scholar]
- Jiang T.; Wen J.; Zhou M.; Xue X. Phase evolutions, microstructure and reaction mechanism during calcification roasting of high chromium vanadium slag. J. Alloys Compd. 2018, 742, 402–412. 10.1016/j.jallcom.2018.01.201. [DOI] [Google Scholar]
- Gao H.; Jiang T.; Xu Y.; Wen J.; Xue X. Change in phase, microstructure, and physical-chemistry properties of high chromium vanadium slag during microwave calcification-roasting process. Powder Technol. 2018, 340, 520–527. 10.1016/j.powtec.2018.09.045. [DOI] [Google Scholar]
- Gao H.; Jiang T.; Zhou M.; Wen J.; Li X.; Wang Y.; Xue X. Effect of microwave irradiation and conventional calcification roasting with calcium hydroxide on the extraction of vanadium and chromium from high-chromium vanadium slag. Int. J. Miner. Process. 2017, 10.1016/j.minpro.2017.12.001. [DOI] [Google Scholar]
- Yang Q.-w.; Xie Z.-m.; Peng H.; Liu Z.-h.; Tao C.-y. Leaching of vanadium and chromium from converter vanadium slag intensified with surface wettability. J. Cent. South Univ. 2018, 25, 1317–1325. 10.1007/s11771-018-3828-2. [DOI] [Google Scholar]
- Xue N.; Zhang Y.; Huang J.; Liu T.; Wang L. Separation of impurities aluminum and iron during pressure acid leaching of vanadium from stone coal. J. Cleaner Prod. 2017, 166, 1265–1273. 10.1016/j.jclepro.2017.08.144. [DOI] [Google Scholar]
- Zhang H.; Xu H.; Zhang X.; Zhang Y.; Zhang Y. Pressure oxidative leaching of Indian chromite ore in concentrated NaOH solution. Hydrometallurgy 2014, 142, 47–55. 10.1016/j.hydromet.2013.10.016. [DOI] [Google Scholar]
- Dorfling C.; Akdogan G.; Bradshaw S. M.; Eksteen J. J. Modelling of an autoclave used for high pressure sulphuric acid/oxygen leaching of first stage leach residue. Part 1: Model development. Miner. Eng. 2013, 53, 220–227. 10.1016/j.mineng.2013.03.005. [DOI] [Google Scholar]
- Xue Y.; Zheng S.; Sun Z.; Zhang Y.; Jin W. Alkaline electrochemical advanced oxidation process for chromium oxidation at graphitized multi-walled carbon nanotubes. Chemosphere 2017, 183, 156–163. 10.1016/j.chemosphere.2017.05.115. [DOI] [PubMed] [Google Scholar]
- Xue Y.; Zheng S.; Du H.; Zhang Y.; Jin W. Cr(III)-induced electrochemical advanced oxidation processes for the V 2 O 3 dissolution in alkaline media. Chem. Eng. J. 2017, 307, 518–525. 10.1016/j.cej.2016.08.115. [DOI] [Google Scholar]
- Jing X.; Wang J.; Cao H.; Ning P.; Wang Q. Extraction of V(V) and Cr(VI) from aqueous solution using primary amine extractants: extraction mechanism and oxidation of extractants. Chem. Pap. 2018, 72, 109–118. 10.1007/s11696-017-0262-0. [DOI] [Google Scholar]
- Peng H.; Liu Z.; Tao C. A green method to leach vanadium and chromium from residue using NaOH-H2O2. Sci. Rep. 2018, 8, 426 10.1038/s41598-017-18918-2. [DOI] [PMC free article] [PubMed] [Google Scholar]
- Peng H.; Liu Z.; Tao C. Leaching Kinetics of Vanadium with Electro-oxidation and H2O2 in Alkaline Medium. Energy Fuels 2016, 30, 7802–7807. 10.1021/acs.energyfuels.6b01364. [DOI] [Google Scholar]
- Zhang X.; Liu Z.; Fan X.; Lian X.; Tao C. Optimization of reaction conditions for the electroleaching of manganese from low-grade pyrolusite. Int. J. Miner., Metall. Mater. 2015, 22, 1121–1130. 10.1007/s12613-015-1176-x. [DOI] [Google Scholar]
- Zhang G.; Chen D.; Zhao W.; Zhao H.; Wang L.; Li D.; Qi T. A novel synergistic extraction method for recovering vanadium (V) from high-acidity chloride leaching liquor. Sep. Purif. Technol. 2016, 165, 166–172. 10.1016/j.seppur.2016.04.008. [DOI] [Google Scholar]
- Yu K.; Chen B.; Zhang H.; Zhu G.; Xu H.; Zhang Y. An efficient method of chromium extraction from chromium-containing slag with a high silicon content. Hydrometallurgy 2016, 162, 86–93. 10.1016/j.hydromet.2016.02.020. [DOI] [Google Scholar]
- Yuan Y.; Tan L.; Xu Y.; Dong J.; Zhao Y.; Yuan Y. Optimization of Processing Parameters for Lettuce Vacuum Osmotic Dehydration Using Response Surface Methodology. Pol. J. Food Nutr. Sci. 2018, 68, 15–23. 10.1515/pjfns-2017-0013. [DOI] [Google Scholar]
- de Souza L. P. d; Faroni L. R. D. A.; Heleno F. F.; Pinto F. G.; Queiroz M. E. L. R. d; Prates L. H. F. Ozone treatment for pesticide removal from carrots: Optimization by response surface methodology. Food Chem. 2018, 243, 435–441. 10.1016/j.foodchem.2017.09.134. [DOI] [PubMed] [Google Scholar]
- Souza L. P.; Faroni L. R. D.; Heleno F. F.; Pinto F. G.; Queiroz M.; Prates L. H. F. Ozone treatment for pesticide removal from carrots: Optimization by response surface methodology. Food Chem. 2018, 243, 435–441. 10.1016/j.foodchem.2017.09.134. [DOI] [PubMed] [Google Scholar]
- Şimşek B.; Uygunoğlu T.; Korucu H.; Kocakerim M. M. Analysis of the effects of dioctyl terephthalate obtained from polyethylene terephthalate wastes on concrete mortar: A response surface methodology based desirability function approach application. J. Cleaner Prod. 2018, 170, 437–445. 10.1016/j.jclepro.2017.09.176. [DOI] [Google Scholar]
- Yang H.; Xu X.; Neumann I. Optimal finite element model with response surface methodology for concrete structures based on Terrestrial Laser Scanning technology. Compos. Struct. 2018, 183, 2–6. 10.1016/j.compstruct.2016.11.012. [DOI] [Google Scholar]
- Peng H.; Liu Z.; Tao C. Selective leaching of vanadium from chromium residue intensified by electric field. J. Environ. Chem. Eng. 2015, 3, 1252–1257. 10.1016/j.jece.2015.03.031. [DOI] [Google Scholar]
- Li M.; Zheng S.; Liu B.; Wang S.; Dreisinger D. B.; Zhang Y.; Du H.; Zhang Y. A Clean and Efficient Method for Recovery of Vanadium from Vanadium Slag: Nonsalt Roasting and Ammonium Carbonate Leaching Processes. Miner. Process. Extr. Metall. Rev. 2017, 38, 228–237. 10.1080/08827508.2017.1288117. [DOI] [Google Scholar]
- Li M.; Liu B.; Zheng S.; Wang S.; Du H.; Dreisinger D. B.; Zhang Y. A cleaner vanadium extraction method featuring non-salt roasting and ammonium bicarbonate leaching. J. Cleaner Prod. 2017, 149, 206–217. 10.1016/j.jclepro.2017.02.093. [DOI] [Google Scholar]
- Li M.; Du H.; Zheng S.; Wang S.; Zhang Y.; Liu B.; Dreisinger D. B.; Zhang Y. Extraction of Vanadium from Vanadium Slag Via Non-salt Roasting and Ammonium Oxalate Leaching. JOM 2017, 69, 1970–1975. 10.1007/s11837-017-2494-4. [DOI] [Google Scholar]
Associated Data
This section collects any data citations, data availability statements, or supplementary materials included in this article.


