Abstract
Amyloid beta (Aβ) peptides are characterized as the major factors associated with neuron death in Alzheimer’s disease, which is listed as the most common form of neurodegeneration. Disordered Aβ peptides are released from proteolysis of the amyloid precursor protein. The Aβ self-assembly process roughly takes place via five steps: disordered forms → oligomers → photofibrils → mature fibrils → plaques. Although Aβ fibrils are often observed in patient brains, oligomers were recently indicated to be major neurotoxic elements. In this work, the neurotoxic compound S-shape Aβ11–42 tetramer (S4Aβ11–42) was investigated over 10 μs of unbiased MD simulations. In particular, the S4Aβ11–42 oligomer adopted a high dynamics structure, resulting in unsuccessful determination of their structures in experiments. The C-terminal was suggested as the possible nucleation of the Aβ42 aggregation. The sequences 27–35 and 39–40 formed rich β-content, whereas other residues mostly adopted coil structures. The mean value of the β-content over the equilibrium interval is ∼42 ± 3%. Furthermore, the dissociation free energy of the S4Aβ11–42 peptide was predicted using a biased sampling method. The obtained free energy is ΔGUS = −58.44 kcal/mol which is roughly the same level as the corresponding value of the U-shape Aβ17-42 peptide. We anticipate that the obtained S4Aβ11–42 structures could be used as targets for AD inhibitor screening over the in silico study.
Introduction
Alzheimer’s disease (AD) is known as common dementia, affecting more than 40 million people worldwide.1 AD patients lose cognition and memory slowly for more than 20 years before the symptoms are clarified.2,3 Among several hypotheses which have been proposed to explain the mechanism of AD, the amyloid cascade hypothesis emerges as one of the most probable ones. In particular, AD is associated with the aspect of Amyloid beta (Aβ) oligomers.4,5 Thus, understanding the structure of Aβ oligomers at the atomic level might enhance AD therapy.6,7 Unfortunately, it is very hard to identify structural details of oligomers in experiments because they exist transiently.8 Computational investigations thus emerged as a highly appropriate method to resolve these problems.9,10
Missing knowledge of the stable structures of Aβ oligomers has hindered their functional studies,11,12 resulting in unsuccessful designing of inhibitors for Aβ oligomers to date. In the case of distinguished Aβ oligomers, it is popularly argued that the β-strand content is related to neurotoxicity.13 Promising inhibitors for the Aβ oligomerization mostly focus on preventing the β-structure.14,15 Although these compounds are able to inhibit Aβ oligomerization in both experimental and computational studies,16 the number of available drugs is negligible unfortunately.17 Moreover, some compounds, which are able to enhance the self-assembly rate of Aβ peptides, have also been used as potential inhibitors.18,19 If the lag phase time of Aβ oligomerization is decreased, the oligomeric period would thus be reduced. However, efficient compounds are still obstacles despite much effort over recent years.5,19
It is known that the self-aggregation of Aβ peptides strongly rely upon their sequences and fragment sizes.20,21 Mutations are able to change the structure and kinetics of Aβ oligomers such as A2T,22 A2V,22 D7N,23 F19W,24 A21G,25 E22G,26 E22Q,27,28 E22K,26 and D23N29,30 mutations. The familial mutations attract several investigations due to their influence on AD patients. Moreover, the chain length absolutely alters the self-assembly rate and kinetics of Aβ peptides. The fibrillation time of the more common Aβ40 peptide is significantly larger than that of the Aβ42 peptide,31 although there are two residue differences only.6 However, it is very hard to characterize the structural information of Aβ42 oligomers in solution,8,32 because the more toxic Aβ42 oligomers are more unstable than the Aβ40 ones.32 Furthermore, the lag phase of the Aβ peptide also depends on the order/weight of the oligomer.21,33 The higher-order oligomer requires a larger self-aggregation time.33
In addition, due to the fact that Aβ trimers and tetramers are the highest cytotoxicity forms of low-weight oligomers,34 many investigations were implemented to understand the structural information of Aβ trimers.30,35−38 However, detailed information of Aβ tetramers is still limited, especially the structural details of Aβ42 tetramers because these oligomers are highly dynamic compounds.32 Despite efforts to mimic the formation of the solvated Aβ1-42 tetramer starting from Aβ1-42 monomers using discrete MD simulations,39 the β-content of the obtained Aβ1-42 tetramer (<18%) was found to be significantly lower than the experimental observations.40 Moreover, the Aβ1-42 tetramer with the appropriate amount of β-content (34 ± 5%) was also formed from 4 Aβ1-42 monomers using MD simulations,41 but it is hard to explain the elongation of Aβ photofibrils based on the morphology of the obtained Aβ1-42 tetramer, which is considered as subunits constructing the fibrils.31,42−44 Therefore, an investigation for the formation of the Aβ tetramer emerges as an urgent task, in which the obtained structures would satisfy critical conditions such as adopting appropriate oligomeric size, suitable secondary structures, and the ability to be used as subunits for elongating photofibrils.
In this work, we have simulated Aβ11–42 tetramer starting from the fibril-like S-shape structure (S4Aβ11–42) over 10 μs of MD simulations to understand the structural change of this compound in solution. The representative shapes of the S4Aβ11–42 peptide are obtained using a combination of the collective-variable free energy landscape (FEL) and clustering methods according to previous works.30,45 The secondary structure change of the peptide was monitored every 10 ps employing the dictionary of protein secondary structure (DSSP) protocol.46 The oligomer size fluctuation was observed over the radius of gyration, collision cross section (CCS), and solvent surface accessible area (SASA) calculations. The obtained results would enhance the understanding of the Aβ self-aggregation.
Results and Discussion
Selected Initial Conformation of the Aβ Tetramer
Aβ oligomers are probable establishing blocks for generating photofibrils and/or mature fibrils.10,47 It may be argued that the shapes of Aβ oligomers might be collected from the simulations, whereas the initial structures are able to be a random coil39,41 or a fibril-like structure.10,48 There is a prohibition of CPU time consumption for simulating the disordered protein which is started from a random structure initially.10 Moreover, although the disordered domain with a sequence of 1–10 was found to be able to alter the self-aggregation of Aβ oligomers,22,23 these effects are insignificant in comparison with those of the hydrophobic domains. The sequence has frequently not been included in previous studies.49−52 Inconsideration of the disordered domain also provides the advantage that the CPU time consumption would reduce.30 Furthermore, the Aβ peptides normally adopt monomorphic,52 two-fold,53,54 and three-fold structures.55 However, the computational study of the two-fold and three-fold shapes would be much more time consuming because of extremely increasing the degree of freedom in comparison with the monomorphic system. Therefore, a fibril-like structure of the Aβ11–42 peptide with a monomorphic conformation would be selected as the initial structure of a long time scale MD simulation, which is known to be able to appropriately sample the conformation of the Aβ peptide.56 Here, the S-shape model52 was chosen as the investigated model instead of the U-shape model.57 The initial shape of S-shape Aβ11–42 is shown in Figure 1.
Figure 1.
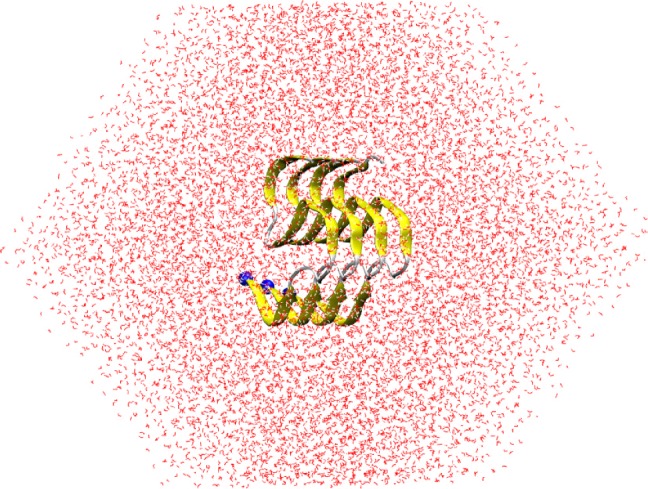
Initial conformation of the S4Aβ11–42 peptide, which was extracted from the S-shape Aβ11–42 fibril with PDB ID 2MXU.52 The blue spheres were employed to note the N-terminus.
All-Atom Molecular Dynamics Simulation
A long time conventional MD simulation would provide details of both dynamics and kinetics of the Aβ self-aggregation process. During the simulations, the tetramer significantly adopts the structural changes over the first 4 μs of MD simulation until reaching a stable point (Figure S1 of the Supporting Information). The convergence of simulations was guaranteed according the superposition of the calculated metrics over various simulation time intervals (Figure S2). The structural analyses were thus performed over the time interval 4–10 μs of MD simulations. During the equilibrium interval, the Cα atomic fluctuations (Figure S3 of the Supporting Information file) indicated that the sequences 15–20 and 24–37 are rigidly stable during simulation with a Cα RMSF of approximately 0.14 nm, while sequences 11–14, 21–23, and 38–42 change with a Cα RMSF ranging from 0.20 to 0.5 nm. The obtained results are in good agreement with the secondary structure analysis in the next subsection. The C-terminal is more important than the N-terminal stabilizing the S4Aβ11–42 oligomer. It implies that the C-terminal enables possible nucleation of the S4Aβ11–42 self-assembly instead of the N-terminal, which controls the aggregation of the 3Aβ11-40 peptide.10 Furthermore, it may be argued that available inhibitors for the Aβ40 peptide would have less effect on the Aβ42 peptides because these compounds favorably bind to the N-terminal.30
In addition, the dynamics of the S4Aβ11–42 peptide was a probable interpretation through monitoring the system size and intermolecular interactions between the constituting chains (Figure 2). The obtained size of the S4Aβ11–42 peptide is appropriate when compared with other oligomers. In particular, the radius of gyration (Rg) of the S4Aβ11–42 system was computed with a mean value of 1.46 ± 0.03 nm, which is significantly smaller than that of the 4Aβ1-42 peptide in solution (∼1.6 ± 1 nm).41 The smaller Rg of the S4Aβ11–42 peptide is probably caused by the shorter of the sequence. However, interestingly, the Rg value of S4Aβ11–42 is slightly smaller than that of D23N 3Aβ11-40 (∼1.49 ± 0.05 nm),30 although the trimeric system has inevitably fewer number of residues. Moreover, the Rg value of S4Aβ11–42 spreads out in the larger range (from 1.38 to 1.78 nm) in comparison with the D23N 3Aβ11-40 oligomer (from 1.28 to 1.64 nm). The results imply that the S4Aβ11–42 peptide is more flexible than the D23N 3Aβ11-40 peptide. On the other hand, the size of the oligomer is also described through the CCS and SASA values. These amounts propagate in the large ranges of 14.80–17.60 nm2 and 68.50–87.50 nm2, respectively. The corresponding mean values are 16.06 ± 0.32 nm2 and 77.23 ± 2.26 nm2, respectively. The CCS value of the S4Aβ11–42 peptide is smaller than that of the helical transmembrane Aβ11–42 tetramer (4tmαAβ11–42), which was measured to be 17.64 ± 0.97 nm2.58 Moreover, both CCS and SASA values are significantly larger than that of Aβ11-40 trimers (3Aβ11-40),10,24,30 although these radii of gyration were approximately equaled. In addition, the number of intermolecular sidechain contact (SC) between constituting chains of the S4Aβ11–42 oligomer during the last 6 μs of MD simulations was counted as 54.98 ± 1.91 that metric was recorded in the range from 46.50 to 63.00. Overall, the high fluctuations of Rg, CCS, SASA, and number of SC implied the high dynamics of the S4Aβ11–42 system according to the previous observation.32
Figure 2.
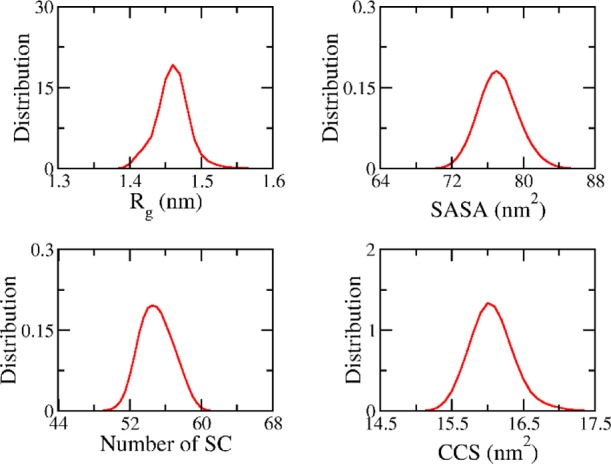
Computed metrics of the S4Aβ11–42 peptide. Collected metrics were obtained over interval 4–10 μs of MD simulations.
Secondary Structure of the S4Aβ11–42
Secondary structures are important metrics characterizing physical and structural properties of Aβ systems. Normally, the β-content of Aβ peptides is supposedly related to the neurotoxicity of the oligomers because the value is characterizing the self-assembly of Aβ peptides.32 The secondary structure changes were monitored employing the DSSP protocol over the time interval 4–10 μs of MD simulations.46 The obtained distributions of the secondary structure values are mentioned in Figure 3. In particular, the β-content of the S4Aβ11–42 peptide spreads out in the range of 24–55% with an average value of 42 ± 3%. The coil content fluctuates in the range of 37–70% with a mean amount of 51 ± 3%. The α-content is the smallest amount in comparison with the other secondary structure terms with the average amount of 3 ± 2%. The turn content is approximately measured as 5 ± 2%.
Figure 3.
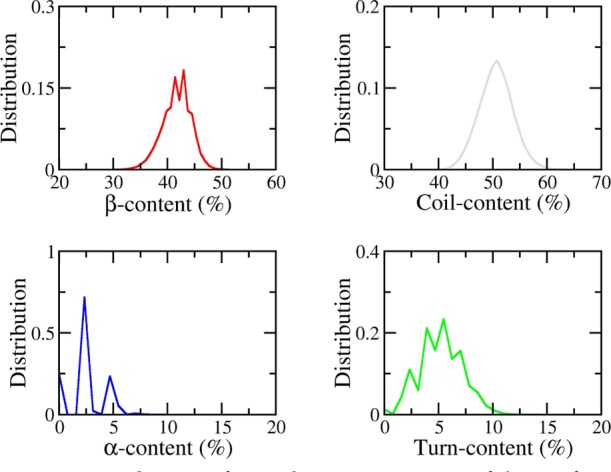
Distributions of secondary structure terms of the S4Aβ11–42 peptide over the last 6 μs of MD simulations.
The secondary structure terms per residues of the S4Aβ11–42 peptide were averaged over 600 000 MD snapshots and are presented in Figure 4. The S4Aβ11–42 system adopts a rigid β-content in the C-terminal (especially in the sequences 27–35 and 39–40). Other residues mostly form the coil structure implying that the S4Aβ11–42 peptide is highly flexible, which is in good concurrence with the previous experiment.32 Secondary structure allocation is in good agreement with the previous studies of the Aβ1-42 monomer, dimer, and pentamer.59−61 On the other hand, the S4Aβ11–42 peptide plays a different role in comparison to the 3Aβ11-40 oligomer, which forms a richer β-content in the N-terminal.10 Especially, the hydrophobic domain of the N-terminal (sequence 17–21) of the S4Aβ11–42 oligomer forms less than 50% of the β-content for each residue in comparison with the corresponding value ∼90% of the U-shape 3Aβ11-40 peptide.30 It may be argued that the C-terminal acts as the possible nucleation of Aβ42 fibrils instead of the N-terminal does in the Aβ40 peptide.10
Figure 4.
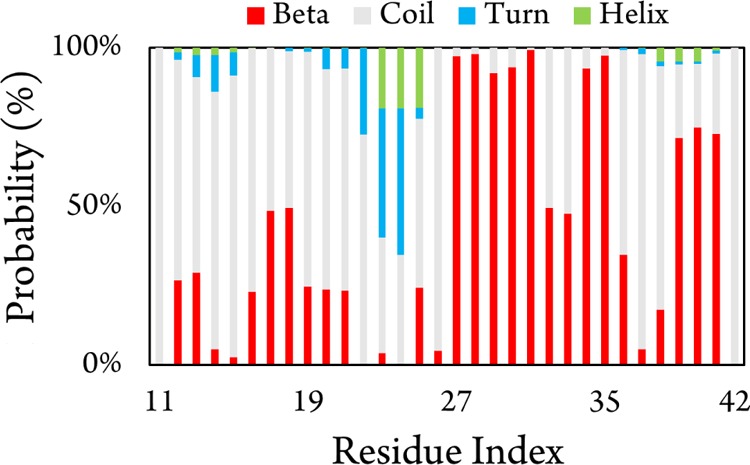
Secondary structure terms per residues of the S4Aβ11–42 peptide over time interval 4–10 μs of MD simulations.
Representative Structures of the S4Aβ11–42 Peptides
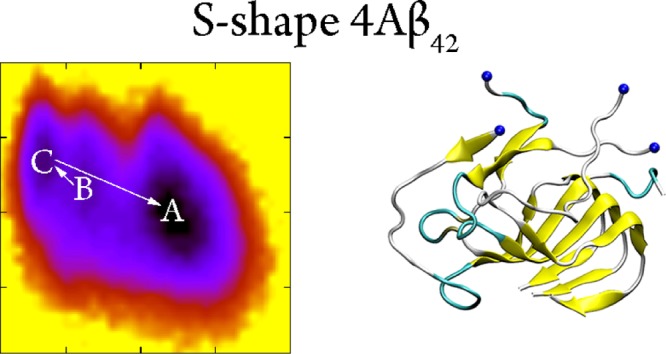
A combination of the FEL and clustering methods was employed to find the appropriately representative conformations of the S4Aβ11–42 peptide.45 As mentioned below, the collective variable FEL was constructed using the backbone root-mean square deviation (rmsd) and intermolecular SC as the two reaction coordinates. The S4Aβ11–42 FEL is shown in Figure 5. Three minima were observed which correspond to the coordinates (rmsd; number of SC) of three minima which are (0.86; 54.75), (0.77; 56.00), and (0.73; 57.50), respectively. A clustering method with a backbone cut-off 0.2 nm was then applied to the refined snapshots, which was detected in the free-energy minima, to achieve the representative shapes of the S4Aβ11–42 peptide. The collected conformations are noted as A, B, and C as displayed in Figure 5. In particular, these shapes were observed at the corresponding times as follow 8997.87, 4720.38, and 6008.80 ns, respectively. Furthermore, the corresponding shapes occupied 56, 7, and 8% of total conformations over the time interval 4–10 μs of MD simulations. Structural information of these shapes is described in Table 1. The CCS of the three shapes is ∼15.88 nm2, which is slightly smaller than that of the helical transmembrane Aβ17-42 tetramer (4tmαAβ11–42) with a value of ∼16.5 nm2.58 The α-content was observed in both shapes B and C, whereas the structure was not detected in the representative conformation A (Figure 5). Moreover, it is known that the self-assembly of the Aβ peptide is supposed to be random coil structure → α-structure → β-structure.12,62 It probably can be argued that the similar α-structure accommodating but richer coil content shape B is an intermediate structure of the self-assembly process from a random structure to the shape C. Similarly, the shape C is a transitional structure of the self-aggregation process from the α-structure containing the B shape to the metastable shape A. In other words, the self-assembly pathway would probably be as follows shape B → shape C → shape A (Figure S4 of Supporting Information file). This argument is consistent with the obtained free energy barrier of these conformations (Figure 5).
Figure 5.
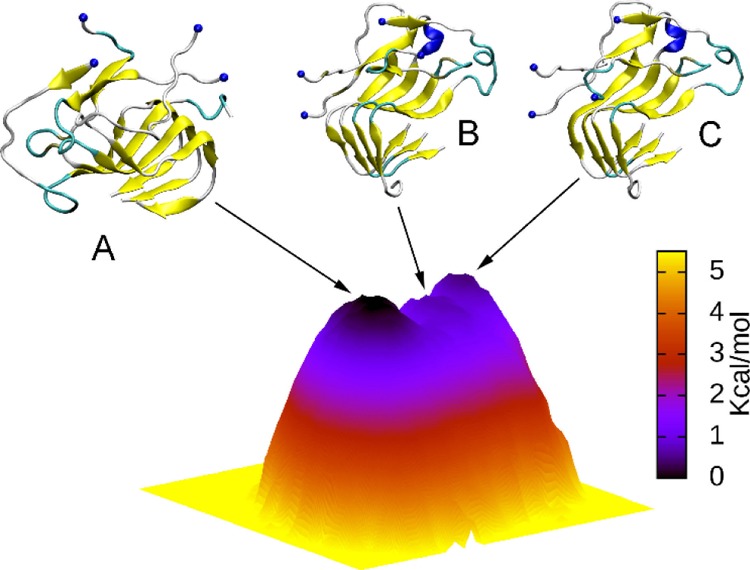
The collective variable free energy landscape of the S4Aβ11–42 peptide. The backbone rmsd and the mean nonbonded contacts between the constituting chains of the peptide are used as the reaction coordinates. The blue spheres were used to denote the N-terminus.
Table 1. Structural Information of the S4Aβ11–42 Peptidea.
| structure | α (%) | β (%) | turn (%) | coil (%) | CCS (nm2) | population (%) |
|---|---|---|---|---|---|---|
| A | 0 | 43 | 5 | 52 | 15.96 | 56 |
| B | 1 | 40 | 7 | 52 | 15.71 | 7 |
| C | 1 | 43 | 8 | 48 | 15.97 | 8 |
Measured values were obtained using DSSP and IMPACT tools. Backbone rmsd cut-off = 0.2 nm.
Dissociation Free Energy of the S4Aβ11-40 Oligomer
As mentioned above, the Aβ peptides consisting of three/four monomers are hallmarked as the most toxic compounds among low weight oligomers.34 The self-aggregation process from a trimer to a tetramer could be deduced through studying the dissociation free energy of the monomer located at the edge of the Aβ tetramer. The understanding of Aβ self-assembly would be further illuminated. Several approaches were developed to determine the binding affinity between the two molecules.63−67 Here, the umbrella sampling (US) method was employed to estimate the disassociation energy barrier referring to a previous study.68 The free energy ΔG over US simulations along reaction coordinate ξ was determined employing the weight histogram analysis method (WHAM).69 In particular, the most representative conformation A was chosen to evaluate the dissociation free energy because its population occupies 56% of the whole considered MD snapshots. The SMD simulations were carried out to unbind the Aβ trimer (chain A, B, and C) from the monomer (chain D) as the modeling is shown in Figure 6, in which we have assumed that the peptide is roughly symmetrical over the unbinding direction.68
Figure 6.
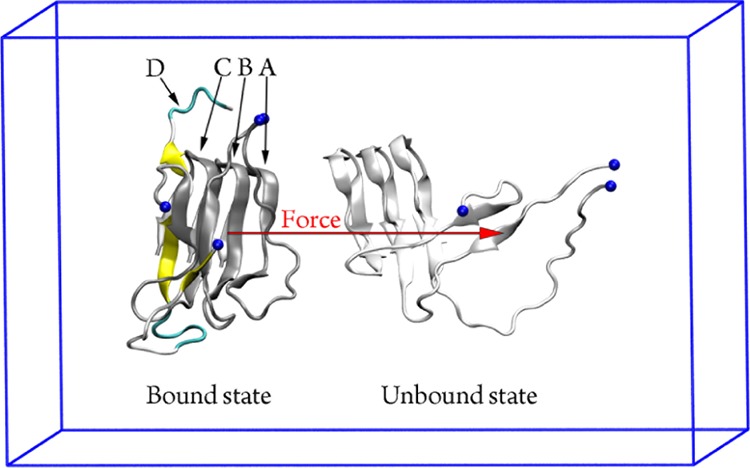
The modeling of the dissociation process of the Aβ trimer (chain A, B, and C) and monomer (chain D) using SMD simulations. The pulling force was put on the trimer center of mass shown as the red arrow. The blue spheres mentioned the N-terminus of the Aβ peptides.
During SMD simulations, the Aβ trimer was rapidly forced to dissociate from chain D. Interestingly, although the pulling force was put on the center of mass of the trimer, the C-terminal mobilized slower than the N-terminal during the dissociation process (Figure 6). Observations indicated that the C-terminal adopts a stronger affinity to the corresponding domain of other chains in comparison with the N-terminal. The obtained results are in good agreement with the above structural analyses. Furthermore, it is implied that the C-terminal is the probable nucleation of the Aβ42 oligomers instead of the N-terminal in the Aβ40 systems.30
The coordinates of the whole system were monitored every ∼0.1 nm such that they would be served as the initial conformations of the US calculations according to the description in the Materials and Methods section. The sampling is guaranteed due to the overlap of histograms (Figure S5). The free energy profile along the unbinding pathway of the dissociation process was constructed utilizing GROMACS tool “gmx wham”. The obtained potential of mean force (PMF) of the US simulations is presented in Figure 7. The PMF-curve morphology is in good agreement with previous studies.67,70 The PMF curve energizes starting at the zero value, then fall downs to the lowest amount, finally the PMF value then increases to the equilibrium state when ξ accomplishes ∼2 nm (Figure 7). The range is significantly larger than that of the protein-ligand system (∼1.0 nm),67 which associates with the nonbonded cut-off. It happens because the Aβ trimer structure was prolonged during SMD simulations because the C-terminal is slower in motion than the N-terminal. The PMF stable region indicates that the nonbond between the trimer and the monomer is completely terminated. The free-energy value ΔGUS was determined as the variation between the smallest and largest values of the PMF according to the explanation given in Figure 7. Here, the free energy value is ΔGUS = −58.44 ± 1.26 kcal/mol, whereas the error was detected through 100 rounds of the bootstrapping estimation.71 The obtained binding free energy is approximately at the same level with the corresponding metric of the U-shape Aβ17-42 system, which is −50.50 kcal/mol.68 Moreover, it is noted that the calculated free energy ΔGUS is often larger than the experimental amount.67,68,72 The difference is caused by the exaggeration of simulating the interaction among component molecules, including the peptide and water molecules.73,74 The S-shape Aβ11–42 oligomer is approximately stable like the U-shape Aβ17-42 system. In other words, the observed probability of S-shape Aβ42 oligomers is seemingly similar to the U-shape systems.
Figure 7.
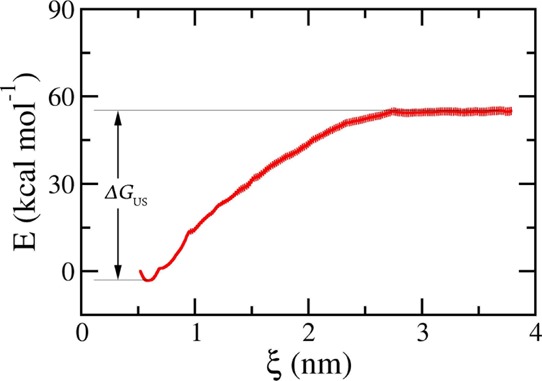
Dissociation free energy profile along the reaction coordinate ξ was obtained from the PMF analysis using WHAM. The error was earned through 100 rounds of the bootstrapping estimation.71
Conclusions
In summary, the S-shape 4Aβ11–42 peptide, deriving from a photofibril structure, 2MXU,52 was mimicked over a long time MD simulations. The tetramer changes over the first 4 μs of MD simulations, and then achieves the equilibrium state during the last 6 μs of MD simulations. The structural change study indicated that the S4Aβ11–42 oligomer is quite flexible involving a high dynamics N-terminal. This may lead to difficulty in determining the oligomeric structures of Aβ42 peptides in experiments.8 It was suggested that the C-terminal enables possible nucleation in the self-assembly of the Aβ42 peptides. Moreover, the size of the U-shape tetramer is smaller than that of the 4tmαAβ17-42 because of 10% of CCS smaller. Over the secondary structure analysis, C-terminal involving sequences 27–35 and 39–40 adopt rigid β-content, whereas other residues including the hydrophobic domain of the N-terminal (sequence 17–21) mostly adopt coil structures. The self-assembly of the tetramer was assumed due to the collective variable free energy landscape analysis that involves the self-aggregation pathway as shape B → shape C → shape A. The conformation A is a metastable structure, observing with the population of 56%. This shape adopts 43% of β-content. Furthermore, on the assumption that the system is symmetrical over the unbinding direction (Figure 6), the dissociation free energy evaluation of the S4Aβ11–42 peptide was characterized using US simulations. The obtained ΔGUS of S4Aβ11–42 is approximately the same as that of the U-shape Aβ17-42.68 Thus, the S4Aβ11–42 oligomer probably stabilizes like the U-shape Aβ17-42 peptide. We anticipate that the realized S4Aβ11–42 structures could be used as targets for AD inhibitor screening in silico.
Materials and Methods
Molecular Dynamics Simulations
GROMACS 5.1.3 was employed to mimic the solvated S4Aβ11–42 peptide, which was extracted from the Aβ11–42 fibril structure with PDB ID: 2MXU.52 The peptides were represented using an Amber99SB-ildn force field,75 referring to a previous work,24,28,30 because the force field adopts the strongest agreement with NMR and circular dichroism results.76 The peptide was inserted into the dodecahedron periodic boundary condition box with a size of ∼310 nm3 referring to previous works.77,78 Water molecules were treated by a TIP3P model79 and four Na+ ions were used to keep neutralization of the system. The soluble system was consisted of approximately 31 000 atoms. The simulations were performed by following three steps including energy minimization, equilibrium simulation (using short NVT and NPT simulations), and MD simulations. The parameters of the MD simulations were chosen according to the previous study.10 In particular, the Langevin dynamics simulation was employed to mimic the solvate Aβ system. The nonbond pair is updated every 5 ps with a cut-off of 0.9 nm. The electrostatic interaction was represented using the particle mesh Ewald with a cut-off of 0.9 nm. The van der Waals interaction is effective when the pair is smaller than 0.9 nm. During the simulation, all the bonds were constrained using the LINCS method.80 The conformational change of the S4Aβ11–42 peptide was chased every 10 ps.
US Calculation
Dissociation free energy of an edge chain to the rest of S4Aβ11–42 is able to characterize through the US simulations referring to a previous study.68 In particular, as mentioned above, the MD-refined shape A was selected as the model of the unbinding process analysis. Shape A was rotated until the unbinding pathway along the reaction coordinate ξ as shown in Figure 6. The Aβ peptide was then inserted into the new solvated PBC box with the size of 6.14 × 6.40 × 10.32 nm to provide appropriate space for the dissociating system. The system thus consists of 4 Aβ11–42 monomers, 12 734 and 4 Na+ ions with 40118 atoms totally.
The solvated system was then energy minimization before the steered-MD approach was employed to unbind the Aβ11–42 trimer out of the rest of the monomer according to the description given in Figure 6. In particular, the Aβ monomer, which was noted as chain D, was restrained using a weak harmonic force during the SMD simulations. The center of mass of the Aβ trimer, including chain A, B, and C, an externally harmonic force was applied with a spring constant cantilever of k = 1000 kJ/mol/nm2 and pulling speed of v = 0.005 nm/ps. The direction of the pulling force is mentioned in Figure 6. Several snapshots recording the unbinding process between the Aβ trimer and monomer were archived along the reaction coordinate ξ. Thirty-one windows were selected to perform the US simulations to evaluate the dissociation free energy profile using the PMF calculations through WHAM analysis.69 The spacing between two neighboring windows is ∼0.1 nm. A short NPT simulation length 100 ps with the positional-restrained condition was performed to relax the solvated system. The relaxed systems were imposed to the US calculation over 10 ns. There are entirely 3.1 μs of MD simulations employed for US calculations.
Structural Analysis
The DSSP protocol46 was used to compute the S4Aβ11–42 secondary structure. The IMPACT package81 was employed to estimate the collisional cross section (CCS). The rmsd, radius of gyration (Rg), and solvent accessible surface area (SASA) were detected by GROMACS tools. An intermolecular side-chain pair between various residues is available when the spacing between the nonhydrogen atoms of different residues is smaller than 0.45 nm. The FEL was generated using collective variables: backbone rmsd and intermolecular side-chain contact.
Acknowledgments
This work was supported by the Institute of Materials Science, Vietnam Academy of Science and Technology to N.T.T.
Supporting Information Available
The Supporting Information is available free of charge on the ACS Publications website at DOI: 10.1021/acsomega.9b00992.
rmsd and RMSF of the tetramer system, the FEL with supposition of the self-assembly pathway, and the histograms of the US simulations (PDF)
Author Contributions
All authors designed the studies, collected, analyzed data, and wrote the manuscript.
The authors declare no competing financial interest.
Supplementary Material
References
- Alzheimer’s_association, Alzheimer’s disease facts and figures Alzheimer’s disease facts and figures 2018.
- Querfurth H. W.; LaFerla F. M. Alzheimer’s disease. N. Engl. J. Med. 2010, 362, 329–344. 10.1056/nejmra0909142. [DOI] [PubMed] [Google Scholar]
- Carter M. D.; Simms G. A.; Weaver D. F. The development of new therapeutics for Alzheimer’s disease. Clin. Pharmacol. Ther. 2010, 88, 475–486. 10.1038/clpt.2010.165. [DOI] [PubMed] [Google Scholar]
- Selkoe D. J. The Molecular Pathology of Alzheimer’s Disease. Neuron 1991, 6, 487–498. 10.1016/0896-6273(91)90052-2. [DOI] [PubMed] [Google Scholar]
- Selkoe D. J.; Hardy J. The Amyloid hypothesis of Alzheimer’s disease at 25 years. EMBO Mol. Med. 2016, 8, 595–608. 10.15252/emmm.201606210. [DOI] [PMC free article] [PubMed] [Google Scholar]
- Nasica-Labouze J.; Nguyen P. H.; Sterpone F.; Berthoumieu O.; Buchete N.-V.; Coté S.; De Simone A.; Doig A. J.; Faller P.; Garcia A.; Laio A.; Li M. S.; Melchionna S.; Mousseau N.; Mu Y.; Paravastu A.; Pasquali S.; Rosenman D. J.; Strodel B.; Tarus B.; Viles J. H.; Zhang T.; Wang C.; Derreumaux P. Amyloid β Protein and Alzheimer’s Disease: When Computer Simulations Complement Experimental Studiesr. Chem. Rev. 2015, 115, 3518–3563. 10.1021/cr500638n. [DOI] [PMC free article] [PubMed] [Google Scholar]
- Coskuner-Weber O.; Uversky V. Insights into the Molecular Mechanisms of Alzheimer’s and Parkinson’s Diseases with Molecular Simulations: Understanding the Roles of Artificial and Pathological Missense Mutations in Intrinsically Disordered Proteins Related to Pathology. Int. J. Mol. Sci. 2018, 19, 336. 10.3390/ijms19020336. [DOI] [PMC free article] [PubMed] [Google Scholar]
- Banerjee S.; Sun Z.; Hayden E. Y.; Teplow D. B.; Lyubchenko Y. L. Nanoscale Dynamics of Amyloid β-42 Oligomers as Revealed by High-Speed Atomic Force Microscopy. ACS Nano 2017, 11, 12202–12209. 10.1021/acsnano.7b05434. [DOI] [PMC free article] [PubMed] [Google Scholar]
- Ngo S. T.; Hung H. M.; Tran K. N.; Nguyen M. T. Replica Exchange Molecular Dynamics Study of the Amyloid Beta (11-40) Trimer Penetrating a Membrane. RSC Adv. 2017, 7, 7346–7357. 10.1039/c6ra26461a. [DOI] [Google Scholar]
- Ngo S. T.; Hung H. M.; Truong D. T.; Nguyen M. T. Replica Exchange Molecular Dynamics Study of the Truncated Amyloid Beta (11-40) Trimer in Solution. Phys. Chem. Chem. Phys. 2017, 19, 1909–1919. 10.1039/c6cp05511g. [DOI] [PubMed] [Google Scholar]
- Bitan G.; Kirkitadze M. D.; Lomakin A.; Vollers S. S.; Benedek G. B.; Teplow D. B. Amyloid β-Protein (Aβ) Assembly: Aβ40 and Aβ42 Oligomerize through Distinct Pathways. Proc. Natl. Acad. Sci. U.S.A. 2003, 100, 330–335. 10.1073/pnas.222681699. [DOI] [PMC free article] [PubMed] [Google Scholar]
- Kirkitadze M. D.; Condron M. M.; Teplow D. B. Identification and Characterization of Key Kinetic Intermediates in Amyloid β-Protein Fibrillogenesis. J. Mol. Biol. 2001, 312, 1103–1119. 10.1006/jmbi.2001.4970. [DOI] [PubMed] [Google Scholar]
- Ngo S. T.; Nguyen M. T.; Nguyen N. T.; Vu V. V. The Effects of A21G Mutation on Transmembrane Amyloid Beta (11–40) Trimer: an In Silico Study. J. Phys. Chem. B 2017, 121, 8467–8474. 10.1021/acs.jpcb.7b05906. [DOI] [PubMed] [Google Scholar]
- Eskici G.; Gur M. Computational Design of New Peptide Inhibitors for Amyloid Beta (Aβ) Aggregation in Alzheimer’s Disease: Application of a Novel Methodology. PLoS One 2013, 8, e66178. 10.1371/journal.pone.0066178. [DOI] [PMC free article] [PubMed] [Google Scholar]
- Ngo S. T.; Luu X.-C.; Nguyen N. T.; Vu V. V.; Phung H. T. T. Etersalate Prevents the Formations of 6Aβ16-22 Oligomer: an In Silico Study. PLoS One 2018, 13, e0204026. 10.1371/journal.pone.0204026. [DOI] [PMC free article] [PubMed] [Google Scholar]
- Abbott A.; Dolgin E. Failed Alzheimer’s Trial does not Kill Leading Theory of Disease. Nature 2016, 540, 15–16. 10.1038/nature.2016.21045. [DOI] [PubMed] [Google Scholar]
- Doig A. J.; del Castillo-Frias M. P.; Berthoumieu O.; Tarus B.; Nasica-Labouze J.; Sterpone F.; Nguyen P. H.; Hooper N. M.; Faller P.; Derreumaux P. Why Is Research on Amyloid-β Failing to Give New Drugs for Alzheimer’s Disease?. ACS Chem. Neurosci. 2017, 8, 1435–1437. 10.1021/acschemneuro.7b00188. [DOI] [PubMed] [Google Scholar]
- Bieschke J.; Herbst M.; Wiglenda T.; Friedrich R. P.; Boeddrich A.; Schiele F.; Kleckers D.; Lopez del Amo J. M.; Grüning B. A.; Wang Q.; Schmidt M. R.; Lurz R.; Anwyl R.; Schnoegl S.; Fändrich M.; Frank R. F.; Reif B.; Günther S.; Walsh D. M.; Wanker E. E. Small-Molecule Conversion of Toxic Oligomers to Nontoxic β-Sheet–Rich Amyloid Fibrils. Nat. Chem. Biol. 2012, 8, 93–101. 10.1038/nchembio.719. [DOI] [PubMed] [Google Scholar]
- Ngo S. T.; Truong D. T.; Tam N. M.; Nguyen M. T. EGCG Inhibits the Oligomerization of Amyloid Beta (16-22) Hexamer: Theoretical Studies. J. Mol. Graph. Model. 2017, 76, 1–10. 10.1016/j.jmgm.2017.06.018. [DOI] [PubMed] [Google Scholar]
- Thompson L. K. Unraveling the Secrets of Alzheimer’s β-Amyloid Fibrils. Proc. Natl. Acad. Sci. U.S.A. 2003, 100, 383–385. 10.1073/pnas.0337745100. [DOI] [PMC free article] [PubMed] [Google Scholar]
- Wise-Scira O.; Xu L.; Kitahara T.; Perry G.; Coskuner O. Amyloid-β Peptide Structure in Aqueous Solution Varies with Fragment Size. J. Chem. Phys. 2011, 135, 205101. 10.1063/1.3662490. [DOI] [PubMed] [Google Scholar]
- Murray B.; Sorci M.; Rosenthal J.; Lippens J.; Isaacson D.; Das P.; Fabris D.; Li S.; Belfort G. A2T and A2V Aβ Peptides Exhibit Different Aggregation Kinetics, Primary Nucleation, Morphology, Structure, and LTP Inhibition. Proteins: Struct., Funct., Bioinf. 2016, 84, 488–500. 10.1002/prot.24995. [DOI] [PubMed] [Google Scholar]
- Hori Y.; Hashimoto T.; Wakutani Y.; Urakami K.; Nakashima K.; Condron M. M.; Tsubuki S.; Saido T. C.; Teplow D. B.; Iwatsubo T. The Tottori (D7N) and English (H6R) Familial Alzheimer Disease Mutations Accelerate Aβ Fibril Formation without Increasing Protofibril Formation. J. Biol. Chem. 2007, 282, 4916–4923. 10.1074/jbc.m608220200. [DOI] [PubMed] [Google Scholar]
- Ngo S. T.; Luu X.-C.; Nguyen M. T.; Le C. N.; Vu V. V. Silico Studies of Solvated F19W Amyloid β (11-40) Trimer. RSC Adv. 2017, 7, 42379–42386. 10.1039/c7ra07187f. [DOI] [Google Scholar]
- Huet A.; Derreumaux P. Impact of the Mutation A21G (Flemish Variant) on Alzheimer’s β-Amyloid Dimers by Molecular Dynamics Simulations. Biophys. J. 2006, 91, 3829–3840. 10.1529/biophysj.106.090993. [DOI] [PMC free article] [PubMed] [Google Scholar]
- Yang X.; Meisl G.; Frohm B.; Thulin E.; Knowles T. P. J.; Linse S. On the Role of Sidechain Size and Charge in the Aggregation of Aβ42 with Familial Mutations. Proc. Natl. Acad. Sci. U.S.A. 2018, 115, E5849–E5858. 10.1073/pnas.1803539115. [DOI] [PMC free article] [PubMed] [Google Scholar]
- Bossis F.; Palese L. L. Amyloid Beta(1–42) in Aqueous Environments: Effects of Ionic Strength and E22Q (Dutch) Mutation. Biochim. Biophys. Acta, Proteins Proteomics 2013, 1834, 2486–2493. 10.1016/j.bbapap.2013.08.010. [DOI] [PubMed] [Google Scholar]
- Ngo S. T.; Hung H. M.; Hong N. D.; Tung N. T. The Influences of E22Q Mutant on Solvated 3Aβ11-40 Peptide: A REMD Study. J. Mol. Graph. Model. 2018, 83, 122–128. 10.1016/j.jmgm.2018.06.002. [DOI] [PubMed] [Google Scholar]
- Côté S.; Derreumaux P.; Mousseau N. Distinct Morphologies for Amyloid Beta Protein Monomer: Aβ1–40, Aβ1–42, and Aβ1–40(D23N). J. Chem. Theory Comput. 2011, 7, 2584–2592. 10.1021/ct1006967. [DOI] [PubMed] [Google Scholar]
- Ngo S. T.; Thu Phung H. T.; Vu K. B.; Vu V. V. Atomistic Investigation of an Iowa Amyloid-β Trimer in Aqueous Solution. RSC Adv. 2018, 8, 41705–41712. 10.1039/c8ra07615d. [DOI] [PMC free article] [PubMed] [Google Scholar]
- Zheng W.; Tsai M.-Y.; Wolynes P. G. Comparing the Aggregation Free Energy Landscapes of Amyloid Beta(1–42) and Amyloid Beta(1–40). J. Am. Chem. Soc. 2017, 139, 16666–16676. 10.1021/jacs.7b08089. [DOI] [PMC free article] [PubMed] [Google Scholar]
- Ono K.; Condron M. M.; Teplow D. B. Structure–Neurotoxicity Relationships of Amyloid β-Protein Oligomers. Proc. Natl. Acad. Sci. U.S.A. 2009, 106, 14745–14750. 10.1073/pnas.0905127106. [DOI] [PMC free article] [PubMed] [Google Scholar]
- Schmit J. D.; Ghosh K.; Dill K. What Drives Amyloid Molecules To Assemble into Oligomers and Fibrils?. Biophys. J. 2011, 100, 450–458. 10.1016/j.bpj.2010.11.041. [DOI] [PMC free article] [PubMed] [Google Scholar]
- Jana M. K.; Cappai R.; Pham C. L. L.; Ciccotosto G. D. Membrane-bound Tetramer and Trimer Aβ Oligomeric Species Correlate with Toxicity Towards Cultured Neurons. J. Neurochem. 2016, 136, 594–608. 10.1111/jnc.13443. [DOI] [PubMed] [Google Scholar]
- Irie Y.; Hanaki M.; Murakami K.; Imamoto T.; Furuta T.; Kawabata T.; Kawase T.; Hirose K.; Monobe Y.; Akagi K.-i.; Yanagita R. C.; Irie K. Synthesis and Biochemical Characterization of Quasi-Stable Trimer Models of Full-Length Amyloid 40 with a Toxic Conformation. Chem. Commun. 2019, 55, 182–185. 10.1039/c8cc08618d. [DOI] [PubMed] [Google Scholar]
- Chebaro Y.; Jiang P.; Zang T.; Mu Y.; Nguyen P. H.; Mousseau N.; Derreumaux P. Structures of Aβ17–42 Trimers in Isolation and with Five Small-Molecule Drugs Using a Hierarchical Computational Procedure. J. Phys. Chem. B 2012, 116, 8412–8422. 10.1021/jp2118778. [DOI] [PubMed] [Google Scholar]
- Nguyen P. H.; Li M. S.; Derreumaux P. Effects of All-Atom Force Fields on Amyloid Oligomerization: Replica Exchange Molecular Dynamics Simulations of the Aβ16-22 Dimer and Trimer. Phys. Chem. Chem. Phys. 2011, 13, 9778–9788. 10.1039/c1cp20323a. [DOI] [PubMed] [Google Scholar]
- Jang S.; Shin S. Amyloid β-Peptide Oligomerization In Silico: Dimer and Trimer. J. Phys. Chem. B 2006, 110, 1955–1958. 10.1021/jp055568e. [DOI] [PubMed] [Google Scholar]
- Meral D.; Urbanc B. Discrete Molecular Dynamics Study of Oligomer Formation by N-Terminally Truncated Amyloid β-Protein. J. Mol. Biol. 2013, 425, 2260–2275. 10.1016/j.jmb.2013.03.010. [DOI] [PMC free article] [PubMed] [Google Scholar]
- Bisceglia F.; Natalello A.; Serafini M. M.; Colombo R.; Verga L.; Lanni C.; De Lorenzi E. An Integrated Strategy to Correlate Aggregation State, Structure and Toxicity of Aß 1–42 Oligomers. Talanta 2018, 188, 17–26. 10.1016/j.talanta.2018.05.062. [DOI] [PubMed] [Google Scholar]
- Brown A. M.; Bevan D. R. Molecular Dynamics Simulations of Amyloid β-Peptide (1-42): Tetramer Formation and Membrane Interactions. Biophys. J. 2016, 111, 937–949. 10.1016/j.bpj.2016.08.001. [DOI] [PMC free article] [PubMed] [Google Scholar]
- Zheng W.; Tsai M.-Y.; Chen M.; Wolynes P. G. Exploring the Aggregation Free Energy Landscape of the Amyloid-β Protein (1–40). Proc. Natl. Acad. Sci. U.S.A. 2016, 113, 11835–11840. 10.1073/pnas.1612362113. [DOI] [PMC free article] [PubMed] [Google Scholar]
- Kahler A.; Sticht H.; Horn A. H. C. Conformational Stability of Fibrillar Amyloid-Beta Oligomers via Protofilament Pair Formation – A Systematic Computational Study. PLoS One 2013, 8, e70521. 10.1371/journal.pone.0070521. [DOI] [PMC free article] [PubMed] [Google Scholar]
- Lipiec E.; Perez-Guaita D.; Kaderli J.; Wood B. R.; Zenobi R. Direct Nanospectroscopic Verification of the Amyloid Aggregation Pathway. Angew. Chem., Int. Ed. 2018, 57, 8519–8524. 10.1002/anie.201803234. [DOI] [PubMed] [Google Scholar]
- Papaleo E.; Mereghetti P.; Fantucci P.; Grandori R.; De Gioia L. Free-Energy Landscape, Principal Component Analysis, and Structural Clustering to Identify Representative Conformations from Molecular Dynamics Simulations: The Myoglobin Case. J. Mol. Graph. Model. 2009, 27, 889–899. 10.1016/j.jmgm.2009.01.006. [DOI] [PubMed] [Google Scholar]
- Touw W. G.; Baakman C.; Black J.; te Beek T. A. H.; Krieger E.; Joosten R. P.; Vriend G. A Series of PDB-Related Databanks for Everyday Needs. Nucleic Acids Res. 2015, 43, D364–D368. 10.1093/nar/gku1028. [DOI] [PMC free article] [PubMed] [Google Scholar]
- Iadanza M. G.; Jackson M. P.; Hewitt E. W.; Ranson N. A.; Radford S. E. A New Era for Understanding Amyloid Structures and Disease. Nat. Rev. Mol. Cell Biol. 2018, 19, 755–773. 10.1038/s41580-018-0060-8. [DOI] [PubMed] [Google Scholar]
- Watanabe-Nakayama T.; Ono K.; Itami M.; Takahashi R.; Teplow D. B.; Yamada M. High-Speed Atomic Force Microscopy Reveals Structural Dynamics of Amyloid β1–42 Aggregates. Proc. Natl. Acad. Sci. U.S.A. 2016, 113, 5835–5840. 10.1073/pnas.1524807113. [DOI] [PMC free article] [PubMed] [Google Scholar]
- Petkova A. T.; Ishii Y.; Balbach J. J.; Antzutkin O. N.; Leapman R. D.; Delaglio F.; Tycko R. A Structural Model for Alzheimer’s Beta-Amyloid Fibrils Based on Experimental Constraints from Solid State NMR. Proc. Natl. Acad. Sci. U.S.A. 2002, 99, 16742–16747. 10.1073/pnas.262663499. [DOI] [PMC free article] [PubMed] [Google Scholar]
- Petkova A. T.; Yau W.-M.; Tycko R. Experimental Constraints on Quaternary Structure in Alzheimer’s Beta-Amyloid Fibrils. Biochem. 2006, 45, 498–512. 10.1021/bi051952q. [DOI] [PMC free article] [PubMed] [Google Scholar]
- Bertini I.; Gonnelli L.; Luchinat C.; Mao J.; Nesi A. A New Structural Model of Aβ40 Fibrils. J. Am. Chem. Soc. 2011, 133, 16013–16022. 10.1021/ja2035859. [DOI] [PubMed] [Google Scholar]
- Xiao Y.; Ma B.; McElheny D.; Parthasarathy S.; Long F.; Hoshi M.; Nussinov R.; Ishii Y. Aβ(1-42) Fibril Structure Illuminates Self-Recognition and Replication of Amyloid in Alzheimer’s Disease. Nat. Struct. Mol. Biol. 2015, 22, 499–505. 10.1038/nsmb.2991. [DOI] [PMC free article] [PubMed] [Google Scholar]
- Gremer L.; Schölzel D.; Schenk C.; Reinartz E.; Labahn J.; Ravelli R. B. G.; Tusche M.; Lopez-Iglesias C.; Hoyer W.; Heise H.; Willbold D.; Schröder G. F. Fibril Structure of Amyloid-β(1–42) by Cryo–Electron Microscopy. Science 2017, 358, 116–119. 10.1126/science.aao2825. [DOI] [PMC free article] [PubMed] [Google Scholar]
- Colvin M. T.; Silvers R.; Ni Q. Z.; Can T. V.; Sergeyev I.; Rosay M.; Donovan K. J.; Michael B.; Wall J.; Linse S.; Griffin R. G. Atomic Resolution Structure of Monomorphic Aβ42 Amyloid Fibrils. J. Am. Chem. Soc. 2016, 138, 9663–9674. 10.1021/jacs.6b05129. [DOI] [PMC free article] [PubMed] [Google Scholar]
- Lu J.-X.; Qiang W.; Yau W.-M.; Schwieters C. D.; Meredith S. C.; Tycko R. Molecular Structure of β-Amyloid Fibrils in Alzheimer’s Disease Brain Tissue. Cell 2013, 154, 1257–1268. 10.1016/j.cell.2013.08.035. [DOI] [PMC free article] [PubMed] [Google Scholar]
- Zhang Y.; Hashemi M.; Lv Z.; Lyubchenko Y. L. Self-Assembly of the Full-Length Amyloid Aβ42 Protein in Dimers. Nanoscale 2016, 8, 18928–18937. 10.1039/c6nr06850b. [DOI] [PMC free article] [PubMed] [Google Scholar]
- Luhrs T.; Ritter C.; Adrian M.; Riek-Loher D.; Bohrmann B.; Dobeli H.; Schubert D.; Riek R. 3D Structure of Alzheimer’s Amyloid-Beta(1-42) Fibrils. Proc. Natl. Acad. Sci. U.S.A. 2005, 102, 17342–17347. 10.1073/pnas.0506723102. [DOI] [PMC free article] [PubMed] [Google Scholar]
- Ngo S. T.; Derreumaux P.; Vu V. V. Probable Transmembrane Amyloid α-Helix Bundles Capable of Conducting Ca2+ Ions. J. Phys. Chem. B 2019, 123, 2645–2653. 10.1021/acs.jpcb.8b10792. [DOI] [PubMed] [Google Scholar]
- Zhao W.; Ai H. Effect of pH on Ab42 Monomer and Fibril-like Oligomers-Decoding in Silico of the Roles of pK Values of Charged Residues. ChemPhysChem 2018, 19, 1103–1116. 10.1002/cphc.201701384. [DOI] [PubMed] [Google Scholar]
- Zhang T.; Zhang J.; Derreumaux P.; Mu Y. Molecular Mechanism of the Inhibition of EGCG on the Alzheimer Aβ1–42 Dimer. J. Phys. Chem. B 2013, 117, 3993–4002. 10.1021/jp312573y. [DOI] [PubMed] [Google Scholar]
- Grasso G.; Rebella M.; Muscat S.; Morbiducci U.; Tuszynski J.; Danani A.; Deriu M. Conformational Dynamics and Stability of U-Shaped and S-Shaped Amyloid β Assemblies. Int. J. Mol. Sci. 2018, 19, 571. 10.3390/ijms19020571. [DOI] [PMC free article] [PubMed] [Google Scholar]
- Fezoui Y.; Teplow D. B. Kinetic Studies of Amyloid β-Protein Fibril Assembly: Differential Effects of α-Helix Stabilization. J. Biol. Chem. 2002, 277, 36948–36954. 10.1074/jbc.m204168200. [DOI] [PubMed] [Google Scholar]
- Gehlhaar D. K.; Verkhivker G.; Rejto P. A.; Fogel D. B.; Fogel L. J.; Freer S. T., Docking Conformationally Flexible Small Molecules into a Protein Binding Site through Evolutionary Programming. In Proceedings of the Fourth International Conference on Evolutionary Programming: 1-3 March 1995; McDonnell J.R.; Reynolds R.G.; Fogel D.B., Eds.; MIT Press: San Diego, 1995. [Google Scholar]
- Rastelli G.; Del Rio A. D.; Degliesposti G.; Sgobba M. Fast and Accurate Predictions of Binding Free Energies using MM-PBSA and MM-GBSA. J. Comput. Chem. 2010, 31, 797–810. 10.1002/jcc.21372. [DOI] [PubMed] [Google Scholar]
- Nguyen T. H.; Rustenburg A. S.; Krimmer S. G.; Zhang H.; Clark J. D.; Novick P. A.; Branson K.; Pande V. S.; Chodera J. D.; Minh D. D. L. Bayesian Analysis of Isothermal Titration Calorimetry for Binding Thermodynamics. PLoS One 2018, 13, e0203224. 10.1371/journal.pone.0203224. [DOI] [PMC free article] [PubMed] [Google Scholar]
- Ngo S. T.; Hung H. M.; Nguyen M. T. Fast and Accurate Determination of the Relative Binding Affinities of Small Compounds to HIV-1 Protease using Non-Equilibrium Work. J. Comput. Chem. 2016, 37, 2734–2742. 10.1002/jcc.24502. [DOI] [PubMed] [Google Scholar]
- Ngo S. T.; Vu K. B.; Bui L. M.; Vu V. V. Effective Estimation of Ligand-Binding Affinity Using Biased Sampling Method. ACS Omega 2019, 4, 3887–3893. 10.1021/acsomega.8b03258. [DOI] [PMC free article] [PubMed] [Google Scholar]
- Lemkul J. A.; Bevan D. R. Assessing the Stability of Alzheimer’s Amyloid Protofibrils Using Molecular Dynamics. J. Phys. Chem. B 2010, 114, 1652–1660. 10.1021/jp9110794. [DOI] [PubMed] [Google Scholar]
- Hub J. S.; de Groot B. L.; van der Spoel D. g_wham—A Free Weighted Histogram Analysis Implementation Including Robust Error and Autocorrelation Estimates. J. Chem. Theory Comput. 2010, 6, 3713–3720. 10.1021/ct100494z. [DOI] [Google Scholar]
- Zeller F.; Zacharias M. Efficient Calculation of Relative Binding Free Energies by Umbrella Sampling Perturbation. J. Comput. Chem. 2014, 35, 2256–2262. 10.1002/jcc.23744. [DOI] [PubMed] [Google Scholar]
- Efron B. Bootstrap Methods: Another Kook at the Jackknife. Ann. Stat. 1979, 7, 1–26. 10.1214/aos/1176344552. [DOI] [Google Scholar]
- Woo H.-J.; Roux B. Calculation of Absolute Protein–Ligand Binding Free Energy from Computer Simulations. Proc. Natl. Acad. Sci. U.S.A. 2005, 102, 6825–6830. 10.1073/pnas.0409005102. [DOI] [PMC free article] [PubMed] [Google Scholar]
- Zhang H.; Yin C.; Jiang Y.; van der Spoel D. Force Field Benchmark of Amino Acids: I. Hydration and Diffusion in Different Water Models. J. Chem. Inf. Model. 2018, 58, 1037–1052. 10.1021/acs.jcim.8b00026. [DOI] [PubMed] [Google Scholar]
- Zhang H.; Jiang Y.; Cui Z.; Yin C. Force Field Benchmark of Amino Acids. 2. Partition Coefficients between Water and Organic Solvents. J. Chem. Inf. Model. 2018, 58, 1669–1681. 10.1021/acs.jcim.8b00493. [DOI] [PubMed] [Google Scholar]
- Aliev A. E.; Kulke M.; Khaneja H. S.; Chudasama V.; Sheppard T. D.; Lanigan R. M. Motional Timescale Predictions by Molecular Dynamics Simulations: Case Study using Proline and Hydroxyproline Sidechain Dynamics. Proteins: Struct., Funct., Bioinf. 2014, 82, 195–215. 10.1002/prot.24350. [DOI] [PMC free article] [PubMed] [Google Scholar]
- Somavarapu A. K.; Kepp K. P. The Dependence of Amyloid-β Dynamics on Protein Force Fields and Water Models. ChemPhysChem 2015, 16, 3278–3289. 10.1002/cphc.201500415. [DOI] [PubMed] [Google Scholar]
- Weber O. C.; Uversky V. N. How Accurate Are Your Simulations? Effects of Confined Aqueous Volume and AMBER FF99SB and CHARMM22/CMAP Force Field Parameters on Structural Ensembles of Intrinsically Disordered Proteins: Amyloid-β42 in Water. Intrinsically Disord. Proteins 2017, 5, e1377813. 10.1080/21690707.2017.1377813. [DOI] [PMC free article] [PubMed] [Google Scholar]
- Shabane P. S.; Izadi S.; Onufriev A. V. General Purpose Water Model Can Improve Atomistic Simulations of Intrinsically Disordered Proteins. J. Chem. Theory Comput. 2019, 15, 2620–2634. 10.1021/acs.jctc.8b01123. [DOI] [PubMed] [Google Scholar]
- Jorgensen W. L.; Chandrasekhar J.; Madura J. D.; Impey R. W.; Klein M. L. Comparison of Simple Potential Functions for Simulating Liquid Water. J. Chem. Phys. 1983, 79, 926–935. 10.1063/1.445869. [DOI] [Google Scholar]
- Hess B.; Bekker H.; Berendsen H. J. C.; Fraaije J. G. E. M. LINCS: A Linear Constraint Solver for Molecular Simulations. J. Comput. Chem. 1997, 18, 1463–1472. . [DOI] [Google Scholar]
- Marklund E. G.; Degiacomi M. T.; Robinson C. V.; Baldwin A. J.; Benesch J. L. P. Collision Cross Sections for Structural Proteomics. Structure 2015, 23, 791–799. 10.1016/j.str.2015.02.010. [DOI] [PubMed] [Google Scholar]
Associated Data
This section collects any data citations, data availability statements, or supplementary materials included in this article.


