Abstract
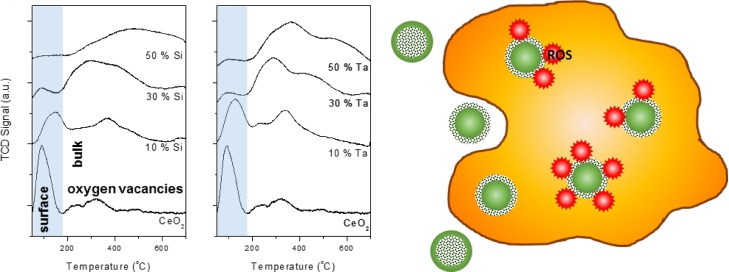
To address an important challenge in the engineering of antioxidant nanoparticles, the present work devised a surface-to-bulk migration of oxygen vacancies in the oxygen radical-scavenging cerium-oxide nanoparticles. The study highlights the significance of surface oxygen vacancies in the intended cellular internalization and, subsequently, the radical scavenging activity of the nanoparticles inside the cells. The findings advise future development of therapeutic antioxidant nanomaterials to also include engineering of the particles for enhanced surface defects not only for the accessibility of their oxygen vacancies but also, equally important, rendering them bioavailable for cellular uptake.
Introduction
Reactive oxygen species (ROS) have been implicated in the pathogenesis of various prominent human diseases, including cancer,1 chronic inflammation,2 neurodegenerative disorders,3 and even ophthalmologic conditions.4 The clinical effects arise from uncontrolled generation of metabolic ROS overwhelming the cellular antioxidant defenses. Overproduction of ROS, including singlet oxygen (O21Δg) species, hydroxyl (•OH) radicals, and superoxide (O2•–) anions, causes destruction of biomolecules such as lipids, proteins, and DNA, which often leads to irreversible tissue damage.5,6 Over the last decade, the development of nano cerium-oxide (nanoceria)-based ROS neutralizing therapeutics has received increasing attention because of the particle’s intrinsic Ce3+/Ce4+ switchable oxidation states. The redox cycling facilitates reversible stoichiometric storing (CeO2) and release of oxygen (CeO2−δ), rendering nanoceria as a potential self-regenerating ROS scavenger in response to the presence of both oxidizing and reducing oxygen species in cells.4,7−9 Research has focused on enhancing the oxygen storage and release capacity of nanoceria for biological ROS modulation, which is widely thought to be a function of the formation and mobility of oxygen vacancies.10−12 Structural distortions through elemental doping of nanoceria have been shown to introduce defects for enhanced oxygen storage and release capacity via Ce3+/Ce4+ transition of the particles for antioxidant activity.13−16 However, a solid-state engineering approach for an intended biological application has the potential to give rise to unexpected biological fates and functions of nanoparticles.
Underlining the significance of cellular physiological responses to nanoparticles, herein, we report the biological antioxidant effects of structurally distorted, oxygen vacancy-engineered nanoceria. ROS-producing inflammatory cells, in this case, activated U937 monocyte/macrophages (monocytes are associated with many inflammatory progressions, including in rheumatoid arthritis), were found to internalize particles most efficiently when the particles are with high levels of surface oxygen vacancies, and these particles subsequently scavenged intracellular ROS. The present work highlights the importance of surface defects to render the nanoparticle bioavailable for cellular uptake and therefore enabling the intended activity, in this case, as ROS scavenger, to take place intracellularly. The study is expected to shift the current target of engineering of the antioxidant nanoparticle from enhancement of the oxygen exchange capacity to also include design of distinctive surface characteristics.
Results and Discussion
To introduce structural defects, nanoceria was doped with increasing concentrations of Si4+ and Ta5+ at 10, 30, and 50 at. %, producing Si–CeO2 and Ta–CeO2. The particles were synthesized via rapid flame spray pyrolysis (FSP) of cerium 2-ethylhexanoate premixed with tetraethyl orthosilicate and tantalum(V) ethoxide for Si and Ta dopings, respectively. The FSP technique allows for a one-step, precise stoichiometric synthesis of the doped nanoceria. The incorporation of Si4+ and Ta5+ with smaller ionic radii of 0.26 and 0.74 Å, respectively, compared to that of Ce3+ of 1.15 Å or Ce4+ of 0.97 Å17 distorts the crystal structure of nanoceria (Figure 1).
Figure 1.
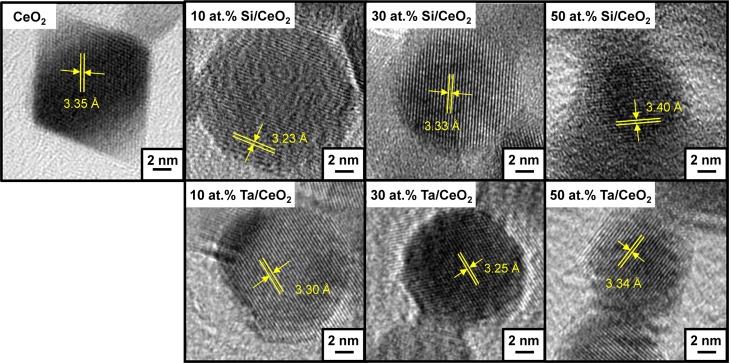
HR-TEM of FSP-synthesized nanoceria with 10, 30, and 50 at. % Si and Ta dopings. Yellow lines indicate measurements of lattice spacing.
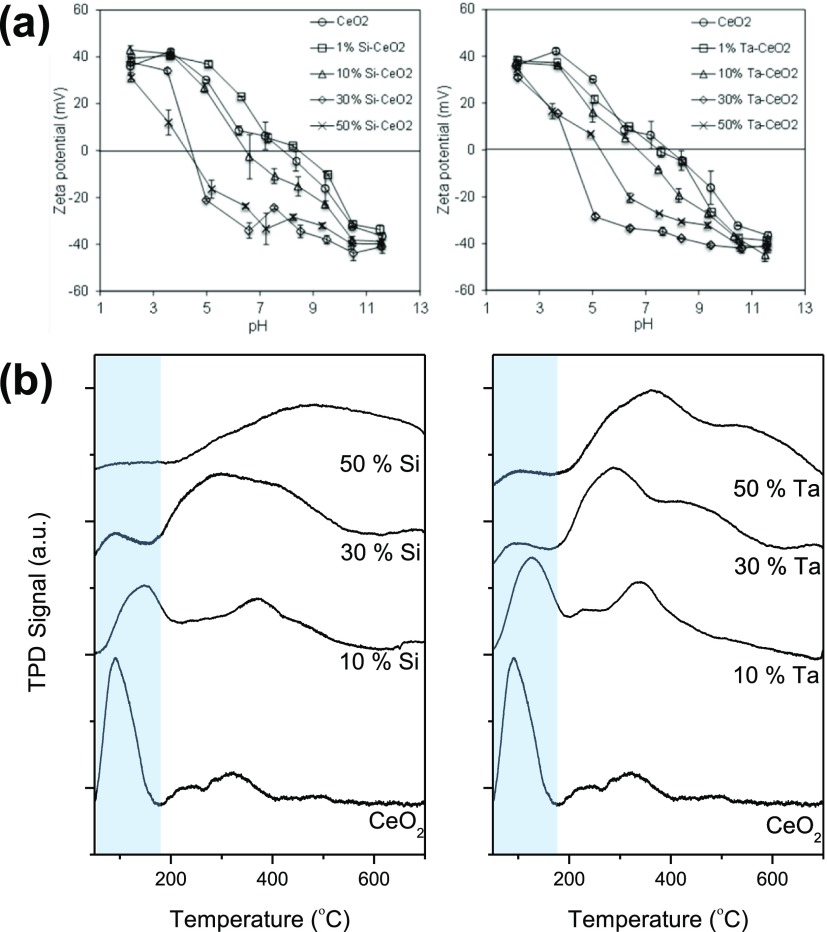
The presence of dopants transforms the particle morphology from the well-defined rhombohedral structure with sharp edges of the nanoceria [X-ray diffraction (XRD)-estimated average crystal size, dXRD = 11.9 nm, Figure S1 and Table 1] to fully spherical morphologies with Si doping (dXRD = 10.1–11.6 nm) and into “spheroid” morphologies with Ta doping (dXRD = 10.8–11.4 nm, with a smaller dXRD = 7.9 nm at 50 at. % doping). Similar findings have been reported for FSP-synthesized ceria–zirconia with Si and Al dopings, resulting in changes in the particle morphology from polyhedral to spherical, even at 3 wt % doping.18 Doping of Si at 30 and 50 at. % resulted in the formation of an amorphous layer, visible as a gel-like layer surrounding the particles (Figure 1). Further zeta potential analysis of these particles (Figure 2a) revealed a significant isoelectric point (IEP) shift from pH ≈ 8 for the nanoceria to pH ≈ 4. The IEP of silica (SiO2) is ∼2, and thus the shift indicated the transformation of the surface properties of 30 and 50 at. % Si–CeO2 toward silica, inferring the formation of a silica gel-like surface layer.19 XRD analysis, shown in Figure S1, revealed negligible changes in the diffraction spectra for all Si-doped nanoceria relative to the nanoceria, consistent with the only small contraction found from transmission electron microscopy (TEM) imaging (Figure 1). This contraction is evidence of Si incorporation into the nanoceria lattice (due to its smaller ionic radius), as later confirmed by X-ray photoelectron spectroscopy (XPS) depth profiling. For the Ta doping, further mismatch in ionic valency (Ta5+ compared to Ce3+ and Ce4+) is also thought to contribute to the structural distortion.20 At 50 at. % Ta doping, the XRD spectrum suggests the presence of TaO2 phases (Figure S1). All samples exhibit high crystallinity with well-defined lattice fringes (Figure 1).
Table 1. BET Specific Surface Area and O2-TPD Results for FSP-Synthesized Nanoceria with 10, 30, and 50 at. % Si and Ta Dopings.
| surface area (m2/g) | crystal size (nm)a | relative OSCb | low temp. peak portion (%)c | low temp. peak (°C) | |
|---|---|---|---|---|---|
| CeO2 | 146 | 11.9 | 1.00 | 58.2 | 91 |
| 10 at. % Si–CeO2 | 108 | 10.9 | 0.92 | 46.1 | 127 |
| 30 at. % Si–CeO2 | 101 | 10.1 | 1.00 | 5.3 | 86 |
| 50 at. % Si–CeO2 | 110 | 11.6 | 1.22 | ||
| 10 at. % Ta–CeO2 | 97 | 10.9 | 0.93 | 39.0 | 147 |
| 30 at. % Ta–CeO2 | 78 | 11.6 | 0.92 | 6.4 | 88 |
| 50 at. % Ta–CeO2 | 56 | 7.9 | 0.73 |
Figure 2.
(a) Zeta potential and (b) O2-TPD results of FSP-synthesized nanoceria with 10, 30, and 50 at. % Si and Ta dopings.
Studies of the oxygen vacancies of the structurally distorted nanoceria yield interesting insights into the surface and bulk defects as a result of dopant incorporation. Oxygen vacancies in nanoceria are formed to compensate for the positive charge reduction to Ce3+ and are theoretically more stable at the surface than in the bulk crystal.10,21,22 To understand the nature of oxygen vacancies in the doped nanoceria, O2-temperature-programmed desorption (TPD) studies were carried out to probe both the oxygen-storage capacity (OSC) of the materials along with the surface/bulk accessibility of the oxygen vacancies (Figure 2b and Table 1). At low temperature, <200 °C, desorption peaks of the O2-TPD profile are associated with the release of surface oxygen, whereas higher temperature peaks correlate with the release of bulk oxygen, requiring more energy.23 The analysis revealed that the Si and Ta dopings affected the accessibility of the particles’ oxygen vacancies, despite their generally similar total OSC relative to the nanoceria (excluding the 50 at. % Si–CeO2 and Ta–CeO2 with 20–30% OSC discrepancies relative to the nanoceria). The nanoceria particles contained ∼60% surface oxygen vacancies (of the total OSC) as indicated by the low-temperature desorption peak, enabling these particles to capture oxygen-free radicals such as intracellular ROS. A decrease in the surface oxygen vacancy was observed with 10 at. % Si and Ta dopings as indicated by the reduced intensity of the low-temperature desorption peaks, representing 40–45% of their total OSC. Further increasing the Si and Ta dopant loadings to 30 and 50 at. % caused a dramatic decrease of the surface oxygen vacancies to ∼5% of their total OSC. The latter was accompanied by the increased presence of the bulk oxygen vacancies, only accessible at high temperatures (>200 °C). Note that the decrease in the surface oxygen vacancy is in agreement with the reducing % surface Ce3+ (per unit catalyst) of the particles with increasing dopant loading (Table S1, oxygen vacancies are associated with the Ce3+ state). These findings clearly indicate a concentration-dependent effect of the dopants on the structural defects that were caused by the incorporation of elements with smaller ionic radii and/or mismatched ionic valency. In this case, Si4+ and Ta5+ altered the location of the oxygen vacancies from the surface to the bulk with increasing dopant concentrations. This migration of oxygen vacancies is also indicated by the H2-temperature-programmed reduction (TPR) profile of the nanoceria and the doped samples, as shown in Figure S2.
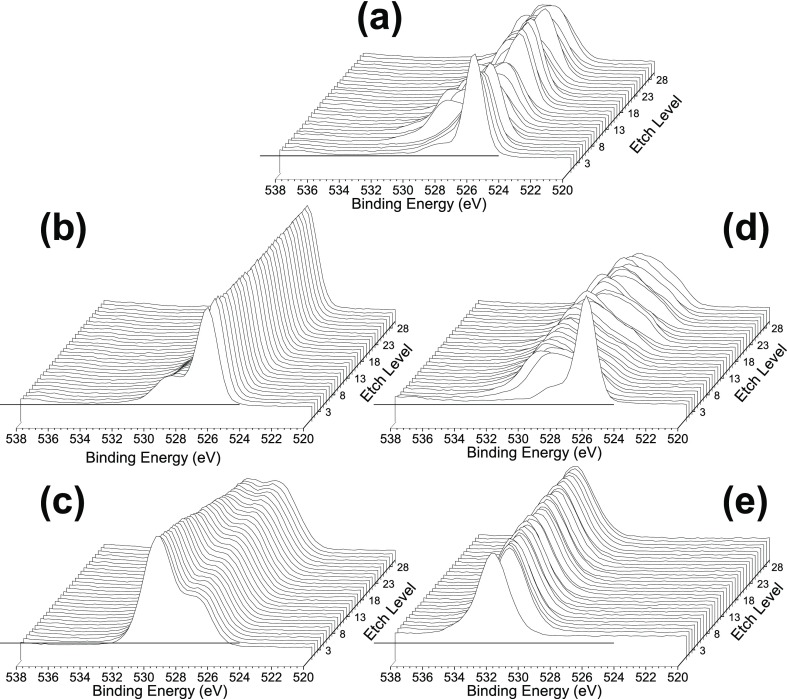
XPS depth profiling was carried out to further understand the nature of the surface and bulk oxygen vacancies of the Si- and Ta-doped nanoceria, with Figure 3 displaying the O 1s spectra and Figures S3–S5 showing the Si, Ta, and Ce profiles. The nanoceria O 1s spectrum (Figure 3a) revealed its surface and bulk oxygen states. At the surface, oxygen predominantly existed as lattice oxygen (∼526 eV, attributed to the CeO2 state).24 The shoulder at ∼528 eV was likely a contribution of oxygen from Ce2O3, an indication of surface oxygen vacancy,21 that was also supported by the O2-TPD analysis. Depth profiling revealed the presence of defects in the bulk structure, as shown by the change in oxygen species in the subsurface layers, with less lattice oxygen at ∼526 eV accompanied by the presence of other oxygen species possibly linked to the Ce2O3 form. These non-CeO2 lattice subsurface oxygen species suggest the presence of oxygen vacancies in the bulk structure. Incorporation of both Si and Ta dopants resulted in a drastic change in the O 1s spectra.
Figure 3.
XPS O 1s depth profiling of FSP-synthesized (a) neat nanoceria, (b) 10 and (c) 50 at. % Si–CeO2, and (d) 10 and (e) 50 at. % Ta–CeO2.
When examining the O 1s spectra for the 10 at. % Si-doped CeO2, distinct variations in the oxygen species compared to the nanoceria were evident. With 10 at. % Si doping, the CeO2 lattice oxygen peak at ∼526 eV became stable throughout the bulk structure (Figure 3b). This suggests that Si occupied the Ce sites when doped into CeO2, which helped preserve the CeO2 crystal structure, as indicated by the disappearance of oxygen peaks at ∼528 eV linked to the Ce2O3 state and hence a decrease in bulk Ce2O3 defects. The Si occupancy of the Ce sites was also evidenced by the occurrence of the 529.5 eV peak in the Si spectra, attributed to SiO2.25 Additionally, its constant presence throughout the bulk structure indicated successful Si doping into the CeO2 crystal. The XPS data supported the particle morphologies imaged using TEM (Figure 1). The TEM images illustrate the contraction in lattice spacing in the presence of the Si dopant (from 3.35 to 3.23 Å), consistent with the smaller crystal lattice of SiO2 relative to CeO2.17 When increased to 50 at. % Si dopant level, the XPS depth profile showed a dominant presence of SiO2 (529.5 eV) at the surface and a mix of CeO2 (∼526 eV) and SiO2 at increasing depth, with no distinguishable Ce2O3 peak (∼528 eV) (Figure 3c). This is consistent with the presence of a SiO2 surface layer visualized under TEM (Figure 1, as also confirmed by the lower pH IEP shift shown in Figure 2a), indicating limited surface accessibility of ceria for oxygen storage and release.
Ta doping resulted in largely similar particle properties as Si doping. As shown in Figures 1 and 2a, Ta doping decreased the particle lattice spacing (from 3.35 to 3.25 Å) and shifted the IEP toward lower pH. Ta dopant also reduced the oxygen vacancy sites. However, while Si doping preserved the Ce–O lattice structure, the XPS depth profile of 10 at. % Ta-doped particles revealed that most of the Ce–O structure has disappeared (Figure 3d). The ∼526 eV lattice oxygen CeO2 peak significantly diminished, with the emergence of the ∼532 eV peak attributed to TaO2. This suggests the formation of a cerium/tantalum solid solution, as also indicated by the XRD spectra (Figure S1). As the Ta dopant level was increased to 50 at. %, only the TaO2 peak was visible (Figure S4). The loss of oxygen adsorption sites, illustrated in the O2-TPD results (Figure 2b), was consistent with this observation. Overall, both the Si- and Ta-doped ceria showed surface to bulk migration of the oxygen vacancies with increasing dopant concentration. This, as described in the following, affected the cellular responses to the particles and, in turn, their biological antioxidant activity.
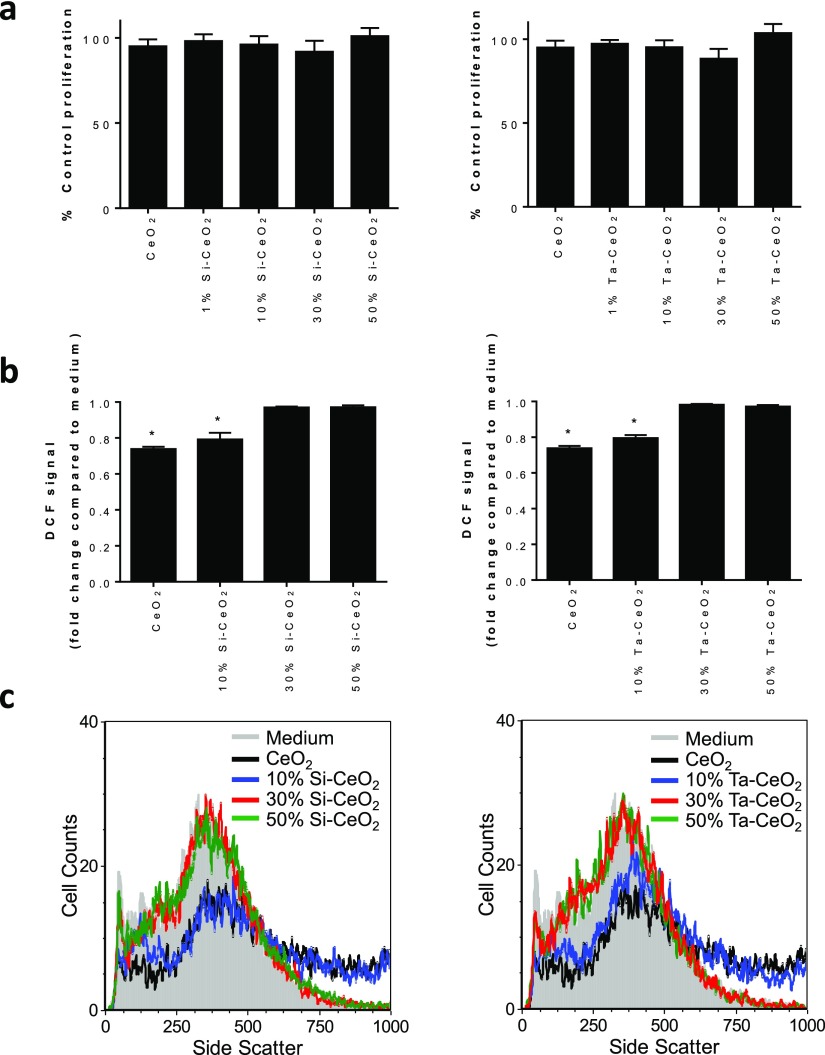
Exposure of activated U937 cells to the nanoceria or the doped variants at 50 μg mL–1 for 48 h demonstrated that none of the particles were cytotoxic even with the increasing dopant concentration (Figure 4a). All samples exhibited comparable extent of cell proliferation as that of the medium-only system (without the particles), and this observation is consistent with our earlier studies for these cells.7−9 The biological antioxidant activities of the particles were investigated by measuring the reduction of the intracellular ROS level of the macrophages. Aligned with the high-level surface oxygen vacancies for the nanoceria, as shown in Figure 4b, these particles were effective (p < 0.05) in reducing intracellular ROS following 48 h exposure at 50 μg mL–1 relative to cells in medium-only. Here, we also found that the 10 at. % Si- and Ta-doped ceria particles, both with a relatively high-level surface oxygen vacancies (although lower when compared to the nanoceria), were effective in significantly (p < 0.05) scavenging the intracellular ROS compared to cells in medium-only. The ROS scavenging effects, however, were absent at higher dopant concentrations of 30 and 50 at. % for both Si and Ta, as there was no difference in the level of intracellular ROS of cells exposed to these particles compared to cells exposed to medium-only. Interestingly, the low presence of oxygen vacancies for these particles was not the underlying reason for the phenomena. Analysis of particle uptake by the cell revealed low levels of particle internalization for the nanoceria doped with 30 and 50 at. % Si and Ta (Figure 4c). This is in contrast to the particle uptake observed with the nanoceria and the 10 at. % Si- and Ta-doped particles (Figure 4c). Taken together, these data suggest that the cells selectively internalized the nanoceria and those doped with low level of either Si or Ta to subsequently modulate the intracellular ROS levels. It is thought that the low-level surface defects (and surface oxygen) for the >10 at. % Si- and Ta-doped samples, likely due to the significant presence of SiO2 surface layers for the Si-doped samples and the limited oxygen storage/release capacity on the surface for the Ta-doped samples, inform the variations in the cellular uptake of the particles and subsequently the intracellular ROS scavenging. Further, the uptake observed appears to be independent of the particle morphology as the doped nanoceria exhibited a round-shaped morphology as compared to the rhomboidal nanoceria (also note that the nanoceria and the doped variants were associated with comparable ∼200 nm aggregate size in the culture medium, Table S2).
Figure 4.
(a) Viability of activated U937 cells exposed to 50 μg mL–1 nanoceria or doped nanoceria compared to cells exposed to medium-only (control proliferation) analyzed after 48 h. Data presented as mean ± standard deviation (SD, n = 3). Note that test conditions were found not to be statistically significant compared to cells exposed to medium-only, as analyzed by one-way analysis of variance (ANOVA) (p < 0.05). (b) Intracellular ROS levels in activated U937 cells as measured by DCF fluorescence by flow cytometry after 48 h of exposure to 50 μg mL–1 nanoceria or doped nanoceria. Data are presented as mean fold change in DCF compared to cells exposed to medium-only ±SD (n = 3) after correction for the level of DCF fluorescence in dead cells/cellular debris. CeO2, 10 at. % Si–CeO2, and 10 at. % Ta–CeO2 were found to significantly reduce intracellular ROS levels compared to cells exposed to medium-only (p < 0.05) as determined by one-way ANOVA. (c) Flow cytometry analysis of the nanoceria and doped nanoceria uptake into activated U937 cells analyzed by side scatter after 48 h of exposure to 50 μg mL–1 particles.
In summary, the present work modulated the presence of oxygen vacancies in nanoparticles through creation of structural distortion. Intended for a biological antioxidant activity, the nanoparticles with redox cycling capability, nanoceria (Ce3+/Ce4+), were doped with smaller ionic radii and/or mismatched ionic valency dopants, Si4+ and Ta5+. The controlled design of these particles facilitated not only the transformation in the particle morphology but also, interestingly, the migration of the oxygen vacancies from the surface of the particles to the bulk structure with increasing dopant concentrations. Ultimately, the study found that the uptake of nanoparticles by cells was dependent on the level of surface oxygen vacancies that subsequently enabled scavenging of intracellular ROS. Particles with low levels of surface oxygen vacancies were not bioavailable, with no uptake by the macrophage cells used in this study. Thus, the realization of the therapeutic potential of antioxidant nanoparticles requires engineering of the particles for enhanced surface defects. This is for the accessibility of their oxygen vacancies and in turn the ROS scavenging activity, and equally important, for the cellular uptake of the nanoparticles.
Experimental Section
Synthesis of Nanoceria, Si-Doped Nanoceria, and Ta-Doped Nanoceria
The particles were synthesized using FSP as described previously.26 For the nanoceria, xylene-dissolved liquid precursor, cerium 2-ethylhexanoate (Sigma-Aldrich, 99.9%, 0.5 M Ce final concentration in the precursor), was fed to the center of the flame by a syringe pump. For the synthesis of Si- and Ta-doped CeO2, tetraethyl orthosilicate (98%) and tantalum(V) ethoxide (99.98%) were used as dopant precursors, respectively. The liquid precursor was fed at 5 mL/min and dispersed with 5 L/min oxygen. During the synthesis, a constant pressure drop of 1.5 bar at the nozzle tip was maintained by adjusting the annular orifice gap (0.15 mm spacing, at 6 mm radius from the center of nozzle). The spray flame was surrounded and ignited by premixed methane/oxygen-supporting flame (1.5/3.2 L/min respectively). Supplied through a sintered metal plate ring (8 mm wide, at 9 mm inner radius from the center of nozzle), an additional 5 L/min oxygen flow was provided as a sheath for the supporting flame. The steep flame temperature gradient causes supersaturation of the metal vapor to form nuclei. As the flame temperature reduces downstream, the nuclei coalesce, sinter, and agglomerate and get collected as nanoparticles on fiberglass filters (Whatmann, GF/D) by the assistance of a vacuum pump (Alcatel SD series).
Characterization of Neat, Si-Doped, and Ta-Doped Ceria Nanoparticles
TEM
High-resolution TEM (HR-TEM) images of the particles were captured with a Phillips CM200 microscope operating at 200 kV equipped with a SIS CCD camera.
XRD
XRD analysis of the particles was performed using a Phillips X’Pert MPD diffractometer with a Cu Kα radiation source (λKα1 = 1.54056 Å and λKα2 = 1.54494 Å) scanning in the 2θ range between 10° and 100° with a 0.02° step size and a scan time of 1 s per step. PANalytical X’pert HighScore Plus software was used to determine the crystallite characteristics and average size with reference to cerianite.
Zeta Potential
The analysis was carried out using a Brookhaven ZetaPlus analyzer (operating with palladium electrodes) on 0.1 g L–1 particle suspension adjusted to pH 2–11 with KOH or HNO3.
O2-TPD Measurements
O2-TPD was used to examine the OSC of the particles. Samples were loaded in a quartz U-tube on a plug of quartz wool. Samples were pretreated to remove any adsorbed water by heating under He at 20 mL/min (Coregas, >99.996%) to 150 °C (at 5 °C/min). The samples were then cooled to room temperature and saturated with O2 at 20 mL/min for 2 h (Coregas, >99.95%) with any physisorbed O2 being removed with a 2 h purge under He. Profiles were then recorded as the samples were heated at 5 °C/min to 900 °C under He at 20 mL/min.
H2-TPR Measurements
H2-TPR analysis of the particles was carried out by passing 10% H2 in He at 25 mL/min with 10 °C/min ramp from room temperature, followed by hold at 850 °C. H2 consumption was measured by a thermal conductivity detector. Prior to analysis, the particles were heated to 250 °C for 0.5 h to eliminate carbonates and/or other interfering adsorbed species.
XPS
XPS spectra were recorded on a Thermo ESCALAB250Xi spectrometer with monochromated Al Kα energy (1486.68 eV). For the depth profiling, the samples were etched across a 2.5 × 2.5 mm region with a reference etching rate of 0.18 nm/s.
Brunauer–Emmett–Teller Surface Area
N2 adsorption–desorption isotherms were recorded on a Micromeritics Tristar 3030 system to determine the Brunauer–Emmett–Teller (BET) surface area at −196 °C. The samples were pretreated at 150 °C for 3 h under vacuum.
Monocyte/Macrophage Interactions with Nanoceria
Culture of U937 Cells
The human leukaemic monocyte lymphoma cell line, U937, was maintained in a monocytic cell suspension in RPMI-1640 culture medium containing 10% (v/v) fetal bovine serum, 100 U mL–1 penicillin, and 100 mg mL–1 streptomycin in a humidified incubator (5% CO2/95% air atmosphere at 37 °C). Treatment of U937 cells with phorbol 12-myristate 13-acetate (PMA) mimics the activation/differentiation of monocytes in vivo. Cells were activated for 72 h with the addition of 100 nM PMA to the culture medium prior to experimentation.
Cell Proliferation Analysis
The activated U937 cells were seeded in six-well tissue culture polystyrene plates at a density of 2 × 10⁵ cells/well in 3 mL of medium. The cells were incubated for 4 h prior to the addition of 50 μg mL–1 nanoceria or without nanoceria. Cell viability was analyzed at 48 h following nanoceria addition using an automated cell viability analyzer (ViCell, Beckman Coulter) that is based on trypan blue exclusion dye analysis.
Cellular ROS and Nanoceria Uptake Analyses
The level of cellular ROS was measured using the intracellular peroxide-dependent oxidation of 2-,7-dichlorodihydrofluorescein diaceteate (DCFH-DA) to form a fluorescent compound, 2-, 7-dichlorofluorescein (DCF).7−9 The activated U937 cells were seeded in six-well tissue culture polystyrene plates at a density of 2 × 10⁵ cells/well in 3 mL of medium and incubated for 4 h prior to the addition of 50 μg mL–1 nanoceria. The presence of intracellular ROS was determined at 48 h following the addition of nanoceria. Cells exposed to medium-only were analyzed to determine the basal level of intracellular ROS. Cells exposed to 4% (w/v) ethanol were used as a control for dead cells and cellular debris for the flow cytometry analysis. The activated U937 cells were removed from culture dishes by trypsinization and resuspended in Dulbecco’s phosphate-buffered saline, pH 7.4 (DPBS). The cells were centrifuged at 1000 rpm for 6 min, the supernatant was removed, and the cells were resuspended in 1 mL of DPBS and incubated with 10 mM DCFH-DA for 30 min at 37 °C prior to analysis by flow cytometry. For each sample, data was acquired for 104 gated events using a flow cytometer (BD FACSort) by measuring the fluorescence intensity along with the number of cells. Data was analyzed using the commercial software, FCS 4 Express. Cellular uptake of nanoparticles was also assessed by measuring the side scatter of each condition.
Acknowledgments
We would like to thank Prof Wey Yang Teoh at the City University of Hong Kong for his support in the synthesis of the nanoparticles and the early stage analyses. This work is financially supported by the Australian Research Council Discovery Project (DP1097149).
Supporting Information Available
The Supporting Information is available free of charge on the ACS Publications website at DOI: 10.1021/acsomega.9b00521.
XRD spectra and H2-TPR profiles of CeO2 and 10, 30, and 50 at. % Si–CeO2 and Ta–CeO2; Ce3+/Ce4+ XPS surface composition of CeO2 and 10 and 50 at. % Si–CeO2 and Ta–CeO2; Si 2p XPS spectra of 10 and 50 at. % Si–CeO2; Ta 4f XPS spectra of 10 and 50 at. % Ta–CeO2; Ce 3d XPS spectra of CeO2, 10 and 50 at. % Si–CeO2, and 10 and 50 at. % Ta–CeO2; and aggregate size of CeO2 and 10, 30, and 50 at. % Si–CeO2 and Ta–CeO2 in the cell culture medium measured by dynamic light scattering (PDF)
The authors declare no competing financial interest.
Supplementary Material
References
- Yang H.; Villani R. M.; Wang H.; Simpson M. J.; Roberts M. S.; Tang M.; Liang X. The role of cellular reactive oxygen species in cancer chemotherapy. J. Exp. Clin. Cancer Res. 2018, 37, 266. 10.1186/s13046-018-0909-x. [DOI] [PMC free article] [PubMed] [Google Scholar]
- Forrester S. J.; Kikuchi D. S.; Hernandes M. S.; Xu Q.; Griendling K. K. Reactive oxygen species in metabolic and inflammatory signalling. Circ. Res. 2018, 122, 877–902. 10.1161/circresaha.117.311401. [DOI] [PMC free article] [PubMed] [Google Scholar]
- Kim G. H.; Kim J. E.; Rhie S. J.; Yoon S. The role of oxidative stress in neurodegenerative diseases. Exp. Neurobiol. 2015, 24, 325–340. 10.5607/en.2015.24.4.325. [DOI] [PMC free article] [PubMed] [Google Scholar]
- McMonnies C. Reactive oxygen species, oxidative stress, glaucoma and hyperbaric oxygen therapy. J. Optom. 2018, 11, 3–9. 10.1016/j.optom.2017.06.002. [DOI] [PMC free article] [PubMed] [Google Scholar]
- Hirst S. M.; Karakoti A. S.; Tyler R. D.; Sriranganathan N.; Seal S.; Reilly C. M. Anti-inflammatory properties of cerium oxide nanoparticles. Small 2009, 5, 2848–2856. 10.1002/smll.200901048. [DOI] [PubMed] [Google Scholar]
- Celardo I.; Pedersen J. Z.; Traversa E.; Ghibelli L. Pharmacological potential of cerium oxide nanoparticles. Nanoscale 2011, 3, 1411–1420. 10.1039/c0nr00875c. [DOI] [PubMed] [Google Scholar]
- Lord M. S.; Jung M.; Teoh W. Y.; Gunawan C.; Vassie J. A.; Amal R.; Whitelock J. M. Cellular uptake and reactive oxygen species modulation of cerium oxide nanoparticles in human monocyte cell line U937. Biomaterials 2012, 33, 7915–7924. 10.1016/j.biomaterials.2012.07.024. [DOI] [PubMed] [Google Scholar]
- Lord M. S.; Tsoi B.; Gunawan C.; Teoh W. Y.; Amal R.; Whitelock J. M. Anti-angiogenic activity of heparin functionalised cerium oxide nanoparticles. Biomaterials 2013, 34, 8808–8818. 10.1016/j.biomaterials.2013.07.083. [DOI] [PubMed] [Google Scholar]
- Ting S. R. S.; Whitelock J. M.; Tomic R.; Gunawan C.; Teoh W. Y.; Amal R.; Lord M. S. Cellular uptake and activity of heparin functionalised cerium oxide nanoparticles in monocytes. Biomaterials 2013, 34, 4377–4386. 10.1016/j.biomaterials.2013.02.042. [DOI] [PubMed] [Google Scholar]
- Esch F.; Fabris S.; Zhou L.; Montini T.; Africh C.; Fornasiero P.; Comelli G.; Rosei R. Electron Localization Determines Defect Formation on Ceria Substrates. Science 2005, 309, 752–755. 10.1126/science.1111568. [DOI] [PubMed] [Google Scholar]
- Mamontov E.; Egami T.; Brezny R.; Koranne M.; Tyagi S. Lattice defects and oxygen storage capacity of nanocrystalline ceria and ceria-zirconia. J. Phys. Chem. B 2000, 104, 11110–11116. 10.1021/jp0023011. [DOI] [Google Scholar]
- Deshpande S.; Patil S.; Kuchibhatla S. V.; Seal S. Size dependency variation in lattice parameter and valency states in nanocrystalline cerium oxide. Appl. Phys. Lett. 2005, 87, 133113. 10.1063/1.2061873. [DOI] [Google Scholar]
- Tsai Y.-Y.; Oca-Cossio J.; Lin S.-M.; Woan K.; Yu P.-C.; Sigmund W. Reactive oxygen species scavenging properties of ZrO2-CeO2 solid solution nanoparticles. Nanomedicine 2008, 3, 637–645. 10.2217/17435889.3.5.637. [DOI] [PubMed] [Google Scholar]
- Saraf N.; Barkam S.; Peppler M.; Metke A.; Vázquez-Guardado A.; Singh S.; Emile C.; Bico A.; Rodas C.; Seal S. Microsensor for limonin detection: An indicator of citrus greening disease. Sens. Actuators, B 2019, 283, 724–730. 10.1016/j.snb.2018.12.067. [DOI] [Google Scholar]
- Singh S.; Kumar A.; Karakoti A.; Seal S.; Self W. T. Unveiling the mechanism of uptake and sub-cellular distribution of cerium oxide nanoparticles. Mol. BioSyst. 2010, 6, 1813–1820. 10.1039/c0mb00014k. [DOI] [PMC free article] [PubMed] [Google Scholar]
- Gupta A.; Das S.; Neal C. J.; Seal S. Controlling the surface chemistry of cerium oxide nanoparticles for biological applications. J. Mater. Chem. B 2016, 4, 3195–3202. 10.1039/c6tb00396f. [DOI] [PubMed] [Google Scholar]
- Shannon R. D. Revised effective ionic radii and systematic studies of interatomic distances in halides and chalcogenides. Acta Crystallogr., Sect. A: Cryst. Phys., Diffr., Theor. Gen. Crystallogr. 1976, 32A, 751–767. 10.1107/S0567739476001551. [DOI] [Google Scholar]
- Schulz H.; Stark W. J.; Maciejewski M.; Pratsinis S. E.; Baiker A. Flame-made nanocrystalline ceria/zirconia doped with alumina or silica: Structural properties and enhanced oxygen exchange capacity. J. Mater. Chem. 2003, 13, 2979–2984. 10.1039/b307754c. [DOI] [Google Scholar]
- Li D.; Teoh W. Y.; Selomulya C.; Woodward R. C.; Amal R.; Rosche B. Flame-sprayed superparamagnetic bare and silica-coated maghemite nanoparticles: Synthesis, characterization, and protein adsorption-desorption. Chem. Mater. 2006, 18, 6403–6413. 10.1021/cm061861v. [DOI] [Google Scholar]
- Le Gal A.; Abanades S. Dopant incorporation in ceria for enhanced water-splitting activity during solar thermochemical hydrogen generation. J. Phys. Chem. C 2012, 116, 13516–13523. 10.1021/jp302146c. [DOI] [Google Scholar]
- Ying J. Y.; Tschöpe A. Synthesis and characteristics of non-stoichiometric nanocrystalline cerium oxide-based catalysts. Chem. Eng. J. Biochem. Eng. J. 1996, 64, 225–237. 10.1016/s0923-0467(96)03142-9. [DOI] [Google Scholar]
- Sayle T. X. T.; Parker S. C.; Catlow C. R. A. The role of oxygen vacancies on ceria surfaces in the oxidation of carbon monoxide. Surf. Sci. 1994, 316, 329–336. 10.1016/0039-6028(94)91225-4. [DOI] [Google Scholar]
- Ma L.; Wang D.; Li J.; Bai B.; Fu L.; Li Y. Ag/CeO2 nanospheres: Efficient catalysts for formaldehyde oxidation. Appl. Catal., B 2014, 148–149, 36–43. 10.1016/j.apcatb.2013.10.039. [DOI] [Google Scholar]
- Flege J. I.; Kaemena B.; Höcker J.; Bertram F.; Wollschläger J.; Schmidt T.; Falta J. Ultrathin, epitaxial cerium dioxide on silicon. Appl. Phys. Lett. 2014, 104, 131604. 10.1063/1.4870585. [DOI] [Google Scholar]
- Larina T. V.; Dovlitova L. S.; Kaichev V. V.; Malakhov V. V.; Glazneva T. S.; Paukshtis E. A.; Bal’zhinimaev B. S. Influence of the surface layer of hydrated silicon on the stabilization of Co2+ cations in Zr-Si fiberglass materials according to XPS, UV-Vis DRS, and differential dissolution phase analysis. RSC Adv. 2015, 5, 79898–79905. 10.1039/c5ra12551k. [DOI] [Google Scholar]
- Mädler L.; Kammler H. K.; Mueller R.; Pratsinis S. E. Controlled synthesis of nanostructured particles by flame spray pyrolysis. J. Aerosol Sci. 2002, 33, 369–389. 10.1016/s0021-8502(01)00159-8. [DOI] [Google Scholar]
Associated Data
This section collects any data citations, data availability statements, or supplementary materials included in this article.


