Abstract
InterSpin (http://dmar.riken.jp/interspin/) comprises integrated, supportive, and freely accessible preprocessing webtools and a database to advance signal assignment in low- and high-field NMR analyses of molecular complexities ranging from small molecules to macromolecules for food, material, and environmental applications. To support handling of the broad spectra obtained from solid-state NMR or low-field benchtop NMR, we have developed and evaluated two preprocessing tools: sensitivity improvement with spectral integration, which enhances the signal-to-noise ratio by spectral integration, and peaks separation, which separates overlapping peaks by several algorithms, such as non-negative sparse coding. In addition, the InterSpin Laboratory Information Management System (SpinLIMS) database stores numerous standard spectra ranging from small molecules to macromolecules in solid and solution states (dissolved in polar/nonpolar solvents), and can be searched under various conditions using the following molecular assignment tools. SpinMacro supports easy assignment of macromolecules in natural mixtures via solid-state 13C peaks and dimethyl sulfoxide-dissolved 1H–13C correlation peaks. InterAnalysis improves the accuracy of molecular assignment by integrated analysis of 1H–13C correlation peaks and 1H–J correlation peaks of small molecules dissolved in D2O or deuterated methanol, which supports easy narrowing down of metabolite candidates. Finally, by enabling database interoperability, SpinLIMS’s client software will ultimately support scientific discovery by facilitating sharing and reusing of NMR data.
Introduction
Environmental problems such as marine pollution; destruction of land and fresh water ecosystems; depletion of resources including energy, raw materials, and food; and health problems are some of the global challenges of modern society. The realization of a materials-circulating society, including use of renewable energy and production of sustainable food and materials, is increasingly important. With the rapid development of information and communication technology in recent years, it is expected that innovations in environmental science, sustainable resources, materials, foods, and medicine will be integrated by effectively connecting the accumulating scientific data and real-world information.1−3 As a result, digital innovations in the analyses of natural mixtures, such as biogeochemical samples from the environment and molecular complexities from biological tissues, are becoming important both for a sustainable society and for healthcare.4,5
NMR approaches to natural mixture analysis are being developed as a strategy6 to evaluate homeostatic stages via molecular compositional changes in healthcare,7−11 foods,12,13 natural materials,14−17 biomass utilizations,18,19 and environmental ecology.20−24 Alongside, there have been many advances in NMR technology, including high-field NMR over 1 GHz using high-temperature superconducting materials,25 hyperpolarization,26 and photodetection NMR using diamond nitrogen-vacancy centers,27 zero-magnetic-field NMR,28 and compact and benchtop NMR instruments that have become highly cost-effective owing to the marked progress in permanent magnet materials.29,30 These innovations in NMR hardware are likely to be applied not only to precise analysis by high-magnetic-field NMR in the laboratory but also to homeostatic assessments of environment and health, and quality control in the fields of agriculture, forestry, and fishery.
Thus, identification of molecules contained in mixtures is an important task in NMR analysis. Because the physical and chemical properties of these molecules can be extremely diverse, various sample preparation methods and pulse sequences have been used for mixture analysis.4,5,31 Depending on the target molecules under analysis, the sample preparation method may range from solid-state to polar and nonpolar solvent systems.32,33 When targeting small molecules, for example, solution NMR in a polar or semipolar solvent system such as deuterated water (D2O) or deuterated methanol (MeOD) is generally used.34,35 On the other hand, macromolecules can be evaluated using a dimethyl sulfoxide (DMSO)-solubilized system36 or solid-state 13C cross-polarization magic-angle spinning (CP-MAS) NMR. One-dimensional (1D)-NMR and two-dimensional (2D)-NMR such as 1H–13C heteronuclear single quantum coherence (HSQC) and 2D-1H–J resolved (2D-Jres) spectroscopy are also useful for applications where stable isotope labeling experiments cannot be applied.
Nevertheless, such molecular assignments remain difficult owing to the problems of spectral overlap, and a lack of available reference spectra or convenient molecular assignment tools specific to the molecules and conditions of interest. Databases and analytical tools for traditional major metabolomics studies such as HMDB,37 BMRB,38 BML-NMR,39 MMCD,40 NMRShiftDB,41 TOCCATA,42 COLMAR,43 MetaboLights,44 MetaboAnalyst,45 SpinAssign,46 and SpinCouple47 focus on the analysis of low-molecular-mass metabolites by high-magnetic-field solution NMR. For the analysis of macromolecular mixtures derived from environmental samples and living organisms, however, solid-state CP-MAS spectral data can characterize insoluble samples, whereas HSQC spectral data in a DMSO solvent are required to characterize soluble samples. BMRB contains reference NMR data on biomolecules in various solvents such as DMSO and methanol, but it is limited to partial structural data for polysaccharides. In addition, Bm-Char of ECOMICS48 can be used to characterize chemical structures from the HSQC spectrum of a biomass sample. As opposed to many other databases of metabolites, GISSMO49,50 offers the complete spin system for a large number of metabolites, making analysis possible regardless of the magnetic field. Nevertheless, there remain insufficient databases and analytical tools for complex mixtures of similarly structured macromolecules, or for solid CP-MAS NMR, which has typically very low resolution, or low-field benchtop NMR.
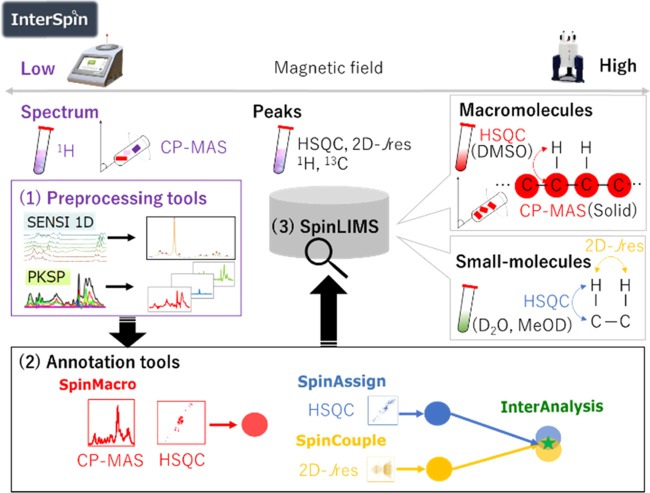
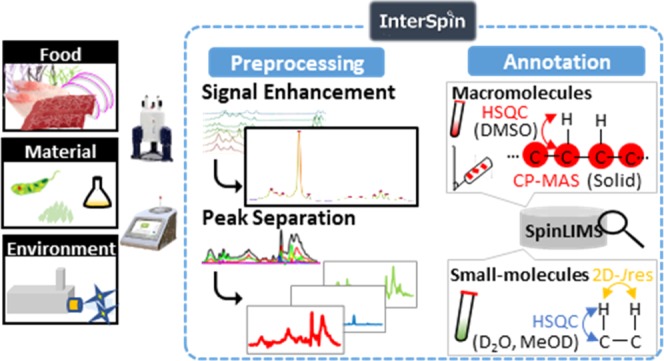
To overcome these problems, here we have developed InterSpin, an integrated supportive webtool comprising freely accessible preprocessing tools, a database, and molecular assignment webtools to advance signal assignment in low- and high-field NMR analyses of small- to macromolecular mixtures (Figure 1). InterSpin comprises the following three elements: (1) spectrum-preprocessing tools, (2) molecular assignment tools, and (3) the InterSpin Laboratory Information Management System (SpinLIMS) database.
Figure 1.
Overview of InterSpin. InterSpin is a freely accessible integrated supportive webtool for advanced performance of NMR signal assignment in low- and high-field NMR analyses of small- to macromolecular mixtures. InterSpin comprises the following three elements. (1) Spectrum-preprocessing tools. In the case of a broad spectrum obtained from low-field benchtop 1H-NMR or solid-state 13C CP-MAS, sensitivity improvement with spectral integration (SENSI) helps to overcome the problem of low signal-to-noise ratio by increasing resolution through the integration of multiple spectra, whereas PKSP supports effective peak separation by a multivariate spectral decomposition method. (2) Molecular assignment tools. SpinMacro supports simplifying the macromolecular assignment of a solid CP-MAS spectrum or a DMSO-solubilized 1H–13C HSQC spectrum. SpinAssign searches the SpinLIMS database for a compound corresponding to the HSQC NMR peaks. SpinCouple can assign 1H–J 2D-Jres NMR peaks. InterAnalysis is a Venn-diagram-type highly accurate annotation tool that helps to narrow down candidate molecules using correlation peaks from both the HSQC spectrum and the 2D-Jres spectrum. In the bottom right of the figure, blue, yellow, and red circles represent a set of search results; the green star represents the narrowed-down set. (3) InterSpin Laboratory Information Management System (SpinLIMS) database. The database includes reference solid-state CP-MAS spectra and solution-state HSQC spectra (DMSO) for macromolecules, and reference solution-state HSQC and 2D-Jres spectra (D2O and MeOD) for small molecules.
Results and Discussion
Signal Enhancement and Peak Separation of Benchtop NMR Spectra by SENSI and PKSP
To support preprocessing of a broad spectrum, InterSpin uses peaks separation (PKSP) and SENSI1D, which have been newly developed as webtools (Figure 1). SENSI1D is intended to increase signal intensities and to overcome the problem of low signal-to-noise (S/N) ratio by the integration of multiple spectra without additional measurements. On the other hand, PKSP is a multivariate method of spectral decomposition that includes the algorithms for non-negative sparse coding (NNSC),51,52 which separates the spectrum into non-negative sparse components; multivariate curve resolution-alternate least squares (MCR-ALS); fast independent component analysis (FastICA); and non-negative matrix factorization (NMF). We have previously described the spectrum-preprocessing methods of SENSI,53 MCR-ALS,15 and NMF;16 here, we have integrated them into InterSpin as a freely available webtool.
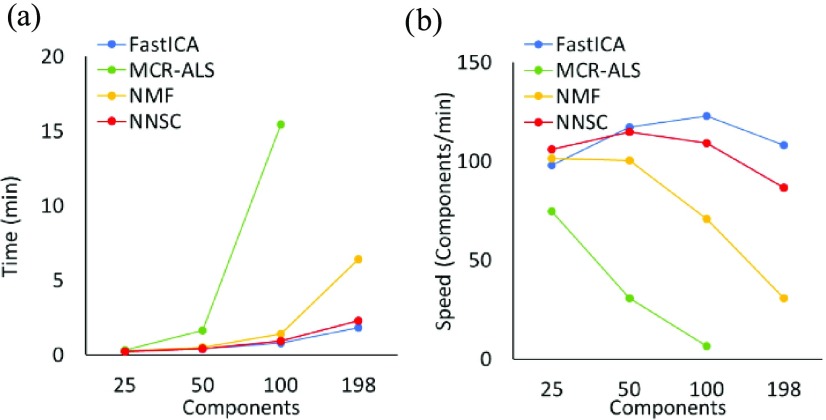
First, we verified the effectiveness of the new function NNSC in PKSP using multicomponent test data with increasing numbers of components. MCR-ALS and NMF required significant computing time when processing more than 100 components, whereas NNSC and FastICA were fast, maintaining speed even as the component number increased (Figure 2). In terms of resolving the spectrum of mixtures of 10 standard compounds (Supporting Information Table S1) with reference to the spectrum of each standard compound by PKSP, the Durbin–Watson (DW) plot approached 2 (Supporting Information Figure S1, white) with 10 components identified by all algorithms, the residual sum of squares (RSS) plot converged to 0, and the spectrum was separated into the correct number of components (Supporting Information Figure S1). NNSC, MCR-ALS, and NMF generally showed good separation of all components from the mixed spectra (Supporting Information Figure S2). In NNSC, a sharp peak was observed in the broad part of the spectrum (3–4 ppm) for glucose. In FastICA, a large error in the original spectrum occurred for glucose and sucrose. In NNSC, NMF, and MCR-ALS, the ratio of components in the mixture was well estimated, but FastICA showed an error for alanine, phenylalanine, proline, valine, and glucose, although its calculation speed was fast (Supporting Information Figure S3).
Figure 2.
Comparison of the analysis speed of each algorithm in peaks separation (PKSP). (a) Three average analysis times for 25, 50, 100, and 198 components (i.e., compounds to be separated by each algorithm of PKSP). (b) Three average analysis speeds for 25, 50, 100, and 198 components.
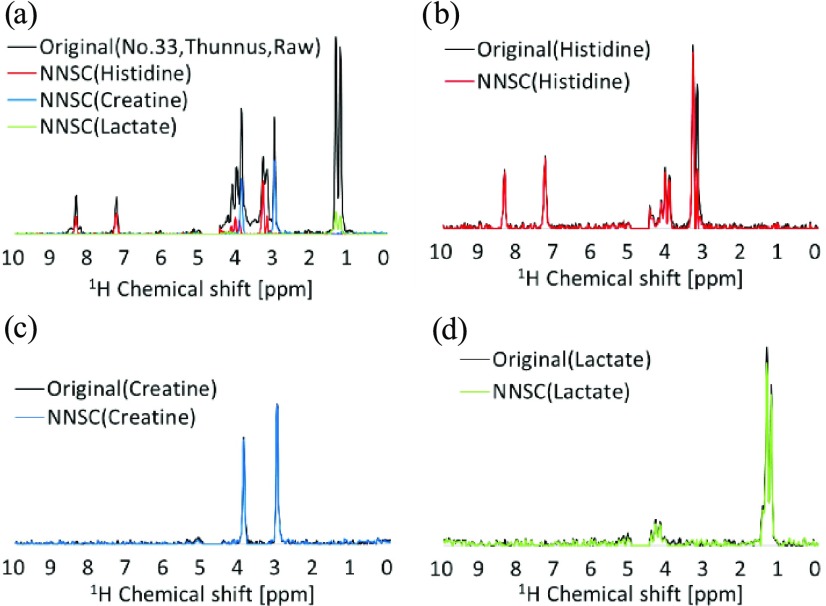
As a demonstration of the integrated use of SENSI and PKSP webtools, Figure 3 shows that histidine, creatine, and lactate were well separated as major components of Thunnus muscle measured by benchtop 60 MHz NMR (Figure 3). For this demonstration, the 60 MHz NMR spectra from 51 samples of 40 fish foods (Supporting Information Table S2) and 11 standard compounds (Supporting Information Table S3) first showed that the SENSI tool strengthened 25 peaks of the 11 standards 66-fold on average and improved the S/N ratio 5.5-fold (Supporting Information Figure S4 and Table S4). Subsequently, peak separation of the benchtop NMR spectrum was performed by NNSC of PKSP, which led to the separation of 17 components (Supporting Information Figure S5). Note that where there are multiple signals for the same molecule, their coefficients of variation (CVs) indicate that their signal intensities vary together. This information can support signal attribution. Thus, histidine, creatine, and lactate could be identified using the CV value of peaks detected by SENSI (Supporting Information Figure S4b) and the individual components obtained by PKSP (Supporting Information Figure S5d).
Figure 3.
Molecular assignment of a mixture using peaks separated by PKSP (NNSC). (a) Original and separated spectra of No. 33 Thunnus sample measured by benchtop 60 MHz NMR. Original and separated component spectra of (b) histidine, (c) creatine, and (d) lactate.
To evaluate peak separation by the four algorithms in PKSP, here we determined the appropriate number of separate peaks using DW and an RSS plot, which is the sum of squares of the residuals of the original matrix of each model and the reconstruction matrix.54 Although FastICA calculated negative values as separate matrices, it determined the number of components more quickly than the other algorithms (Figure 2). When the number of components was large, however, NNSC provided a realistic approximate spectrum at high speed and with non-negative values. For the analysis of large numbers of components, therefore, we considered that it would be most efficient to determine the number of components with FastICA and then perform accurate spectral separation with NNSC.
For analysis in SENSI and PKSP, the peak maximum must have exactly the same chemical shift for each signal. Thus, peak alignment to correct chemical shifts altered because of pH, temperature, or magnetic field inhomogeneity caused by magnetic material in the sample is an important process.
The calculation algorithm used for PKSP is a multivariate analysis; therefore, it is essential to have M numbers of spectral data. However, because 2D-NMR has data in the f2 direction, PKSP can be applied to data from the 2D matrix of one or more spectra of 2D-NMR. Therefore, if a user has difficulty with 2D-NMR peak-picking of, for example, saccharides and lipids, our approach can support objective peak-picking by helping to separate peaks via PKSP. As a result of peak separation in one spectrum of 2D-Jres using PKSP’s MCR-ALS algorithm, it was separated into three components (Supporting Information Figure S6). As shown in Figure S6, 8 compounds (Valine, Lactate, Alanine, Creatine, Trimethylamine N-oxide, Betaine, Glycine and Glucose) were assigned.
In general, quality control is essential in modern food production. In many cases, however, the primary production or distribution sites (i.e., farms or fishing grounds) are located far from laboratories or analytical centers (i.e., food companies or facilities). In such cases, benchtop NMR may potentially revolutionize the quality control processes that identify metabolic changes in food resulting from storage and fermentation. As a practical tool, we previously developed FoodPro,55 a database and webtool for predicting the taste and longevity of foods on the basis of the similarity of desktop NMR spectra of food substances. As shown in this study, SENSI and PKSP are expected to lead to improved cost-effectiveness of this approach by supporting the annotation of the broad spectra obtained from in situ low-field NMR.
Assignment of Macromolecules by SpinMacro
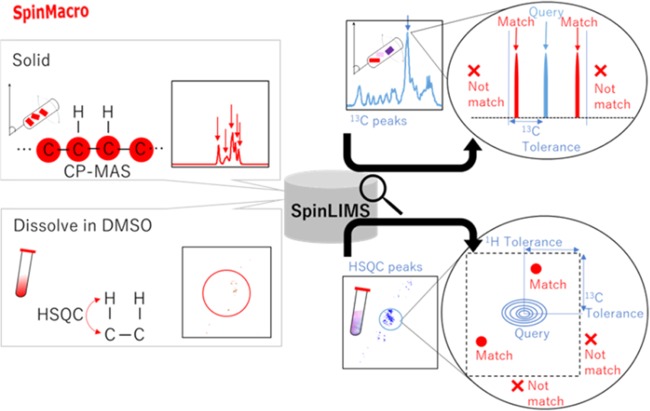
InterSpin’s Annotation tools consist of the newly developed SpinMacro and InterAnalysis, and the re-implemented SpinAssign and SpinCouple, which were previously developed (Figure 1). SpinMacro is a webtool for supporting simplification of the molecular assignment of macromolecules in solid-state 13C CP-MAS spectra and in 1H–13C HSQC spectra recorded in a DMSO solvent (Figure 4, Supporting Information Figure S7). As reference data for SpinMacro, solid CP-MAS peaks and HSQC peaks of compounds in a DMSO solvent have been stored in the InterSpin Laboratory Information Management System (SpinLIMS; see Figure 1) database.
Figure 4.
How to assign macromolecules in a mixture using “SpinMacro”. The flow of data through SpinMacro is shown. The user queries of CP-MAS peaks or HSQC peaks are entered as PHP. The SpinLIMS database is then searched for candidate molecules within the set range of 13C chemical shifts for CP-MAS, or 1H and 13C chemical shifts for HSQC.
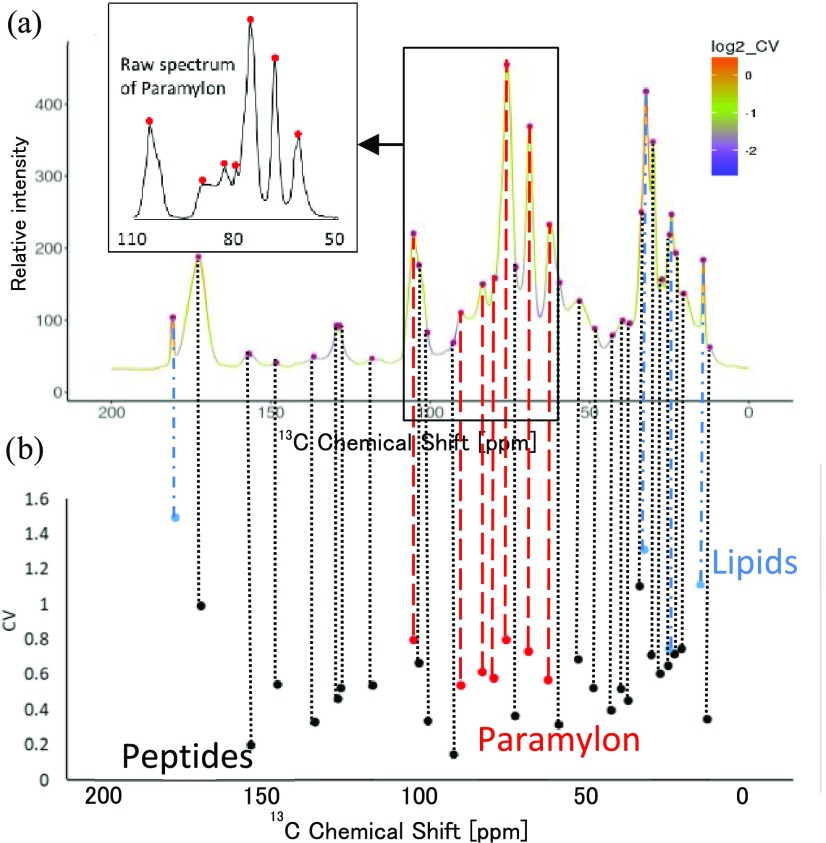
The steps for using SpinMacro are as follows. (1) PHP interpretation of the user query for CP-MAS peaks or HSQC peaks. (2) Connect to the SpinLIMS database and search for candidate molecules within the set range of 13C chemical shifts for CP-MAS, or 1H and 13C chemical shifts for HSQC. (3) Conversion of results to HTML and JavaScript for convenient and quick display. Here, the previously reported solid-state CP-MAS spectra of Euglena gracilis(14) and standards (paramylon, peptides, and lipids) were queried using SpinMacro and SENSI–PKSP. First, the CV value was determined for peaks picked by SENSI (Figure 5), and then, the components were identified by PKSP (Supporting Information Figure S8). As a result, paramylon, peptides, and lipids were separated as the main three components of E. gracilis. Ultimately, as a result of retrieving the peaks picked by SENSI with SpinMacro, it was possible to verify their assignment (Supporting Information Figure S7). In a previous study of general lipids and general peptides of E. gracilis,56 we conducted experiments that required considerable measurement time, such as 2D-/3D-NMR pulse sequences of solid-state NMR (i.e., INADEQUATE, SHA+, and 3D-DARR). Because the peak separation by NNSC corresponds to 1D-CP-MAS, this tool supports a more rapid evaluation of macromolecular mixtures.
Figure 5.
CV of peaks picked by SENSI from E. gracilis CP-MAS spectrum. (a) SENSI results. Red circles are the picked peaks. The enlarged view (top left) shows the raw spectrum of paramylon from the data used for SENSI of a sugar region. (b) CV of peaks picked by SENSI. Blue circles indicate lipid signals, black circles indicate peptide signals, and red circles indicate paramylon signals.
The database and mixture analysis tools for macromolecular and solid CP-MAS NMR of complex and similar structures have room for development. SpinMacro developed herein retrieves the peak of the whole macromolecular structure from SpinLIMS and provides candidate molecules in analyses of environmental and biological macromolecules. In the future, it should be possible to improve assignment accuracy by discriminating macromolecules with similar structures through the extraction of features of chemical structures using machine learning algorithms based on macromolecular databases.
InterSpin Laboratory Information Management System (SpinLIMS) Database
Within InterSpin, SpinLIMS (Figure 1) is a relational database comprising several entities or “tables” developed by MySQL (Supporting Information Figures S9a and S10a, core tables). To make the database extensible, SpinLIMS client software was developed to incorporate a simple registration system. After registering in the user table (“limsuser”), the researchers can associate their NMR spectrum (“spectrum”) with the chemical shift (“cs”) or the J value (“jval”) tables, as well as the molecular value (“metabolite”) table by means of the assignment table (cs_assign, hc_pk (h_pk for 1H-1D-NMR, c_pk for 13C-1D-NMR), and hj_pk) via the client software. For the NMR spectrum, there is an associated pulse-type table (“pulse”), solvent table (“solvent”), and standard substance table (“stdref”). For chemical shifts and J values, there is an associated peak-shaped table (“pkshape”). Molecular name (“metabolitename”), atom (“atom”), and nuclide (“nucleus”) tables are associated with the molecule.
SpinLIMS contains numerous reference spectra of small molecules to macromolecules recorded in solid state and solution state (polar and nonpolar solvent systems) that can be used to support mixture analysis of various samples. Overall, there are 34 data tables in SpinLIMS, as well as tables for managing the information from NMR experiments (Supporting Information Figure S10b). In addition to HSQC in D2O (705 spectra) and 2D-Jres in D2O (623 spectra), SpinLIMS has several newly added spectra from CP-MAS (35 spectra), HSQC in MeOD (947 spectra) and deuterated DMSO (171 spectra), and 2D-Jres in MeOD (357 spectra). SpinMacro, InterAnalysis, SpinAssign, and SpinCouple are connected to the MySQL server via a local network in InterSpin (Supporting Information Figure S9b). As a result, the re-implemented SpinAssign and SpinCouple facilitate chemical shift searches in MeOD. SpinAssign also facilitates searches in a deuterated DMSO/pyridine solvent.
Venn-Diagram-Type Annotation by InterAnalysis
Within InterSpin, the new tool InterAnalysis is a Venn-diagram-type annotation tool that can aid simultaneously searches of two kinds of correlation peaks, 1H–13C HSQC and 2D-Jres, to narrow down candidate molecules (Figure 6). The flow of data through InterAnalysis is as follows: (1) PHP interpretation of user queries, (2) connection to the SpinLIMS database and conversion to HTML, and (3) JavaScript execution for a convenient and rapid view.
Figure 6.
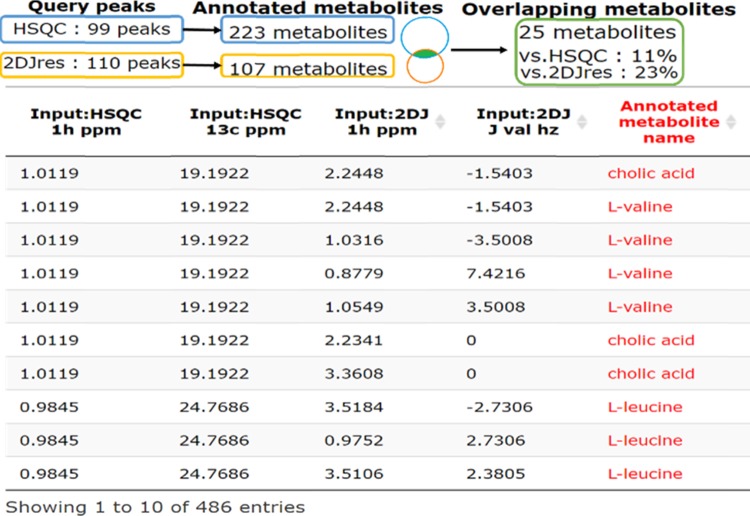
Result of InterAnalysis for 1H–13C HSQC and 1H–J 2D-Jres peaks from Acanthogobius flavimanus body muscle extract in MeOD. The summary shows the number of query peaks, the number of assigned molecules, and the narrowed-down set of molecules. The table shows some of the molecular assignment results for each query peak.
Here, we demonstrated the application of InterAnalysis to HSQC and 2D-Jres peaks from A. flavimanus (Yellowfin goby) body muscle extracts in MeOD (Figure 6) and deuterated potassium phosphate (Supporting Information Figure S11). For data acquired in MeOD extract, SpinAssign and SpinCouple assigned 223 and 107 molecules. By contrast, InterAnalysis assigned 25 molecules, narrowing down the molecules to 11 and 23%, respectively (Figure 6). From previous studies,12,21,23 seven metabolites such as l-valine, l-leucine, l-phenylalanine, l-histidine, l-proline, linoleic acid, and capric acid were confirmed as well-known metabolites that should be present in fish.
In the analysis of natural mixtures, molecular assignment based on two kinds of 2D-NMR spectra, HSQC and 2D-Jres, is a powerful strategy to increase assignment accuracy. The previous tools, SpinAssign and SpinCouple, acquired two separate results of correlation peak attribution; thus, it was highly time-consuming to narrow down candidate molecules. The newly developed Venn-diagram-type webtool, InterAnalysis, supports the annotation of environmentally and biologically derived small-molecule mixtures.
Conclusions
As shown above, InterSpin provides free access to a suite of tools whose goal is to support the interpretation of low-resolution NMR spectra, similar to the spectra recorded for food, material, and environmental applications. Each tool of InterSpin supports low-resolution NMR spectrum analysis by having interoperability as demonstrated, for example, by the peak attribution of E. gracilis by NNSC of SENSI, and confirmation of metabolite candidates by SpinMacro. Furthermore, 2D-Jres and HSQC are pulse sequences that are frequently used in high-magnetic-field NMR; conventionally, SpinAssign and SpinCouple have had to be applied individually, but InterAnalysis will aid the simultaneous application of these tools at the same time.
NMR has the great advantage that chemical shifts and coupling constants are absolute physical constants that have high repeatability and interchangeability among different agencies. Therefore, NMR provides data that are suitable for reuse globally. For NMR analyses that target the molecular complexity of living bodies and environments, InterSpin provides an integrated supportive resource, consisting of an extensible SpinLIMS database and webtools that are easily accessible to varied and numerous researchers. SpinLIMS’s client software will ultimately promote scientific discovery through the open circulation of knowledge by facilitating data sharing and reusing, as well as the interoperability of NMR data for the achievements of researchers to be recognized fairly and with transparency.
In conclusion, InterSpin comprises integrated supportive webtools that are effective not only for precision analysis in laboratories but also for on-site analysis by benchtop NMR. As a platform linking the laboratory and the real world, it will support sustainable development on the basis of NMR data.
Experimental Section
SENSI and PKSP
The SENSI and PKSP webtools were developed using the Shiny package based on previously reported R scripts.15,16,53 Here, we incorporated a new method, NNSC,51,52 into PKSP.
Database and Client Software of SpinLIMS
SpinLIMS was developed in MySQL. It integrated previously reported data from SpinAssign46 and SpinCouple.47 In addition, it newly implemented NMR spectra for solid-state CP-MAS and solution-state in DMSO/pyridine and MeOD solvents. The SpinLIMS client software was developed with Java.
SpinMacro, InterAnalysis, SpinAssign, and SpinCouple
SpinMacro and InterAnalysis were developed in HTML, PHP, JavaScript, and MySQL. SpinAssign46 and SpinCouple47 were completely re-implemented within the program and were connected to the SpinLIMS database to run within InterSpin.
Evaluation of Benchtop NMR Signal Assignment Performance by SENSI and PKSP
To evaluate the performance of SENSI and PKSP, we used 1H-NMR data of mixtures of 10 standard compounds (Two kinds of compositions: Supporting Information Table S1), 40 fish-based food mixtures (Supporting Information Table S2) and 11 standard compounds (Supporting Information Table S3) measured by benchtop 60 MHz NMR (Nanalysis, Alberta, Canada). All NMR spectra were phased , baseline corrected and spectral aligned by the Mnova software (Mestrelab Research, A Coruña, Spain). The aligned data was normalized to the root of the sum of the squared value of all variables for a given data. In case of mixtures of 10 standard compounds, we analyzed by PKSP (four algorithms such as NNSC, NMF, MCR-ALS, FastICA). In case of analysis of 51 samples of 40 fish foods and 11 standard compounds, we used NNSC method in KSPS with 17 components. In addition, the computational speed of PKSP (four methods of NNSC, NMF, MCR-ALS, FastICA in the number of components of each data number) was evaluated using the similarly processed spectra from198 plants and algae biomass measured by 500 MHz 13C CP-MAS (Bruker Biospin, Rheinstetten, Germany).
Evaluation of Macromolecular Assignment by SpinMacro with SENSI and PKSP
To evaluate the molecular attribution strategy of SpinMacro using SENSI and PKSP, we used the previously reported CP-MAS spectrum of E. gracilis(14) and spectra of standard compounds (paramylon, peptide, and lipid). Their NMR spectra were conducted phased and baseline correcttion. Then, all spectra were aligned by the Mnova software. The aligned data was normalized to the root of the sum of the squared value of all variables for a given data. Subsequently, we analyzed by SINSI and PKSP (NNSC method, three components) using processed data.
Comparison of Small-Molecule Assignment by InterAnalysis, SpinAssign, and SpinCouple
To evaluate the performance of InterAnalysis, HSQC and 2D-Jres peaks in a 700 MHz NMR (Bruker Biospin, Rheinstetten, Germany) spectra of body muscle extract of A. flavimanus were assigned molecules by InterAnalysis, SpinAssign, and SpinCouple.
Acknowledgments
The authors thank Feifei Wei, Yuuri Tuboi, Tomoko Matsumoto, Kenji Sakata, and Akiyo Tei (RIKEN) for their support with NMR data acquisition and handling. S.Y. was supported by the RIKEN Junior Research Associate Program and young researcher travel expenses grant of the Nuclear Magnetic Resonance Society of Japan in this research period. This work was partially supported by the Agriculture, Forestry and Fisheries Research Council.
Supporting Information Available
The Supporting Information is available free of charge on the ACS Publications website at DOI: 10.1021/acsomega.8b02714.
Main functionalities of InterSpin; list of samples; “determining the number of components by RSS and DW plots; (a) FastICA, (b) MCR-ALS, (c) NMF, and (d) NNSC” (Figure S1); “comparison of the component spectrum separated by different algorithms and the standard spectrum; (a) alanine, (b) leucine, (c) lysine, (d) phenylalanine, (e) proline, (f) threonine, (g) valine, (h) malate, (i) glucose, and (j) sucrose” (Figure S2); “comparison of concentration ratios and separated spectral score ratios of mixtures 1 and 2; concentration ratio of mixtures 1 and 2 and the score ratio of the spectrum separated by each algorithm (NNSC, NMF, MCR-ALS, and FastICA) are shown” (Figure S3); “sensitivity improvement with spectral integration (SENSI) result for integrated 51 fish spectra of fish extracts obtained by benchtop 60 MHz NMR; (a) picked peaks and (b) CV” (Figure S4); “PKSP results of spectrum from Figure S5a using the NNSC method; (a) RSS plot, (b) DW plot, (c) plot of scores for different components, and (d) plot of loadings for different components” (Figure S5); “result of separating one spectrum of 2D-Jres from A. flavimanus (Yellowfin goby) body muscle extracts in D2O by PKSP; as a result of peak separation using PKSP’s MCR-ALS algorithm, it was separated into three components of singlet (red), doublet (black), and triplet (multiplet, green)” (Figure S6); “SpinMacro assignment results of peaks picked by SENSI of the previously reported solid-state CP-MAS spectra of E. gracilis and standards (paramylon, peptide, and lipid)” (Figure S7); “signal separation by NNSC of PKSP from E. gracilis CP-MAS spectrum; (a) RSS plot shows that there are three main components; (b) separated spectra of paramylon, peptide, and lipid” (Figure S8); “schematic diagram of SpinLIMS; (a) SpinLIMS is a relational database based on NMR spectra and molecular information; (b) SpinLIMS services are provided to users from the MySQL server via InterSpin (http://dmar.riken.jp/interspin/)” (Figure S9); “diagram showing the relationship among different entities on the SpinLIMS database; (a) core entities or “tables” within the relational database, (b) the complete relationship among all entities (tables)” (Figure S10); “result of InterAnalysis for HSQC and 2D-Jres peaks from A. flavimanus body muscle extracted in deuterated potassium phosphate (KPi)” (Figure S11); “list of compounds in mixtures 1 and 2” (Table S1); “list of 40 fish samples” (Table S2); “list of standard compounds” (Table S3); “improvement of signal-to-noise ratio by SENSI” (Table S4) (PDF)
Author Contributions
The manuscript was written through contributions of all authors. All authors have given approval to the final version of the manuscript. S.Y., E.C., and J.K. designed this study and wrote the article. S.Y. implemented InterSpin, SpinLIMS, InterAnalysis, SpinMacro code, and the web server with great help from A.K., Y.Y., E.C., and J.K. PKSP code was implemented by K.I.
The authors declare no competing financial interest.
Supplementary Material
References
- Perez-Riverol Y.; Bai M.; Leprevost F. D.; Squizzato S.; Park Y. M.; Haug K.; Carroll A. J.; Spalding D.; Paschall J.; Wang M. X.; Del-Toro N.; Ternent T.; Zhang P.; Buso N.; Bandeira N.; Deutsch E. W.; Campbell D. S.; Beavis R. C.; Salek R. M.; Sarkans U.; Petryszak R.; Keays M.; Fahy E.; Sud M.; Subramaniam S.; Barbera A.; Jimenez R. C.; Nesvizhskii A. I.; Sansone S. A.; Steinbeck C.; Lopez R.; Vizcaino J. A.; Ping P.; Hermjakob H. Discovering and linking public omics data sets using the Omics Discovery Index. Nat. Biotechnol. 2017, 35, 406–409. 10.1038/nbt.3790. [DOI] [PMC free article] [PubMed] [Google Scholar]
- Wishart D. S. Emerging applications of metabolomics in drug discovery and precision medicine. Nat. Rev. Drug Discovery 2016, 15, 473–484. 10.1038/nrd.2016.32. [DOI] [PubMed] [Google Scholar]
- Ramprasad R.; Batra R.; Pilania G.; Mannodi-Kanakkithodi A.; Kim C. Machine learning in materials informatics: recent applications and prospects. npj Comput. Mater. 2017, 3, 54. 10.1038/s41524-017-0056-5. [DOI] [Google Scholar]
- Kikuchi J.; Yamada S. NMR window of molecular complexity showing homeostasis in superorganisms. Analyst 2017, 142, 4161–4172. 10.1039/C7AN01019B. [DOI] [PubMed] [Google Scholar]
- Kikuchi J.; Ito K.; Date Y. Environmental metabolomics with data science for investigating ecosystem homeostasis. Prog. Nucl. Magn. Reson. Spectrosc. 2018, 104, 56–88. 10.1016/j.pnmrs.2017.11.003. [DOI] [PubMed] [Google Scholar]
- Rosato A.; Tenori L.; Cascante M.; De Atauri Carulla P. R.; Martins Dos Santos V. A. P.; Saccenti E. From correlation to causation: analysis of metabolomics data using systems biology approaches. Metabolomics 2018, 14, 37. 10.1007/s11306-018-1335-y. [DOI] [PMC free article] [PubMed] [Google Scholar]
- Rodriguez-Martinez A.; Posma J. M.; Ayala R.; Harvey N.; Jimenez B.; Neves A. L.; Lindon J. C.; Sonomura K.; Sato T. A.; Matsuda F.; Zalloua P.; Gauguier D.; Nicholson J. K.; Dumas M. E. J-Resolved 1H NMR 1D-projections for large-scale metabolic phenotyping studies: Application to blood plasma analysis. Anal. Chem. 2017, 89, 11405–11412. 10.1021/acs.analchem.7b02374. [DOI] [PubMed] [Google Scholar]
- Wruck W.; Kashofer K.; Rehman S.; Daskalaki A.; Berg D.; Gralka E.; Jozefczuk J.; Drews K.; Pandey V.; Regenbrecht C.; Wierling C.; Turano P.; Korf U.; Zatloukal K.; Lehrach H.; Westerhoff H. V.; Adjaye J. Multi-omic profiles of human non-alcoholic fatty liver disease tissue highlight heterogenic phenotypes. Sci. Data 2015, 2, 150068 10.1038/sdata.2015.68. [DOI] [PMC free article] [PubMed] [Google Scholar]
- Shiokawa Y.; Date Y.; Kikuchi J. Application of kernel principal component analysis and computational machine learning to exploration of metabolites strongly associated with diet. Sci. Rep. 2018, 8, 3426 10.1038/s41598-018-20121-w. [DOI] [PMC free article] [PubMed] [Google Scholar]
- Sugahara H.; Odamaki T.; Fukuda S.; Kato T.; Xiao J. Z.; Abe F.; Kikuchi J.; Ohno H. Probiotic Bifidobacterium longum alters gut luminal metabolism through modification of the gut microbial community. Sci. Rep. 2015, 5, 13548 10.1038/srep13548. [DOI] [PMC free article] [PubMed] [Google Scholar]
- Kato T.; Fukuda S.; Fujiwara A.; Suda W.; Hattori M.; Kikuchi J.; Ohno H. Multiple omics uncovers host-gut microbial mutualism during prebiotic fructooligosaccharide supplementation. DNA Res. 2014, 21, 469–480. 10.1093/dnares/dsu013. [DOI] [PMC free article] [PubMed] [Google Scholar]
- Mekuchi M.; Sakata K.; Yamaguchi T.; Koiso M.; Kikuchi J. Trans-omics approaches used to characterise fish nutritional biorhythms in leopard coral grouper (Plectropomus leopardus). Sci. Rep. 2017, 7, 9372 10.1038/s41598-017-09531-4. [DOI] [PMC free article] [PubMed] [Google Scholar]
- Tomita S.; Saito K.; Nakamura T.; Sekiyama Y.; Kikuchi J. Rapid discrimination of strain-dependent fermentation characteristics among Lactobacillus strains by NMR-based metabolomics of fermented vegetable juice. PLoS One 2017, 12, e0182229 10.1371/journal.pone.0182229. [DOI] [PMC free article] [PubMed] [Google Scholar]
- Komatsu T.; Kobayashi T.; Hatanaka M.; Kikuchi J. Profiling planktonic biomass using element-specific, multicomponent nuclear magnetic resonance spectroscopy. Environ. Sci. Technol. 2015, 49, 7056–7062. 10.1021/acs.est.5b00837. [DOI] [PubMed] [Google Scholar]
- Wei F.; Ito K.; Sakata K.; Date Y.; Kikuchi J. Pretreatment and integrated analysis of spectral data reveal seaweed similarities based on chemical diversity. Anal. Chem. 2015, 87, 2819–2826. 10.1021/ac504211n. [DOI] [PubMed] [Google Scholar]
- Ito K.; Sakata K.; Date Y.; Kikuchi J. Integrated analysis of seaweed components during seasonal fluctuation by data mining across heterogeneous chemical measurements with network visualization. Anal. Chem. 2014, 86, 1098–1105. 10.1021/ac402869b. [DOI] [PubMed] [Google Scholar]
- Ogura T.; Date Y.; Masukujane M.; Coetzee T.; Akashi K.; Kikuchi J. Improvement of physical, chemical, and biological properties of aridisol from Botswana by the incorporation of torrefied biomass. Sci. Rep. 2016, 6, 28011 10.1038/srep28011. [DOI] [PMC free article] [PubMed] [Google Scholar]
- Watanabe T.; Shino A.; Akashi K.; Kikuchi J. Chemical profiling of Jatropha tissues under different torrefaction conditions: application to biomass waste recovery. PLoS One 2014, 9, e106893 10.1371/journal.pone.0106893. [DOI] [PMC free article] [PubMed] [Google Scholar]
- Mori T.; Tsuboi Y.; Ishida N.; Nishikubo N.; Demura T.; Kikuchi J. Multidimensional high-resolution magic angle spinning and solution-state NMR characterization of C-13-labeled plant metabolites and lignocellulose. Sci. Rep. 2015, 5, 11848 10.1038/srep11848. [DOI] [PMC free article] [PubMed] [Google Scholar]
- Bundy J. G.; Davey M. P.; Viant M. R. Environmental metabolomics: a critical review and future perspectives. Metabolomics 2009, 5, 3–21. 10.1007/s11306-008-0152-0. [DOI] [Google Scholar]
- Wei F.; Sakata K.; Asakura T.; Date Y.; Kikuchi J. Systemic homeostasis in metabolome, ionome, and microbiome of wild yellowfin goby in estuarine ecosystem. Sci. Rep. 2018, 8, 3478 10.1038/s41598-018-20120-x. [DOI] [PMC free article] [PubMed] [Google Scholar]
- Ogawa D. M. O.; Moriya S.; Tsuboi Y.; Date Y.; Prieto-da-Silva A. R. B.; Radis-Baptista G.; Yamane T.; Kikuchi J. Biogeochemical typing of paddy field by a data-driven approach revealing sub-systems within a complex environment – A pipeline to filtrate, organize and frame massive dataset from multi-omics analyses. PLoS One 2014, 9, e110723 10.1371/journal.pone.0110723. [DOI] [PMC free article] [PubMed] [Google Scholar]
- Yoshida S.; Date Y.; Akama M.; Kikuchi J. Comparative metabolomic and ionomic approach for abundant fishes in estuarine environments of Japan. Sci. Rep. 2014, 4, 7005 10.1038/srep07005. [DOI] [PMC free article] [PubMed] [Google Scholar]
- Asakura T.; Date Y.; Kikuchi J. Comparative analysis of chemical and microbial profiles in estuarine sediments sampled from Kanto and Tohoku regions in Japan. Anal. Chem. 2014, 86, 5425–5432. 10.1021/ac5005037. [DOI] [PubMed] [Google Scholar]
- Hashi K.; Ohki S.; Matsumoto S.; Nishijima G.; Goto A.; Deguchi K.; Yamada K.; Noguchi T.; Sakai S.; Takahashi M.; Yanagisawa Y.; Iguchi S.; Yamazaki T.; Maeda H.; Tanaka R.; Nemoto T.; Suematsu H.; Miki T.; Saito K.; Shimizu T. Achievement of 1020 MHz NMR. J. Magn. Reson. 2015, 256, 30–33. 10.1016/j.jmr.2015.04.009. [DOI] [PubMed] [Google Scholar]
- Halse M. E. Perspectives for hyperpolarisation in compact NMR. TrAC, Trends Anal. Chem. 2016, 83, 76–83. 10.1016/j.trac.2016.05.004. [DOI] [Google Scholar]
- Aslam N.; Pfender M.; Neumann P.; Reuter R.; Zappe A.; de Oliveira F. F.; Denisenko A.; Sumiya H.; Onoda S.; Isoya J.; Wrachtrup J. Nanoscale nuclear magnetic resonance with chemical resolution. Science 2017, 357, 67–71. 10.1126/science.aam8697. [DOI] [PubMed] [Google Scholar]
- Tayler M. C. D.; Theis T.; Sjolander T. F.; Blanchard J. W.; Kentner A.; Pustelny S.; Pines A.; Budker D. Invited Review Article: Instrumentation for nuclear magnetic resonance in zero and ultralow magnetic field. Rev. Sci. Instrum. 2017, 88, 091101 10.1063/1.5003347. [DOI] [PubMed] [Google Scholar]
- Blümich B. Virtual special issue: Magnetic resonance at low fields. J. Magn. Reson. 2017, 274, 145–147. 10.1016/j.jmr.2016.10.005. [DOI] [PubMed] [Google Scholar]
- Blümich B.; Singh K. Desktop NMR and its applications from materials science to organic chemistry. Angew. Chem., Int. Ed. 2018, 57, 6996–7010. 10.1002/anie.201707084. [DOI] [PubMed] [Google Scholar]
- Giraudeau P.; Massou S.; Robin Y.; Cahoreau E.; Portais J. C.; Akoka S. Ultrafast quantitative 2D NMR: an efficient tool for the measurement of specific isotopic enrichments in complex biological mixtures. Anal. Chem. 2011, 83, 3112–3119. 10.1021/ac200007p. [DOI] [PubMed] [Google Scholar]
- Wu H.; Southam A. D.; Hines A.; Viant M. R. High-throughput tissue extraction protocol for NMR- and MS-based metabolomics. Anal. Biochem. 2008, 372, 204–212. 10.1016/j.ab.2007.10.002. [DOI] [PubMed] [Google Scholar]
- Lin C. Y.; Wu H. F.; Tjeerdema R. S.; Viant M. R. Evaluation of metabolite extraction strategies from tissue samples using NMR metabolomics. Metabolomics 2007, 3, 55–67. 10.1007/s11306-006-0043-1. [DOI] [Google Scholar]
- Sekiyama Y.; Chikayama E.; Kikuchi J. Evaluation of a semipolar solvent system as a step toward heteronuclear multidimensional NMR-based metabolomics for 13C-labeled bacteria, plants, and animals. Anal. Chem. 2011, 83, 719–726. 10.1021/ac102097u. [DOI] [PubMed] [Google Scholar]
- Sekiyama Y.; Chikayama E.; Kikuchi J. Profiling polar and semipolar plant metabolites throughout extraction processes using a combined solution-state and high-resolution magic angle spinning NMR approach. Anal. Chem. 2010, 82, 1643–1652. 10.1021/ac9019076. [DOI] [PubMed] [Google Scholar]
- Kim H.; Ralph J. Solution-state 2D NMR of ball-milled plant cell wall gels in DMSO-d6/pyridine-d5. Org. Biomol. Chem. 2010, 8, 576–591. 10.1039/B916070A. [DOI] [PMC free article] [PubMed] [Google Scholar]
- Wishart D. S.; Feunang Y. D.; Marcu A.; Guo A. C.; Liang K.; Vázquez-Fresno R.; Sajed T.; Johnson D.; Li C.; Karu N.; Sayeeda Z.; Lo E.; Assempour N.; Berjanskii M.; Singhal S.; Arndt D.; Liang Y.; Badran H.; Grant J.; Serra-Cayuela A.; Liu Y.; Mandal R.; Neveu V.; Pon A.; Knox C.; Wilson M.; Manach C.; Scalbert A. HMDB 4.0: The human metabolome database for 2018. Nucleic Acids Res. 2018, 46, D608–D617. 10.1093/nar/gkx1089. [DOI] [PMC free article] [PubMed] [Google Scholar]
- Ulrich E. L.; Akutsu H.; Doreleijers J. F.; Harano Y.; Ioannidis Y. E.; Lin J.; Livny M.; Mading S.; Maziuk D.; Miller Z.; Nakatani E.; Schulte C. F.; Tolmie D. E.; Kent Wenger R.; Yao H.; Markley J. L. BioMagResBank. Nucleic Acids Res. 2008, 36, D402–D408. 10.1093/nar/gkm957. [DOI] [PMC free article] [PubMed] [Google Scholar]
- Ludwig C.; Easton J. M.; Lodi A.; Tiziani S.; Manzoor S. E.; Southam A. D.; Byrne J. J.; Bishop L. M.; He S.; Arvanitis T. N.; Günther U. L.; Viant M. R. Birmingham Metabolite Library: a publicly accessible database of 1-D 1H and 2-D 1H J-resolved NMR spectra of authentic metabolite standards (BML-NMR). Metabolomics 2012, 8, 8–18. 10.1007/s11306-011-0347-7. [DOI] [Google Scholar]
- Cui Q.; Lewis I. A.; Hegeman A. D.; Anderson M. E.; Li J.; Schulte C. F.; Westler W. M.; Eghbalnia H. R.; Sussman M. R.; Markley J. L. Metabolite identification via the Madison Metabolomics Consortium Database. Nat. Biotechnol. 2008, 26, 162–164. 10.1038/nbt0208-162. [DOI] [PubMed] [Google Scholar]
- Kuhn S.; Schlorer N. Facilitating quality control for spectra assignments of small organic molecules: nmrshiftdb2 – A free in-house NMR database with integrated LIMS for academic service laboratories. Magn. Reson. Chem. 2015, 53, 582–589. 10.1002/mrc.4263. [DOI] [PubMed] [Google Scholar]
- Bingol K.; Zhang F.; Bruschweiler-Li L.; Brüschweiler R. TOCCATA: a customized carbon total correlation spectroscopy NMR metabolomics database. Anal. Chem. 2012, 84, 9395–9401. 10.1021/ac302197e. [DOI] [PMC free article] [PubMed] [Google Scholar]
- Bingol K.; Li D.; Zhang B.; Bruschweiler R. Comprehensive metabolite identification strategy using multiple two-dimensional NMR spectra of a complex mixture implemented in the COLMARm Web Server. Anal. Chem. 2016, 88, 12411–12418. 10.1021/acs.analchem.6b03724. [DOI] [PMC free article] [PubMed] [Google Scholar]
- Kale N. S.; Haug K.; Conesa P.; Jayseelan K.; Moreno P.; Rocca-Serra P.; Nainala V. C.; Spicer R. A.; Williams M.; Li X.; Salek R. M.; Griffin J. L.; Steinbeck C. MetaboLights: An open-access database repository for metabolomics data. Curr. Protoc. Bioinf. 2016, 53, 14.13.1–14.13.18. 10.1002/0471250953.bi1413s53. [DOI] [PubMed] [Google Scholar]
- Xia J.; Wishart D. S. Using MetaboAnalyst 3.0 for comprehensive metabolomics data analysis. Curr. Protoc. Bioinf. 2016, 55, 14.10.1–14.10.91. 10.1002/cpbi.11. [DOI] [PubMed] [Google Scholar]
- Chikayama E.; Sekiyama Y.; Okamoto M.; Nakanishi Y.; Tsuboi Y.; Akiyama K.; Saito K.; Shinozaki K.; Kikuchi J. Statistical indices for simultaneous large-scale metabolite detections for a single NMR spectrum. Anal. Chem. 2010, 82, 1653–1658. 10.1021/ac9022023. [DOI] [PubMed] [Google Scholar]
- Kikuchi J.; Tsuboi Y.; Komatsu K.; Gomi M.; Chikayama E.; Date Y. SpinCouple: Development of a web tool for analyzing metabolite mixtures via two-dimensional J-resolved NMR database. Anal. Chem. 2016, 88, 659–665. 10.1021/acs.analchem.5b02311. [DOI] [PubMed] [Google Scholar]
- Kikuchi J.; Ogata Y.; Shinozaki K. ECOMICS: ECosytem trans-OMICS tools and methods for complex environmental samples and datasets. J. Ecosys. Ecogr. 2011, S2, 001 10.4172/2157-7625.S2-001. [DOI] [Google Scholar]
- Dashti H.; Westler W. M.; Tonelli M.; Wedell J. R.; Markley J. L.; Eghbalnia H. R. Spin system modeling of nuclear magnetic resonance spectra for applications in metabolomics and small molecule screening. Anal. Chem. 2017, 89, 12201–12208. 10.1021/acs.analchem.7b02884. [DOI] [PMC free article] [PubMed] [Google Scholar]
- Dashti H.; Wedell J. R.; Westler W. M.; Tonelli M.; Aceti D.; Amarasinghe G. K.; Markley J. L.; Eghbalnia H. R. Applications of parametrized NMR spin systems of small molecules. Anal. Chem. 2018, 90, 10646–10649. 10.1021/acs.analchem.8b02660. [DOI] [PMC free article] [PubMed] [Google Scholar]
- Toumi I.; Caldarelli S.; Torrésani B. A review of blind source separation in NMR spectroscopy. Prog. Nucl. Magn. Reson. Spectrosc. 2014, 81, 37–64. 10.1016/j.pnmrs.2014.06.002. [DOI] [PubMed] [Google Scholar]
- Toumi I.; Torrésani B.; Caldarelli S. Effective processing of pulse field gradient NMR of mixtures by blind source separation. Anal. Chem. 2013, 85, 11344–11351. 10.1021/ac402085x. [DOI] [PubMed] [Google Scholar]
- Misawa T.; Komatsu T.; Date Y.; Kikuchi J. SENSI: signal enhancement by spectral integration for the analysis of metabolic mixtures. Chem. Commun. 2016, 52, 2964–2967. 10.1039/C5CC09442A. [DOI] [PubMed] [Google Scholar]
- Bouveresse D. J. R.; Moya-Gonzalez A.; Ammari F.; Rutledge D. N. Two novel methods for the determination of the number of components in independent components analysis models. Chemom. Intell. Lab. Syst. 2012, 112, 24–32. 10.1016/j.chemolab.2011.12.005. [DOI] [Google Scholar]
- Chikayama E.; Yamashina R.; Komatsu K.; Tsuboi Y.; Sakata K.; Kikuchi J.; Sekiyama Y. FoodPro: A web-based tool for evaluating covariance and correlation NMR spectra associated with food processes. Metabolites 2016, 6, 36. 10.3390/metabo6040036. [DOI] [PMC free article] [PubMed] [Google Scholar]
- Komatsu T.; Kobayashi T.; Hatanaka M.; Kikuchi J. Profiling planktonic biomass using element-specific, multicomponent nuclear magnetic resonance spectroscopy. Environ. Sci. Technol. 2015, 49, 7056–7062. 10.1021/acs.est.5b00837. [DOI] [PubMed] [Google Scholar]
Associated Data
This section collects any data citations, data availability statements, or supplementary materials included in this article.


