Abstract
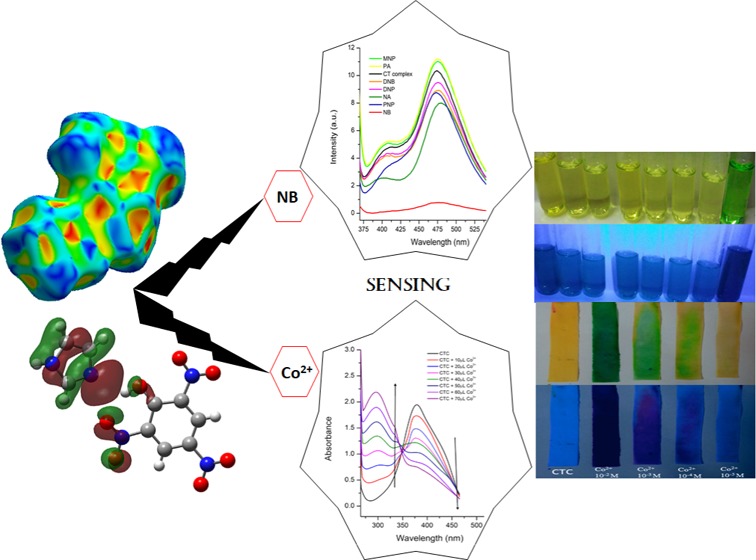
An exceptionally unique, easy-to-prepare, and economic charge transfer complex (CTC), [(IMH)+(PA)−], was synthesized as a highly selective real-time colorimetric chemosensor material for nitro explosive nitrobenzene (NB) and Co2+ ion. Co2+ and NB are highly potential toxic and hazardous beyond the exposure limits and also classified as carcinogens (group 2B) by IARS and United States Environmental Protection Agency. Unusual sensing ability with appreciatively low detection limits of 0.114 and 0.589 ppb for NB and Co2+ ion, respectively, in the aqueous medium of dimethyl sulfoxide has been reported for the first time among this class of complexes reported so far. The mechanism of the tremendous sensing behavior of this material as chemosensor was ascertained by static quenching mechanism, Dexter electron transfer, and Forster resonance energy transfer dynamic quenching mechanism, which was supported by spectral overlapping and density functional theory (DFT) (B-3LYP/def2-SVP) calculations. Real-time colorimetric sensing behavior of chemosensor was demonstrated by the naked eye test and prestained paper Co2+ strip test. Job’s plot and comparative Fourier transform infrared (FTIR) study between CTC and CTC–Co2+ complex revealed the coordination mode between CTC and Co2+ ion and 2:1 stoichiometry. This sensing material [(IMH)+(PA)−] was synthesized with donor imidazole (IM) and acceptor picric acid (PA), and its characterization was achieved by experimental (single-crystal X-ray diffraction, thermal gravimetric analysis–differential thermal analysis, FTIR, and UV–vis studies) and theoretical methods [DFT/TD-DFT calculations, comparing experimental–theoretical data and obtaining MEP map along with electronic energy gap of HOMO → LUMO (ΔE = 3.545 eV) and Hirshfeld surfaces analysis]. The SC-XRD confirms the composition and bonding features, which show hydrogen bond via N+–H···O– between IM and PA. This N+–H···O– interaction plays a significant role in Co2+ binding, proving this method of synthesizing CTC as a chemosensor to be a novel approach.
1. Introduction
Nitrobenzene (NB) is a toxic industrial chemical used as a precursor for explosives, pesticides, and synthetic rubbers, as well as for preparation of dyes and pharmaceuticals.1 NB can easily be inhaled, ingested, and penetrated through the skin. Being a highly toxic chemical, it could cause methemoglobinemia; hemolytic anemia; splenic congestion; liver, bone marrow, and spleen hematopoiesis; and diseases of the central nervous system (CNS).2,3 The United States Environmental Protection Agency and IARC considered and classified NB as a group 2B carcinogen for humans. Apart from being a vitamin B12 component and an essential trace element, excess Co2+ has toxic effects and may cause severe problems to health like cardiomyopathy, hypothyroidism, peripheral neuropathy, and respiratory disorders.4 Co2+ is also determined as carcinogenic to humans by IARC.5 Considering these toxic effects of NB and Co2+, it is a topic of concern to develop a real-time highly selective and sensitive sensor that can detect them in the presence of other nitroaromatic compounds and heavy-metal ions, respectively, even by the naked eye. Many sensors based on metal-organic frameworks (MOFs)6,7 and organic frameworks8,9 have been reported, but charge transfer complexes (CTCs) as chemosensors is an emerging field to explore, and very few CTCs for this purpose have been reported.10,11 Owing to the easy synthetic route, low cost, and good luminescent behavior, there is a perceived need to design CT complex to be employed as a potent sensor toward nitro explosive and toxic metal ions. Charge transfer complex is a complexation between an electron-rich moiety (donor) and electron-deficient moiety (acceptor) through weak hydrogen bonding like interaction (N+—H···O –), which was introduced and described by Mulliken and Foster.12−14 The CTCs formed are usually intensely colored due to electronic transitions.15,16 Apart from sensors, CTCs have inordinate importance and applications in different fields like photocatalysts,17,18 redox processes,19 organic semiconductors,20 microemulsion,21,22 dendrimers,23 second-order nonlinear optical activity,24 and biological systems (drug action: antibacterial, antifungal, and insecticides).25−28
In this paper, a new charge transfer complex is synthesized, characterized, and its real-time sensing ability toward nitro explosives and heavy-metal ions have been reported. Respective CTC is a result of interaction between imidazole (electron donor) and picric acid (electron acceptor) through hydrogen-bonding network. Imidazole ring is incorporated in many biological molecules29 and used as pharmaceutical derivatives in antibiotic and antifungal drugs.30 Similarly, picric acid has also been used as antiseptic for treatment of malaria, smallpox, herpes, and trench foot.31
Our primary objective is to explore the sensing ability of the synthesized material in aqueous dimethyl sulfoxide (DMSO) medium. Fluorescence quenching method was employed to descry sensed analytes, and selective discriminative sensing behavior was examined through cross-titration fluorescence experiment. The mechanism of sensing was discovered, and the Stern–Volmer (S–V) equation, quenching efficiencies, and detection limits were investigated. Static quenching mechanism was studied through the changes in the absorption spectra of CTC, Dexter electron transfer (DET) dynamic quenching mechanism was also satisfied by DFT calculations at the B3LYP/6-31G** basis set level, and Forster resonance energy transfer (FRET) dynamic quenching mechanism was evidenced by spectral overlapping. Real-time colorimetric sensing was observed by the naked eye. Job’s method along with Fourier transform infrared (FTIR) spectroscopy reveals the coordination mode between CTC and Co2+. Prestained paper Co2+ strip was also prepared. Stability of CTC was confirmed by powder XRD and solid–liquid-phase UV–vis spectra. Moreover, structural properties, thermodynamic stability, intermolecular interactions, spectral studies, and solvent dependence of synthesized material were investigated by FTIR, thermal gravimetric analysis–differential thermal analysis (TGA–DTA), Hirshfeld surface analysis, and UV–vis studies. Furthermore, confirmation of CTC formation via hydrogen bonding (N+—H···O –) was also achieved by single-crystal X-ray diffraction. These experimental data were cross-checked by TD-DFT B-3LYP/def2-SVP level theoretical calculations.
2. Results and Discussion
2.1. Instrumental Characterization
2.1.1. FTIR Spectra
FTIR spectrum of CTC [(IMH)+(PA)−] is compared to the spectra of donor (IM) and acceptor (PA) for the deliberation of obtained FTIR results shown in Figure S1, Supporting Information. From the spectra for IM, PA, and CTC, it was found that O–H and C–N stretching vibrations appear at 3430 and 1446 cm–1, respectively, in PA and IM; on the other hand, O–H and C–N stretching bands are observed at 3443 and 1496 cm–1 in the spectrum of CTC. A new band in the range 3443–3340 cm–1 appears to be attributed to the stretching vibration of N+—H···O–, which designates hydrogen bonding. Majority of the bands of CTC were shifted to higher frequencies compared to those of IM, while shifted toward lower frequencies as those of PA.
2.1.2. Electronic Spectra and Solvent Dependence
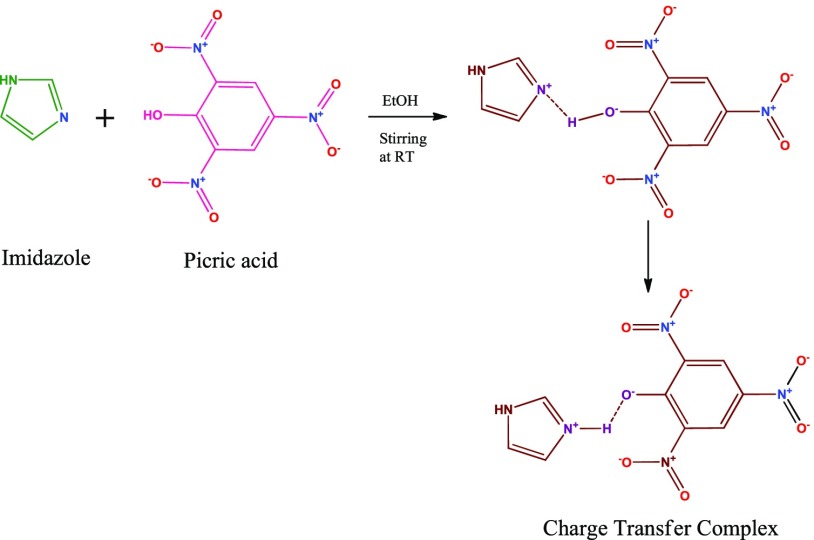
The electronic spectra of the IM, PA, and CTC were recorded in the ultraviolet region 200–500 nm in ethanol, methanol, acetonitrile, and DMSO/3H2O separately (Figure S2, Supporting Information). The solutions of concentration 1 × 10⁻⁴ M were prepared for IM and PA in all respective solvents and UV spectra were obtained. The maximum absorption in CT complex was observed at 353 nm in ethanol, 355 nm in methanol, 362 nm in acetonitrile, and 378 nm in DMSO/H2O as a result of n → π* transition (Scheme 1). This study indicates that the formation of CTC depends on the polarity of the solvent, and other important physical parameters can also be calculated, which were achieved in our previous studies.41−45
Scheme 1. Mechanism of the Reaction.
2.1.3. Thermograms Study
TG/DTA was conducted for free moieties (IM and PA) and their CTC [(IMH)+(PA)−] to investigate their thermal stability and also the interaction between IM and PA (Figure S3, Supporting Information). Table S2, Supporting Information, shows important data of thermograms. DTA of [(IMH)+(PA)−] shows two endothermic peaks and one exothermic peak at 87.08 °C (ΔH = −189.10 mJ), 214.15 °C (ΔH = −176.82 mJ), and 303.49 °C (ΔH = −354.0 mJ), respectively, whereas IM (donor) shows two endothermic peaks observed at 96.61 °C (ΔH = −371.74 mJ) and 219.09 °C (ΔH = −526.18 mJ), and three endothermic peaks were observed at 121.49 °C (ΔH = −276.04 mJ), 240.95 °C (ΔH = −386.48 mJ), and 281.40 °C (ΔH = – 430.63 mJ) in DTA of PA (acceptor). TGA of [(IMH)+(PA)−] gives decomposition at 314.27 °C (as for midpoints) with the weight loss of 81.98%. IM decomposes at 199.93 °C (as for midpoints) with weight losses of almost 99.92%, and PA was decomposed at 274.44 °C (as for midpoints) with weight losses of 99.26%. From this discussion and observation, it was concluded that the synthesized [(IMH)+(PA)−] is thermodynamically more stable than free reactant moieties. Also, divergences in thermogram of [(IMH)+(PA)−] was noted from IM and PA, which assures the formation of [(IMH)+(PA)−].46
2.2. X-ray Crystallographic Studies of CT Complex
For the better understanding of the structure along with the bonding features of the synthesized CTC [(IMH)+(PA)−], single-crystal X-ray diffraction method has been employed. The crystal structure of CTC formed among IM and PA divulges that the empirical formula of synthesized CTC is “C9H7N5O7·0.5H2O”, which assembles stable crystal lattice through H-bonding between N5 (protonated) of IM and O1 (deprotonated) of PA with a distance of 2.097 Å. The crystal packing of [(IMH)+(PA)−] is represented in Figure S4, Supporting Information. The ORTEP view of the CTC consisting of IMH+ cation and PA– anion is shown in Figure 1. The formation of the N—H···O bond between IM and PA results in the shift of bond lengths (BL) of other atoms as well from that of free IM and PA. The bond lengths N5–N4, N5–H7, and N5–H9 in free IM were recorded to be 2.197, 2.007, and 2.064 Å, respectively, while in [(IMH)+(PA)−], they were obtained as 2.185, 2.010, and 2.027 Å, respectively. Similarly, free PA bond lengths H1–C–, H1–C2, H1–N1, H1–O2, O1–C6, O1–O7, and C2–C6 were recorded to be 1.856, 2.431, 2.390, 1.732, 2.368, 2.602, and 2.359 Å, respectively, while in [(IMH)+(PA)−], they were obtained as 1.708, 2.389, 2.472, 2.075, 2.379, 2.689, and 2.403, Å respectively (Figure 1). This shift in bond lengths is due to the transfer of electron and hence the formation of N+—H···O– bond between free moieties. This confirms the formation of CTC through proton transfer from free IM to free PA. The crystal data with refinement parameters for [(IMH)+(PA)−] are given in Table S1, Supporting Information and bond lengths in Table 1.
Figure 1.
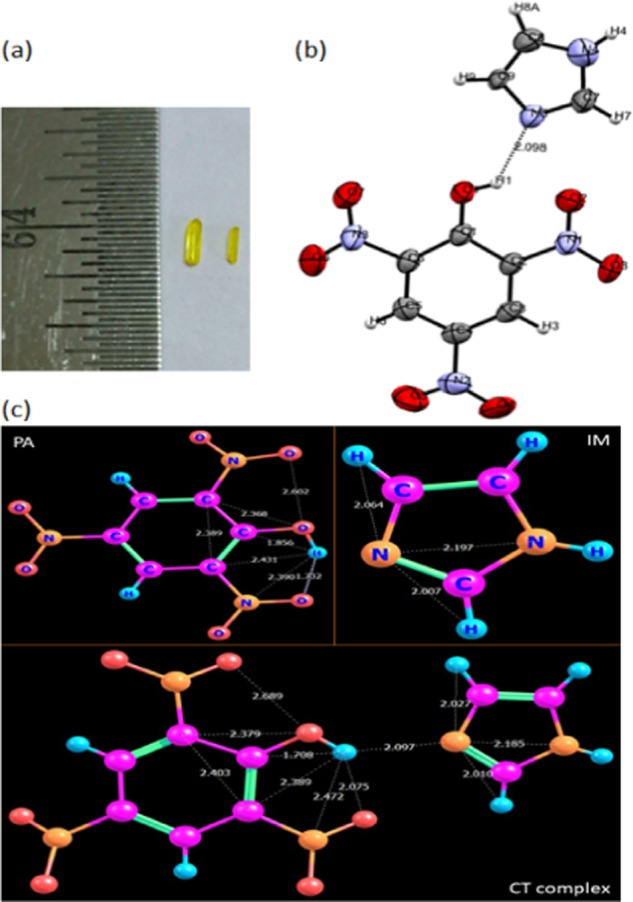
(a). Photographic image of obtained crystal, (b) ortep view showing hydrogen bonding network between the donor and acceptor moieties of CT complex, and (c) optimized structure of IM, PA, and CTC showing change in bond lengths.
Table 1. Bond Lengths in Crystal of Charge Transfer Complex.
| atom1 | atom2 | bond length |
|---|---|---|
| O2 | N1 | 1.2246 |
| C1 | C2 | 1.4538 |
| C1 | C6 | 1.4488 |
| C1 | O1 | 1.2503 |
| N3 | C6 | 1.4596 |
| N3 | O7 | 1.229 |
| N3 | O6 | 1.1908 |
| N1 | C2 | 1.4583 |
| N1 | O3 | 1.2221 |
| O4 | N2 | 1.2225 |
| N2 | O5 | 1.2133 |
| N2 | C4 | 1.4533 |
| C5 | H5 | 0.9297 |
| C5 | C6 | 1.3747 |
| C5 | C4 | 1.3762 |
| C2 | C3 | 1.3705 |
| C3 | H3 | 0.9303 |
| C3 | C4 | 1.382 |
| O1 | H1 | 0.82 |
| C9 | H9 | 0.9303 |
| C9 | C8 | 1.3153 |
| C9 | N5 | 1.3399 |
| C8 | H8A | 0.9308 |
| C8 | N4 | 1.363 |
| N4 | H4 | 0.8601 |
| N4 | C7 | 1.361 |
| C7 | H7 | 0.9307 |
| C7 | N5 | 1.3224 |
2.3. Fluorescence Property with Detection of NB
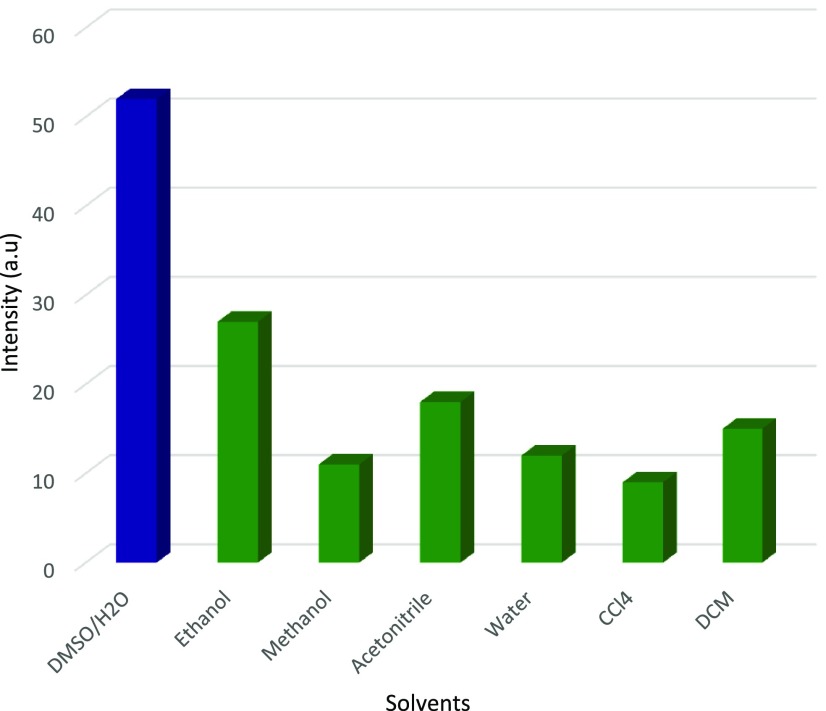
Fluorescence of CTC was recorded in different solvents as the local environment along with solvent polarity has insightful effects on fluorophore’s emission spectral property.47 The fluorescence intensity was observed to be very intense in the aqueous medium of DMSO with the ratio 1:3 (DMSO:3H2O) (Figure 2, S5, Supporting Information). DMSO/H2O has been opted as a common dispersive solvent for both CTC and analytes, as it is well known that the aqueous medium of DMSO possesses nonideal thermodynamic and transport behaviors.48 On excitation at 350 nm, emission at 479 nm was observed for CTC in DMSO/H2O medium. Thus, the sensing behavior of CTC in the aqueous medium of DMSO was examined for explosive nitroaromatics (NACs) and metal ions.
Figure 2.
Emission spectrum of CTC dispersed in different solvents upon excitation at 340 nm.
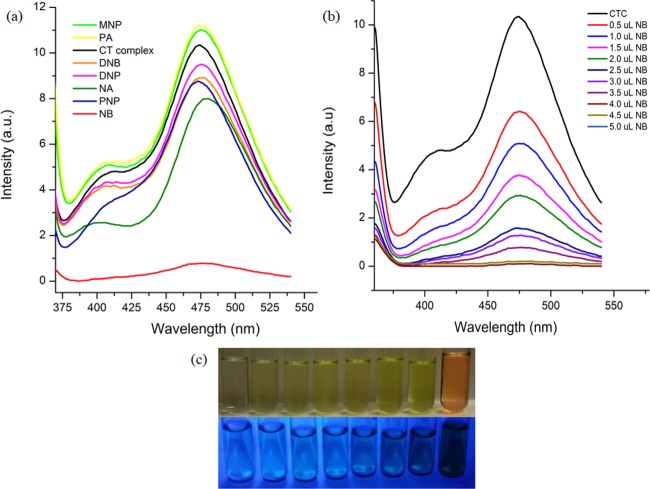
Fluorescence titration was conducted for different nitroaromatics, NB (nitrobenzene), m-DNB (1,3-dinitrobenzene), ONP (2-nitrophenol), ONA (2-nitroaniline), MNA (3-nitroaniline), DNP (2,4-dinitrophenylhydrazine), TNP (2,4,6-trinitrophenol), DNT (2,4-dinitrotoluene), NT (4-nitrotoluene), and p-DNB (1,4-dinitrobenzene) by progressive addition of accurately measured 1 mM solutions. Among all of the NACs used, nitrobenzene showed a remarkable fall in fluorescence intensity of CTC on gradual addition (Figure 3). This experiment surveys the sensing capability of CTC for different nitroaromatics. Incredibly, 99.04% of fluorescence quenching to the initial intensity was observed on adding 1.145 ppb of NB. However, fluorescence quenching of about 38.08% was recorded even in the very low concentration of NB, that is, on adding 0.114 ppb, which is almost the highest value recorded for other NB-sensing materials of charge transfer complexes.2,49 On the other hand, no or negligible fluorescence quenching to the initial intensity was obtained for other NACs—m-DNB, ONP, ONA, MNA, DNP, and TNP (Figures 3 and S6, Supporting Information). To confirm that CTC, as a whole, is responsible for sensing of NB and not the individual free reactants (IM and PA), the same fluorescence titration experiment was conducted for NB with free IM and PA independently. It was clearly observed that there was no or negligible quenching in the case of both free donor and acceptor, which confirms that the sensing of NB is caused by the charge transfer complex as a whole (Figure S7, Supporting Information). To explore the selective discriminative sensing behavior of CTC toward NB, cross-titration fluorescence experiment was performed and it was found that other NACs have no effect on the fluorescence quenching of NB, as no quenching of intensity can be seen on the initial addition of other NACs, while a notable quenching can be observed after adding NB (Figure S8, Supporting Information). This evidently concludes the interaction between NB and CTC supporting the exceedingly selective sensing behavior of CTC toward NB.
Figure 3.
(a). Change in fluorescence intensity of CTC upon addition of different NACs. (b) Change in fluorescence intensity of CTC upon incremental addition of NB. (c) Digital photographs of CTC solutions in the presence of different NACs under normal light (top) and under portable UV light (bottom).
UV–vis spectra of CTC were recorded in solid state and are found to be identical (same λmax value) with the UV–vis spectra of CTC in solution (DMSO/H2O) ascertaining the stability of the CTC in the dissolved state. (Figure S9, Supporting Information).50 The powder X-ray diffraction (P-XRD) patterns have been procured through Panalytical X’Pert PRO diffractometer with Cu anode material with radiations as Kα1 (λ = 1.540 Å), Kα2 (λ = 1.544 Å), and Kβ (λ = 1.392 Å). The P-XRD of CTC was recorded to confirm the phase purity of the synthesized CTC. Identical P-XRD patterns of CTC were recorded for with and without NB, which is in a decent agreement with the simulated P-XRD pattern confirming the structural reliability and phase purity of the CTC. This discovers no degradation of the CTC after submerging in NB (Figure S10, Supporting Information).
2.3.1. Mechanistic Insights
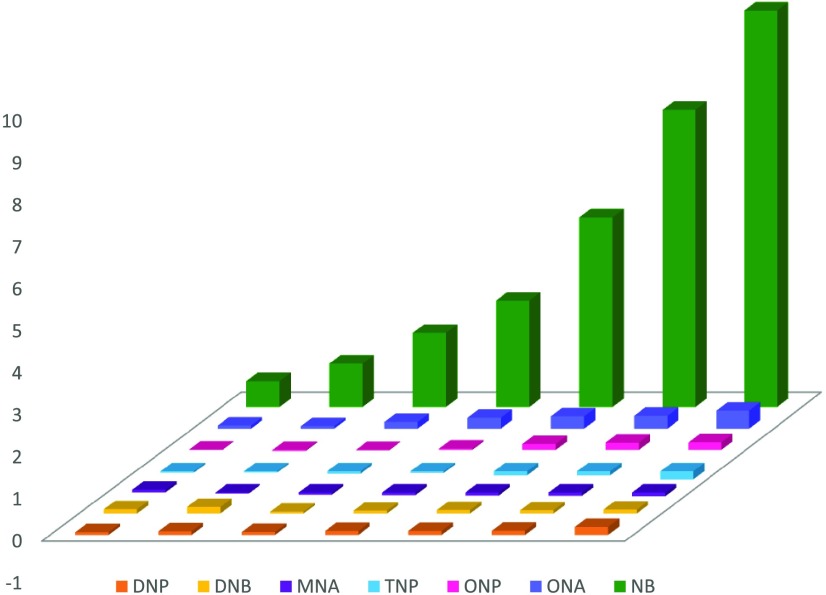
To investigate the cause behind the mechanism of quenching for selective sensing of NB, all of the NACs were employed to Stern–Volmer (S–V) equation and the quenching efficiencies were calculated.51 NACs except NB showed linear drifts in the S–V plots, whereas for NB, the S–V plots showed upward linear incensement on increased concentrations (Figure S11, Supporting Information). A 3D presentation of the S–V plots of CTC for various NACs is shown in Figure 4. Linear fitting to the S–V plot of NB was employed, and the quenching constant was calculated to be 6.49 × 10³ (R2 = 0.88171), which indicates the tremendous quenching abilities of CTC toward NB in the aqueous medium of DMSO.
Figure 4.
Three-dimensional (3D) representation of the Stern–Volmer (SV) plots of CTC for various NACs.
To understand the static quenching mechanism, we analyzed the changes in the absorption spectra of CTC on adding NACs individually. In the case of NB, a new band appears at 274 nm. It can also be seen that on gradual addition of NB, the absorbance of this band increases (Figure 5).2 This change in UV–vis spectra indicates the interaction between CTC and NB with the formation of a nonemissive ground-state complex, which is an agreement assuring the static mechanism of quenching, whereas no significant change was observed in the spectra of other NACs (Figure S12, Supporting Information).
Figure 5.
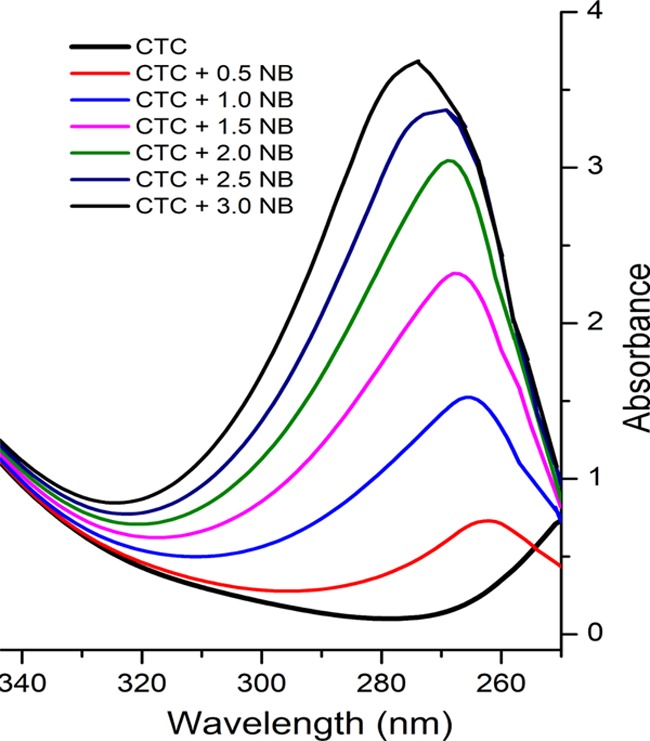
UV–vis spectra of CTC upon gradual addition of NB showing spectral change with the appearance of a new band at 274 nm.
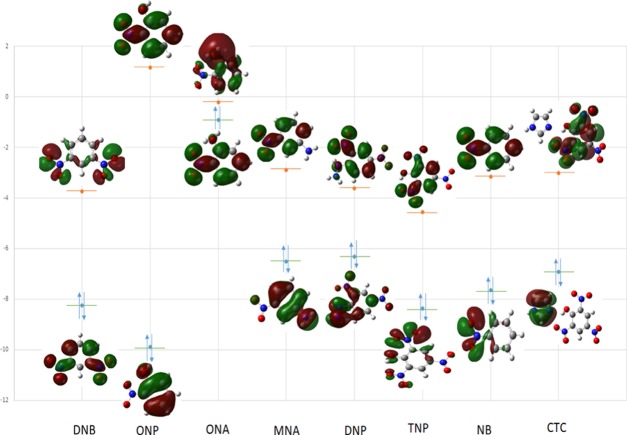
The electron can also be transferred through the nonradiative pathway, which is termed as the Dexter electron transfer (DET) dynamic quenching mechanism by Dexter.52 The HOMO and LUMO energies of CTC (electron-rich) and all NACs (electron-deficient) were calculated by DFT calculations at the B3LYP/6-31G** basis set level (Figures 6 and 7). LUMO energy = −3.005 eV and HOMO energy = −6.911 eV for CTC, and for NB, LUMO energy = −3.149 eV and HOMO energy = −7.636 eV were obtained (Table S3, Supporting Information). This DFT result concludes that electron can easily be transferred from LUMO orbit (excited-state electron) of CTC to the LUMO orbit of NB satisfying the Dexter electron transfer dynamic quenching mechanism. On studying the LUMO energies of other NACs, it was noted that the obtained quenching efficiency of these NACs experimentally was not in the sequence. This clearly designates that the DET mechanism is not the only mechanism behind the quenching of intensity.53 Forster resonance energy transfer (FRET), an important dynamic quenching mechanism, also plays an important role in the nonradiative transfer. To prove the FRET mechanism, the UV–vis spectra for all of the NACs were recorded (Figure 8). Only NB showed the maximum overlapping of UV–vis spectra with the emission spectra of CTC. However, it was negligible or little for the other NACs, which confirms that both FRET and DET dynamic quenching mechanisms are responsible for the selective fluorescence quenching with NB while for other NACs, only DET dynamic quenching mechanism causes fluorescence quenching.54 Further, vapor pressure of analyte also plays an important role in sensing. The vapor pressure of NB is the highest among all of the analytes examined, and therefore, NB shows discriminating behavior among all of the nitro explosives investigated for sensing.55 Chromogenic change was observed by the naked eye in normal light as well as in UV only on addition of NB in CTC, i.e., pale yellow to orange (Figure 3).
Figure 6.
HOMO and LUMO energy levels of the molecular orbitals considered for the nitro analytes and the ligand.
Figure 7.
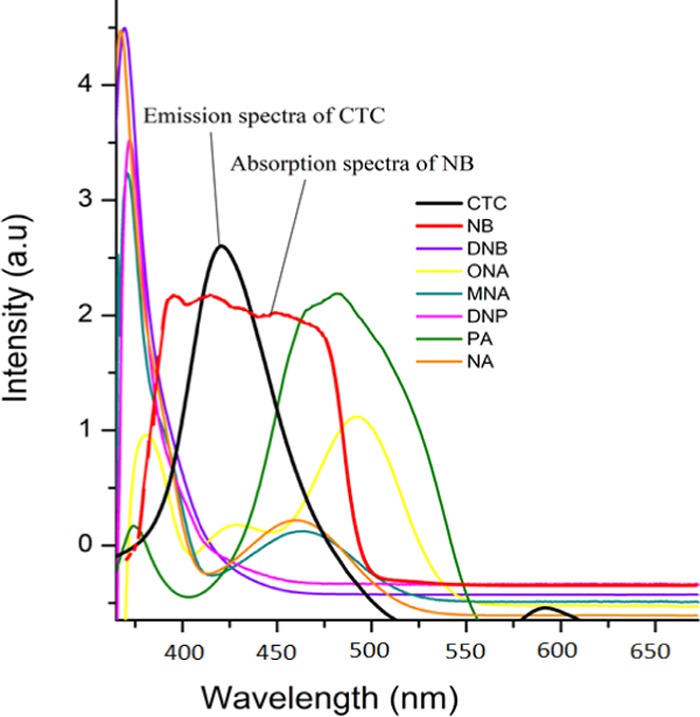
Spectral overlap between the normalized emission spectra of CTC and normalized absorbance spectra of the nitro analytes.
Figure 8.
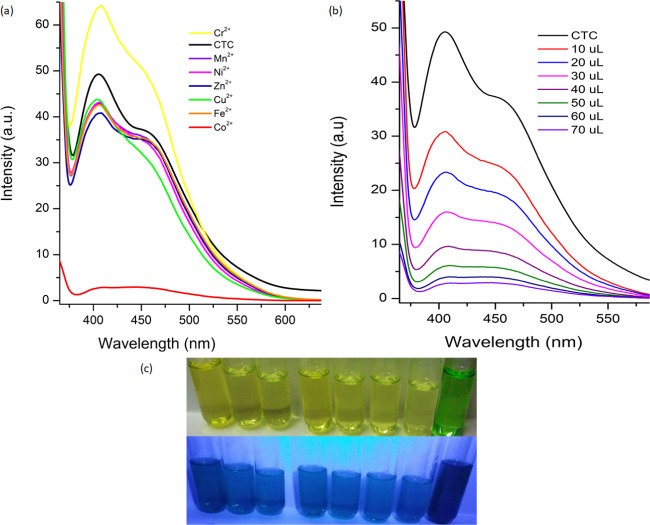
(a) Change in fluorescence intensity of CTC upon addition of different metal ions. (b) Change in fluorescence intensity of CTC upon incremental addition of Co2+. (c) Digital photographs of CTC solutions in the presence of different metal ions under normal light (top) and under portable UV light (bottom).
The detection limit was calculated for used 0.5–5.0 μL, 1 mM stock solution of NB, fluorescence intensities were plotted against the increased concentrations of NB, the slope (m) of graph was determined, and the standard deviation (r) was calculated from five blank measurements of CTC (Figure S13, Tables S4 and S5, Supporting Information). Using the formula of detection limit = (3σ/m) (where σ is the standard deviation and m is the slope), the detection limit of CTC for NB was calculated and found to be 2.78 × 10⁻³ μM (0.112 ppb).
2.3.2. Detection of Co2+
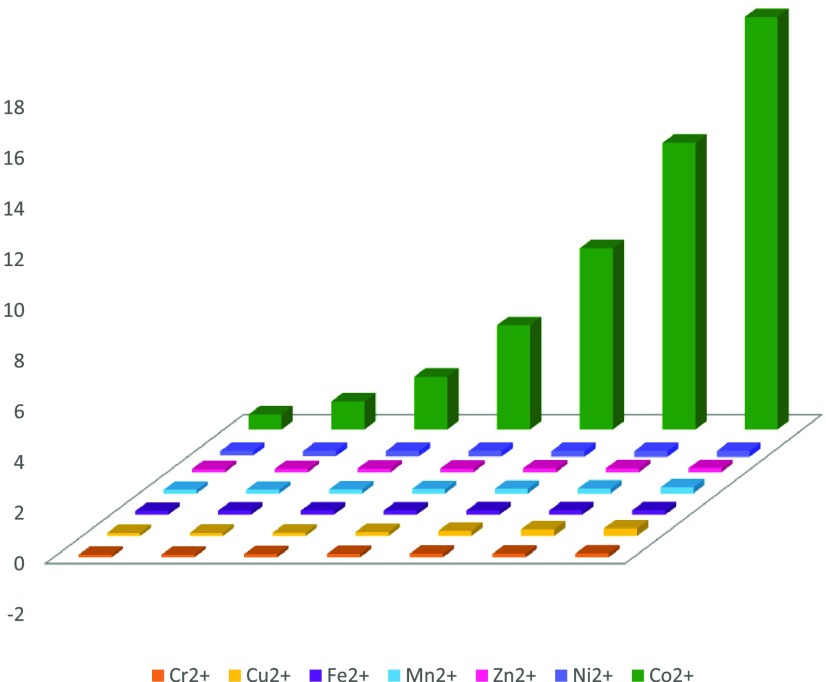
Sensing ability of CTC was also determined for some heavy-metal ions—Cr2+, Mn2+, Fe2+, Co2+, Ni2+, Cu2+, Zn2+, Ca2+, Li+, Na+, and K+ (chloride salts of metal ion). A similar fluorescence titration experimental approach was established, and about 94.15% of fluorescence quenching to the initial intensity was observed on adding 4.125 ppb of Co2+. However, fluorescence quenching of about 37.36% was recorded even in the very low concentration of Co2+, i.e., 0.589 ppb (Figures 8 and S14, Supporting Information).56 While performing this experiment with individual free reactants (IM and PA), it was clearly observed that there was no or negligible quenching in the case of both free donor and acceptor, which confirms that the sensing of Co2+ is caused by the charge transfer complex as a whole (Figure S15, Supporting Information). Cross-titration fluorescence experiment confirms selective discriminative sensing behavior of CTC toward Co2+. No effect on the fluorescence quenching of Co2+ was recorded even in the presence of other selected metal ions supporting anti-interference ability (Figure S16, Supporting Information). The Stern–Volmer (S–V) equation and the quenching efficiencies were estimated for all of the metal ions (Figures 9 and S17, Supporting Information).51 The S–V plots of Co2+ showed upward linear incensement on increased concentrations unlike other metal ions with linear drifts. Linear fitting to the S–V plot of Co2+ was employed, and the quenching constant was calculated and found to be 1.11 × 10³ (R2 = 0.85439), which indicates the tremendous quenching abilities of CTC toward Co2+ in the aqueous medium of DMSO.
Figure 9.
Three-dimensional (3D) representation of the Stern–Volmer (S–V) plots of CTC for various metal ions.
The UV–vis spectra for all of the metal ions were measured separately (Figure S18, Supporting Information). A new peak with blue-shifted λmax by 82 nm was observed at 296 nm only in the case of Co2+ (Figure 10). The change in the color of CTC solution from yellow to green on adding Co2+ was clearly observed by the naked eye (Figure 8). This phenomenon endorses the decrease in charge transfer effect between IM and PA moieties, owing to the strongly weakened electron-donating ability of N atom in IM and OH group in PA upon coordination to Co2+. While Fe2+ also makes the absorption peak blue-shifted by 7 nm, the change in color of CTC solution was not observed and thus cannot be clearly distinguished by the naked eye.10 Illumination of UV light using a UV lamp shows that the CTC can also act as a fluorescence turn-off probe for Co2+ with a decent selectivity.
Figure 10.
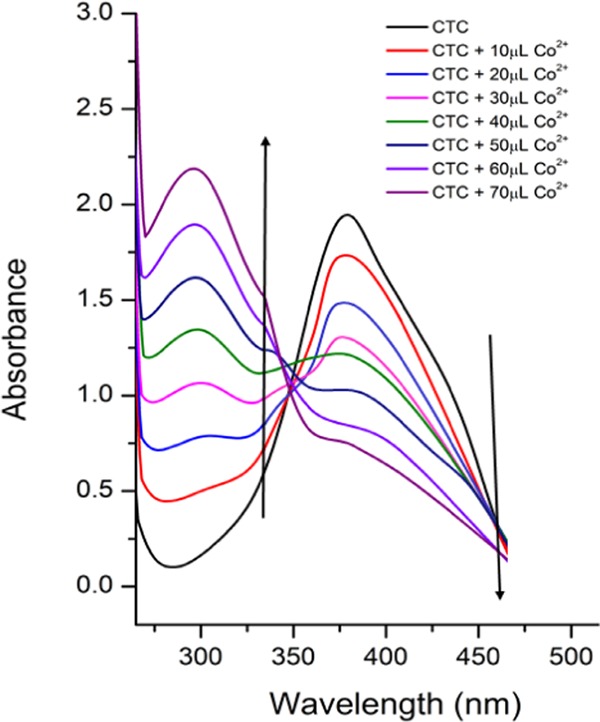
UV–vis spectra of CTC upon gradual addition of Co2+ showing spectral change with the appearance of a new band at 296 nm.
2.3.3. Coordination Mode
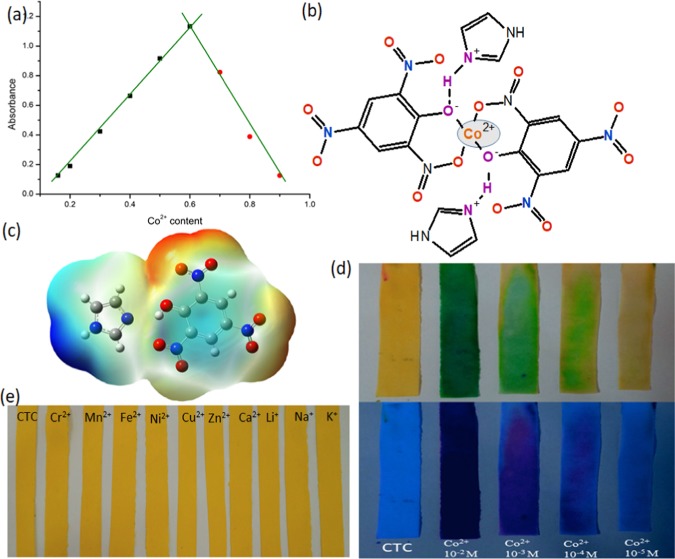
After confirming selectivity of the CTC, it is important to scrutinize the coordination mode between CTC and Co2+ to study the recognition nature of CTC to Co2+. Job’s method was applied to investigate the binding stoichiometry between CTC and Co2+. Different solutions of CTC and Co2+ with different ratios were prepared so that the total concentration of CTC and Co2+ remains unchanged. The absorption spectrum was recorded for each of the different solutions. From the attained results of UV–vis spectra, Job’s plot was obtained (Figure 11). The stoichiometry of the complex (CTC–Co2+) was obtained to be 2:1 from the results of Job’s plot. The proposed structure of the CTC–Co2+ complex is represented in Figure 11.5,57 FTIR spectra of crystalline charge transfer complex and CTC–Co2+ complex were recorded (Figure S19, Supporting Information).58 The O–H band of CTC (PA moiety) has shifted to a higher frequency 3450 cm–1 from 3443 cm–1 in the CTC–Co2+ complex. C–N and C=N stretching frequencies of CTC have also shifted from 1435 to 1486 cm–1 and from 1496 to 1486 cm–1, respectively. Most importantly, the band at 3340 cm–1 attributing to N+—H···O– has shifted to lower frequency at 3278 cm–1, confirming that charge transfer interaction between IM-PA forming [(IMH)+(PA)−] plays a vital role in coordination mode between Co2+ and CTC. The metal-ligand frequency at 420 cm–1 was also found, which supports the presence of Co2+–N bond. To confirm this site of binding of Co2+, electron density surface of CTC was obtained through DFT-6-31G** basis set. The red surface around the NO2 and OH (involved in CT interaction) group indicates the binding site for Co2+ ions (Figure 11). DFT calculation was also conducted for CTC–Co2+ complex. The electronic energy gap (ΔE) of HOMO → LUMO is found to be 1.861 eV, which is less than ΔE of CTC (discussed later). Molecular electrostatic potential map (MEP) of CTC–Co2+ complex has also been represented. The red region on the MEP surface represents the most electronegative potentials, while the blue regions represent positive electrostatic potential and the green regions represent the neutral sites (Figure 12).
Figure 11.
(a). Job’s plot of CTC to Co2+, (b) proposed structure of CTC–Co2+ complex, (c) electron density (red surface) located around the NO2 and OH may facilitate the binding site for Co2+, (d) naked eye detection of Co2+ by the paper strip in colorimetric (top) and fluorescent modes (bottom), and (e) paper strip detection for other metal ions.
Figure 12.
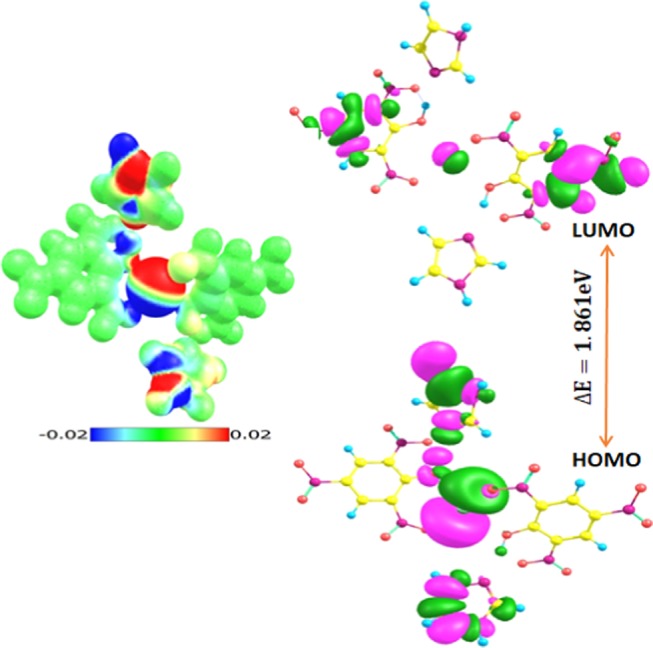
Molecular electrostatic potential map (MEP) of (CTC–Co2+) complex (left) and frontier molecular orbital of (CTC–Co2+) complex showing energy gap.
2.3.4. Co2+ Strip
As we have confirmed the selectivity and sensitivity of synthesized CTC toward Co2+ in colorimetric as well as in fluorescent modes, even though sometimes it is not always suitable to use solution mode analysis. A paper substrate engraved with CTC can be used for fabricating Co2+ strip. Now tremendous probability can be achieved by CTC to sense Co2+ (as pH strip works). For the preparation of Co2+ strip, a piece of filter paper was engrossed into the solution of CTC for about 1 min and dried over warm air.10 These prepared strips were submerged in different concentrations of Co2+ (for 1 s), and immediate change in color was observed by the naked eye in normal as well as in UV light illuminated by UV lamp. The detection limit from this method was observed up to the level of 1 × 10⁻⁴ M. The various concentrations of Co2+ give different results in both colorimetric and fluorescence modes (Figure 11). A similar experiment was also performed for other metal ions solutions of 10–2 M concentration, and no change in color was observed (Figure 11).
2.3.5. Effect of pH on CTC
The performance of CTC was tested in various pH environments. The fluorescence signal of CTC solution before (F0) and after (F) addition of Co2+ was separately recorded (Figure 13), and the ratio of F0/F demonstrated obvious contrast with value more than 5 in the pH range of 5–8, manifesting that the probe can work well in this range. Too acidic environment may protonate the pyrrole moiety, which reduces the coordination ability, and too basic environment may reduce the free Co2+ ions in solution and influence the sensitivity.59
Figure 13.
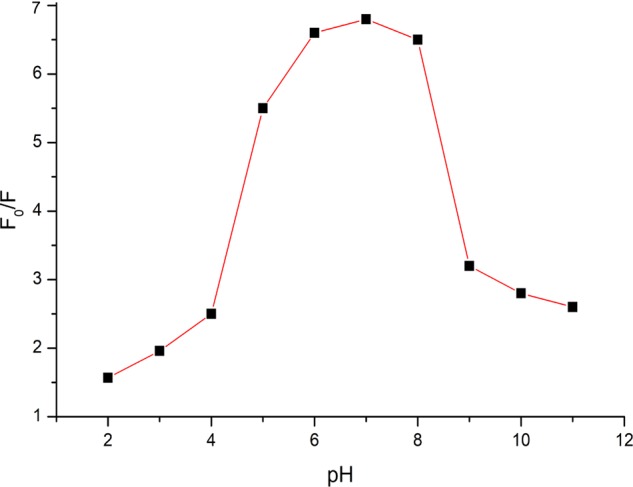
Performance of CTC versus pH environment.
The detection limit was calculated for used 10–70 μL, 1 mM stock solution of Co2+, and fluorescence intensities were plotted against the increased concentrations of Co2+. The slope (m) of the graph was determined, and the standard deviation (r) was calculated from five blank measurements of CTC (Figure S20, Tables S6 and S7, Supporting Information). Using the formula of detection limit = (3σ/m), the detection limit of CTC for Co2+ was calculated and found to be 7.68 × 10⁻³ μM (0.589 ppb).
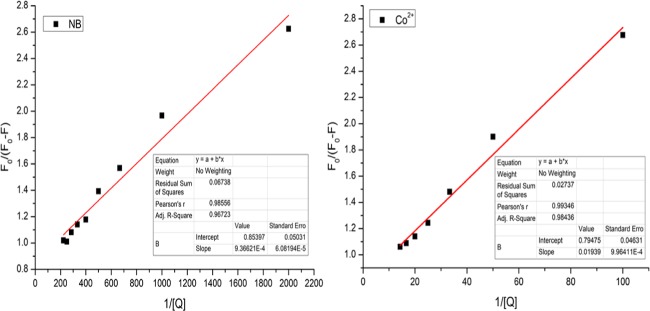
2.4. Binding Constant for NB and Co2+
For calculating binding constants of analytes, the fluorescence data were further examined by using the modified Stern–Volmer equation (MSV)60
where F0 is the fluorescence intensity before the addition of quencher (NB/Co2+), F is the fluorescence intensity after the addition of quencher, [Q] is the concentration of quencher, and Ka denotes the binding constant of molecule, which can be calculated from the slope and intercept, as shown in Figure 14. The calculated binding constants for NB and Co2+ were found to be 911.69 and 40.98 M–1 respectively.
Figure 14.
Modified Stern–Volmer plots for the quenching of NB (left) and Co2+ (right).
2.5. Hirshfeld Surface Analyses
The region where the molecule endowment to the crystal electron density outstrips that from all other crystal molecules, i.e., w(r) ≥ 0.5, is the Hirshfeld surface in a crystal.61 These regions of the CTC are described in Figure S21, Supporting Information, where the mapped surfaces ranging from −0.5 to 1.5 Å dnorm have been shown. The transparent surfaces help envision the moieties around which they were inspected. The hydrogen-bonding contacts are indicated by deep red depressions and notable on the dnorm surfaces. The assertive interactions between C–H····π, C–H····H, C–O····C, and N–O····H for the CTC are presented in the Hirshfeld surface plots and shown with red spots. The prominent information about the Hirshfeld surfaces decomposition is provided by 2D fingerprint plots (Figure S22, Supporting Information), where two distinct spikes show N–O····H intermolecular interaction, which are of unequal lengths in the region 2.32 Å < (de + di) < 2.34 Å and are displayed by the blue pattern in the full fingerprint 2D plots. Close contacts of particular pair atoms were also highlighted in fingerprint plots. Different types of interactions were separated for better understanding.
2.6. DFT Studies
2.6.1. Optimized Structure and Mulliken Atomic Charges
An MM2 method has been practiced for energy minimization of free moieties (IM and PA) and their synthesized CT complex [(IMH)+(PA)−]. DFT-B3LYP calculations of Gaussian-0.3 software were applied for obtaining full-energy optimization of the [(IMH)+(PA)−]. The stabilization total energies of free moieties (IM and PA) were −223.49 and −910.67 a.u., respectively, while for synthesized [(IMH)+(PA)−], it was −1125.57 a.u., which approves the higher stability of the [(IMH)+(PA)−]. On account of Mulliken charges, it was concretely evident that there is an increase in negative charge on O1 atom of [(IMH)+(PA)−] to 0.705816e from 0.341228e of free PA, which is due to the dissociation of O1–H1 bond in [(IMH)+(PA)−]. Furthermore, the positive charge on the H1 atom of [(IMH)+(PA)−] is expressively decreased to 0.370607e from 0.455639e of free PA because of proton transferred to N5 atom by increasing its negative atomic charge moderately to 0.281933e from 0.273359 of free IM. The large availability of charge on O1 = −0.705816e suggests the formation of N+—H···O–-type interaction in this system, which was also confirmed by SC-XRD results. Apart from these, other atoms of [(IMH)+(PA)−] also show the shift in Mulliken charges from free IM and PA. These shifts provide a strong confirmation of the CT and proton transfer interaction between IM and PA tabularized in Table 2. A similar conclusion has been drawn in other studies.62,63 Molecular electrostatic potential map (MEP) of [(IMH)+(PA)−] has been calculated using B3LYP/6-31G** calculations. The different colors on the MEP surface refer to the strength of the electrostatic potentials as red and blue regions, which symbolize the most electronegative and positive electrostatic potential, respectively, while the green regions represent the neutral sites (Figure S23, Supporting Information). The attractive blue region is located at the electronegative atoms of donor PA, while the repulsive red region is located on the aromatic ring of PA and IM.
Table 2. Mulliken Atomic Charges of CTC Atoms.
| atom | CT complex | picric acid | atom | CT complex | imidazole |
|---|---|---|---|---|---|
| O2 | –0.20807 | –0.41471 | C9 | –0.04421 | –0.06331 |
| C1 | 0.24449 | 0.51.16 | H9 | 0.10061 | 0.24463 |
| N3 | 0.17641 | 0.26474 | C8 | 0.00417 | 0.06145 |
| N1 | 0.16163 | 0.03121 | H8 | 0.10215 | 0.26753 |
| O4 | –0.20027 | –0.37736 | N4 | –0.35954 | –0.89758 |
| N6 | 0.170899 | 0.21323 | H4 | 0.27681 | 0.35157 |
| O5 | –0.17089 | –0.37320 | C7 | 0.10752 | 0.38473 |
| C5 | –0.05862 | –0.084 | H7 | 0.11551 | 0.27335 |
| H5 | 0.15008 | 0.36485 | N5 | –0.28193 | –0.62419 |
| C2 | 0.04866 | 0.23496 | |||
| C3 | –0.05744 | –0.0842 | |||
| H3 | 0.15006 | 0.36046 | |||
| C6 | 0.06892 | 0.24848 | |||
| O6 | –0.19809 | –0.40075 | |||
| C4 | 0.08287 | 0.24826 | |||
| O1 | –0.70581 | –0.34122 | |||
| H1 | 0.37061 | 0.45563 | |||
| O3 | –0.18592 | –0.33672 | |||
| O7 | 0.20078 | –0.35423 |
2.6.2. TD-DFT Calculations
Experimental electronic absorption spectra of [(IMH)+(PA)−] presented broad absorption band with λmax at 353 nm in ethanol, 355 nm in methanol, 362 nm in acetonitrile, and 378 nm in DMSO/H2O. UV–vis spectra were investigated by the TD-DFT method with the basis set as 6-31G**, and it was observed that two electronic absorption bands at 333 and 388 nm were obtained from TD-DFT computations. The experimentally broad absorption band of [(IMH)+(PA)−] is a combination of two absorption transitions at 333 and 388 nm with the average value at 360 nm (Figure S24, Supporting Information). FTIR spectrum was also investigated by the DFT method and found quite identical to experimental spectra (Figure S25, Supporting Information). The computed UV–vis absorption bands at 333 and 388 nm are assigned to HOMO → LUMO and HOMO – 1 → LUMO, respectively. The electronic energy gap of HOMO → LUMO is procured to be ΔE = 3.545 eV, and that of HOMO – 1 → LUMO + 1 is 4.3786 eV, from frontier molecular orbitals (Figure S26, Supporting Information). It can also be said that the occupied and virtual MOs are located on the acceptor moiety, and subsequently, the experimentally electronic absorption bands are mainly intramolecular charge transfer in nature. The MO diagram is shown in Figure S27 (Supporting Information), and MO energies are tabularized in Table S8 (Supporting Information). Thus, the result can be described in terms of increased electron density on PA moiety of [(IMH)+(PA)−] and hydrogen-bonding interactions between IM with PA.
3. Conclusions
We have successfully synthesized a bifunctional aqueous medium sensing material for nitrobenzene and Co2+ ion. The incredibly low detection limits of 0.114 and 0.589 ppb for nitrobenzene and Co2+ ion, respectively, were obtained, which have not yet been discovered in any other organic CTC sensor so far in the literature. The obtained detection limits are impressively below the permissible limit set by NIOSH, US EPA, and WHO. Fluorescence titration experiment was performed to investigate the sensing behavior of the synthesized material. UV–vis spectroscopy studies assure the static mechanism of quenching in low concentration, while DFT calculations at the B3LYP/6-31G** basis set level and CTC emission–analyte and absorption spectral overlap confirm the Dexter electron transfer (DET) and Forster resonance energy transfer (FRET) dynamic quenching mechanism in high concentration. Naked eye color change of solution was very prominent in both the cases (NB and Co2+) in normal as well as in UV light. The prepared Co2+ strip reveals that the detection limit of Co2+ can reach up to the level of 1 × 10⁻⁴ M using this method. To explore the coordination mode between CTC and Co2+ ion, Job’s plot along with comparative FTIR spectra were studied and 2:1 stoichiometry (2CTC:Co2+) was obtained. The N+–H···O– interaction in CTC, which is the base of formation of this sensing material, was found to play a key role in binding of Co2+, making CTC chemosensor novel.
For characterization of prepared sensing material [(IMH)+(PA)−], single-crystal X-ray diffraction was employed to confirm the composition and bonding features. N+–H···O– interaction between IM and PA was also confirmed by SC-XRD. FTIR spectroscopy, UV–vis spectrophotometry, and TGA–DTA also confirmed the formation of thermodynamically more stable CTC than free IM and PA moieties and the dependence of formation of CTC on the polarity of solvent used. The intermolecular interactions like C–H····π, C–H····H, and C–O····C along with N–O····H (spikes of almost equal length) were verified by the Hirshfeld surfaces analysis. The molecular electrostatic potential map along with the electronic energy gap of HOMO → LUMO (ΔE = 3.545 eV) and HOMO – 1 → LUMO + 1 (ΔE = 4.3786 eV) was obtained from Frontier molecular orbitals through TD-DFT calculations (DFT/B3LYP level). The present study advances the field of low-cost, easily reparable, and easy-to-use novel sensory materials in view of their synthesis, application, and the mechanism of detection. Spurred by the intriguing need to detect the hazardous explosive (nitrobenzene) and Co2+, the designed material would add new perspectives to the field of sensors. The sensor can further be studied and modified, and can be used to detect NB in drinking water and Co2+ in human blood serum an fecal samples.
4. Experimental Section
4.1. Materials and Synthesis of Stable CT Complex
All of the reagents, including imidazole (Aldrich) and picric acid (Merck), for synthesis were bought up commercially of analytical grade. All of the nitroaromatic compounds—NB (nitrobenzene), m-DNB (1,3-dinitrobenzene), ONP (2-nitrophenol), ONA (2-nitroaniline), MNA (3-nitroaniline), DNP (2,4-dinitrophenylhydrazine), TNP (2,4,6-trinitrophenol), DNT (2,4-dinitrotoluene), NT (4-nitrotoluene), and p-DNB (1,4-dinitrobenzene), and chloride salts of metal ion—chromium, manganese, iron, cobalt, nickel, copper, zinc, calcium, lithium, sodium, and potassium were from Sigma-Aldrich.
The CTC of imidazole (IM) with picric acid (PA) was synthesized by preparing the individual saturated solution of IM (0.35 g, 5 mmol) and PA (1.145 g, 5 mmol) in ethanol, followed by mixing these two saturated solutions. A clear solution is obtained upon mixing, which was stirred continuously for 1 h and left standing for 24 h at room temperature. Yellow powder like CT complex was formed in solution. This CTC was stained, washed numerous times with small amounts of solvent (ethanol), and dried in a desiccator (anhydrous calcium chloride). For crystal growth, the CTC obtained as precipitate was dissolved in the solvent (acetonitrile) and stirred for 4 h at 40 °C and filtered off, and the uncontaminated filtrate was then kept in a dust-free compartment for 4 days without disturbing. Yellow crystals were obtained (Figure 1).
4.2. Instrumental Characterization of Solid CTC
Fourier transform infrared (FTIR) spectroscopy of CTC was recorded along with IM and PA individually by employing spectroscopic 2020 FTIR spectrometer (KBr disk technique). The electronic absorption spectra of IM, PA, and CTC were obtained separately in different polar solvents (ethanol, methanol, acetonitrile, and DMSO/H2O) in the UV region of 200–500 nm, using a spectrophotometer—PERKINELMER UV Lambda-45. For obtaining the wavelength of CTC, the individual solution of PA and IM in the same solvent (1:1 ratio) was mixed and left overnight at room temperature without disturbing. For obtaining 1H NMR spectrum, Bruker Avance IT-400 (400 MHz) NMR spectrometer was used. TGA and DTA (thermogravimetric and differential thermal) analyses of the free moieties (IM and PA) and CTC were recorded, employing EXSTAR TG/DTA 6300 model as the instrument at the heating rate of 20 °C/min using nitrogen atmosphere with the flow rate of 0 [mL/min].
4.2.1. Single-Crystal X-ray Study
This is one of the finest approved methods to explore the structural and crystallographic data of the crystalline sample (CTC), for which Bruker SMARTAPEX as diffractometer (graphite—monochromatic of Kα, with k = 0.71073 Å) at 296 K was employed. Unit cell parameters, an important aspect to know the physical dimensions of CTC, were determined using the least-squares fit of 25 machine-centered reflections. Analytical absorption correction was used for Lorentz and polarization correction for the intensity data. Reflections were collected through empirical absorption correction using XPREP with SADABS.32,33 The structure was solved through SIR-92 and SHELXL 97 methods refined by full-matrix least-squares methods based on F2, minimizing the function ∑w(|Fo| – |Fc|)2; here, the calculated and observed structures were denoted by FC and FO, respectively. Interoperating the ideal geometries and with no further refinements, the position of hydrogen atoms was calculated, while anisotropic refinement was conducted for the calculation of all of the nonhydrogen atoms. The refined model is satisfactorily precise for the explanation of the structure of the complexes. The convergence was measured by the factors R and RW, where R = R∑ (||FO| – |FC||)/∑R|FO and RW = {∑[w(Fo2 – Fc2)2]}1/2. The bond lengths of free moieties (IM and PA) and their CT complex were compared. The experimental details of the crystal data, intensity measurements, and structure solution for CT complex are shown in Tables 1 and S1, Supporting Information. The publication CCDC No. of the crystal is 1887652.
4.2.2. Fluorescence Properties
Synthesized CTC of 10–4 M concentration solution was prepared in different solvents (dimethyl sulfoxide (DMSO)/3H2O, ethanol, methanol, acetonitrile, water, carbontetrachloride (CCl4), dichloromethane (DCM)) for conducting fluorescence using Instrument model F-2700 FL Spectrophotometer upon excitation of 350 nm, keeping a slit width of 20.0 nm for source as well as detector when dealing with NB, and 20.0 nm for source and 10.0 nm for detector when dealing with Co2+. Further, to record the change in intensity of fluorescence, incremental additions of the freshly prepared analyte solution in CTC solution were done.
4.3. Computational Details
4.3.1. TD/DFT Calculations
Gaussian 03 program34 was used for TD/TD-DFT calculations. The MM2 method was used for obtaining the energy-minimized structures of IM, PA, and IM–PA complex. They were administrated individually to a full geometrical optimization using Becke’s three-parameter hybrid exchange function and DFT in aggregation with the gradient-corrected correlation functional having Pople basis set as 6-31G** (B3LYP/6-31G**).35−37
4.3.2. Hirshfeld Surface Analyses
CrystalExplorer 3.138 was employed for mapping Hirshfeld surfaces with partitioning space in the crystal and 2D fingerprint plots. CrystalExplorer 3.1 is applicable as a tool for visualizing the intermolecular interactions in crystal packing.39 Electron distribution of the sum over crystal to the interrelated spherical atom for the promolecule or molecule ratio in a crystal is assigned as a region of Hirshfeld surface around a molecule. Two distances as de and di are given as Hirshfeld isosurface points, which are the distances from the nearest nucleus, which is external to the surface from the point, and the distance from the nearest nucleus internal to the surface, respectively. The value of dnorm (normalized contact distance) based on di and de is given by
where the van der Waals radii are given by revdW and rivdW of the atoms. Intermolecular contacts may be shorter or longer than van der Waals separations,40 which can give the dnorm value as negative or positive. The color scheme as red-white-blue displays as the dnorm parameter, where shorter contacts are indicated by bright red spots, white areas signify van der Waals contacts separation, and blue areas lacking close contacts.
Acknowledgments
The authors thank the Chairman, Department of Chemistry, AMU, Aligarh, India, for providing research facilities.
Supporting Information Available
The Supporting Information is available free of charge on the ACS Publications website at DOI: 10.1021/acsomega.9b01314.
Energy components and electrostatic moments of optimized CTC structure; TGA–DTA analyses, HOMO–LUMO energies of analytes and CTC calculated through DFT- B3LYP/6-31G** basis set; detection limits and molecular orbital energies of CTC; additional figures illustrating characterization of synthetics by FTIR and TGA–DTA; electronic absorption spectra of acceptor (1 × 10⁻⁴ M), CT complex (1 × 10⁻⁴ + 1 × 10⁻⁴ M), and donor (1 × 10⁻⁴ M) in ethanol, methanol, acetonitrile, and DMSO/H2O at room temperature and crystal packing obtained through SC-XRD; other figures and graphs illustrating mechanistic insights into sensing through fluorescence titration; and competitive UV–vis spectra and P-XRD along with solid-state UV–vis for CTC stability (PDF)
Crystallographic data (CIF)
The authors declare no competing financial interest.
Supplementary Material
References
- Yan Y. T.; Liu J.; Yang G. P.; Zhang F.; Fan Y. K.; Zhang W. Y.; Wang Y. Y. Highly selective luminescence sensing for the detection of nitrobenzene and Fe3+ by new Cd(II)-based MOFs. CrystEngComm 2018, 20, 477–86. 10.1039/C7CE01920C. [DOI] [Google Scholar]
- a Zhang Y.; He G.; Liu T.; Yang M.; Ding L.; Fang Y. Sensing performances of oligosilane functionalized fluorescent film to nitrobenzene in aqueous solution. Sens. Lett. 2009, 7, 1141–1146. 10.1166/sl.2009.1251. [DOI] [Google Scholar]; b Beauchamp R. O..; Irons R. D.; Rickert D. E.; Couch D. B.; Hamm T. J.; et al. A critical review of the literature on nitrobenzene toxicity. Crit. Rev. Toxicol. 1982, 11, 33–84. 10.3109/10408448209089848. [DOI] [PubMed] [Google Scholar]
- Huang X. L.; Liu L.; Gao M. L.; Han Z. B. A luminescent metal-organic framework for highly selective sensing of nitrobenzene and aniline. RSC Adv. 2016, 6, 87945–87949. 10.1039/C6RA19133A. [DOI] [Google Scholar]
- Mohandoss S.; Stalin T. A new fluorescent PET sensor probe for Co2+ ion detection: computational, logic device and living cell imaging applications. RSC Adv. 2017, 7, 16581–16593. 10.1039/C6RA27497H. [DOI] [Google Scholar]
- Maity D.; Govindaraju T. Highly selective colorimetric chemosensor for Co2+. Inorg. Chem. 2011, 50, 11282–11284. 10.1021/ic2015447. [DOI] [PubMed] [Google Scholar]
- Raizada M.; Sama F.; Ashafaq M.; Shahid M.; Ahmad M.; Siddiqi Z. A. New hybrid polyoxovanadate-Cu complex with V···H interactions and dual aqueous-phase sensing properties for picric acid and Pd2+: X-ray analysis, magnetic and theoretical studies, and mechanistic insights into the hybrid’s sensing capabilities. J. Mater. Chem. C 2017, 5, 9315–9330. 10.1039/C7TC03172F. [DOI] [Google Scholar]
- Wang J.; Lu L.; Wu W. P.; Hu H. M.; Xie B. A Zn(II) luminescent polymer as a multifunctional sensor to nitrobenzene, Fe3+ and CrO42– ions. J. Coord. Chem. 2016, 69, 2872–2880. 10.1080/00958972.2016.1227438. [DOI] [Google Scholar]
- Wang T.; Xue R.; Chen H.; Shi P.; Lei X.; Wei Y.; Guo H.; Yang W. Preparation of two new polyimide bond linked porous covalent organic frameworks and their fluorescence sensing application for sensitive and selective determination of Fe3+. New J. Chem. 2017, 41, 14272–14278. 10.1039/C7NJ02134H. [DOI] [Google Scholar]
- Zhong L.; Li H.; Wang S. L.; Song Q. H. The sensing property of charge-transfer chemosensors tuned by acceptors for colorimetric and fluorometric detection of CN–/HCN in solutions and in gas phase. Sens. Actuators, B 2018, 266, 703–709. 10.1016/j.snb.2018.03.025. [DOI] [Google Scholar]
- Zhang J.; Xu W.; Sheng P.; Zhao G.; Zhu D. Organic Donor-Acceptor Complexes as Novel Organic Semiconductors. Acc. Chem. Res. 2017, 50, 1654–1662. 10.1021/acs.accounts.7b00124. [DOI] [PubMed] [Google Scholar]
- Zhang J.; Jin J.; Xu H.; Zhang Q.; Huang W. Recent progress on organic donor–acceptor complexes as active elements in organic field-effect transistors. J. Mater. Chem. C 2018, 6, 3485–3498. 10.1039/C7TC04389A. [DOI] [Google Scholar]
- Mulliken R. S.; Am J. Molecular Compounds and their Spectra. II. J. Am. Chem. Soc. 1952, 3, 811–824. 10.1021/ja01123a067. [DOI] [Google Scholar]
- Roy D. K.; Saha A.; Mukherjee A. K. Spectroscopic and Thermodynamic study of charge transfer complexes of cloxacillin sodium in aqueous ethanol medium. Spectrochim. Acta, Part A 2005, 9, 2017–22. 10.1016/j.saa.2004.08.001. [DOI] [PubMed] [Google Scholar]
- Foster R.Organic Charge Transfer Complexes; Academic Press: London, 1969; p 15. [Google Scholar]
- Singh N.; Khan I. M.; Ahmad A.; Javed S. Preparation, spectral investigation and spectrophotometric studies of proton transfer complex of 2,2′-bipyridine with 3,5-dinitrobenzoic acid in various polar solvents. J. Mol. Struct. 2014, 1065–1066, 74–85. 10.1016/j.molstruc.2014.02.017. [DOI] [Google Scholar]
- Singh N.; Khan I. M.; Ahmad A.; et al. Synthesis, spectrophotometric and thermodynamic studies of charge transfer complex of 5,6-dimethylbenzimidazole with chloranilic acid at various temperatures in acetonitrile and methanol solvents. J. Mol. Liq. 2016, 221, 1111–1120. 10.1016/j.molliq.2016.06.081. [DOI] [Google Scholar]
- Makhal S. C.; Bhattacharyya A.; Ghosh S.; Guchhait N. Influence of acceptor strength on photoinduced charge transfer process in a newly designed molecule in bulk solvent and in β-CD microenvironment. J. Photochem. Photobiol. A Chem. 2018, 365, 67–76. 10.1016/j.jphotochem.2018.07.027. [DOI] [Google Scholar]
- Dabestani R.; Reszka K. J.; Sigman M. E. Surface catalyzed electron transfer from polycyclic aromatic hydrocarbons (PAH) to methyl viologen dication: evidence for ground-state charge transfer complex formation on silica gel. J. Photochem. Photobiol. A 1998, 117, 223–233. 10.1016/S1010-6030(98)00327-X. [DOI] [Google Scholar]
- Brueggermann K.; Czernuszewicz R. S.; Kochi J. K. Charge-transfer structures of aromatic electron donor-acceptor complexes with titanium tetrachloride. Ground-state and excited-state spectroscopy for redox processes. J. Phys. Chem. 1992, 96, 4405–4414. 10.1021/j100190a052. [DOI] [Google Scholar]
- Eychmüller A.; Rogach A. L. Chemistry and photophysics of thiol-stabilized II-VI semiconductor nanocrystals. Pure Appl.Chem. 2000, 72, 179–188. 10.1351/pac200072010179. [DOI] [Google Scholar]
- Khan I. M.; Ahmad A.; Miyan L.; Ahmad M.; Azizc N. Synthesis of charge transfer complex of chloranilic acid as acceptor with p-nitroaniline as donor: Crystallographic, UV–visible spectrophotometric and antimicrobial studies. J. Mol. Struct. 2017, 1141, 687–697. 10.1016/j.molstruc.2017.03.050. [DOI] [Google Scholar]
- Khan I. M.; Naeem A.; Ahmad A. Semiquantitative determination of some nitrogen compounds by the formation of charge-transfer complexes of diphenylamine with p-dimethylaminobenzaldehyde by capillary solid-state spot-tests. Chin. Chem. Lett. 2010, 21, 720–724. 10.1016/j.cclet.2009.12.028. [DOI] [Google Scholar]
- Jakubiak R.; Bao Z.; Rothberg L. Dendritic side groups as three-dimensional barriers to aggregation quenching of conjugated polymer fluorescence. Synth. Metals 2000, 114, 61–64. 10.1016/S0379-6779(00)00225-3. [DOI] [Google Scholar]
- Sathya K.; Dhamodharan P.; Dhandapani M. Structural characterization and DFT study of a new optical crystal: 2-amino-3-methylpyridinium-3,5-dinitrobenzoate. Opt. Laser Technol. 2018, 101, 328–340. 10.1016/j.optlastec.2017.11.027. [DOI] [Google Scholar]
- Divya P.; Muthuraja P.; Dhandapani M.; Bena J. V. Pesticidal compound Pirimicarb: Spectral analysis, DFT computations, molecular docking study and in vitro bioactivity. Chem. Phys. Lett. 2018, 706, 295–302. 10.1016/j.cplett.2018.06.021. [DOI] [Google Scholar]
- Khan I. M.; Ahmad A.; Ullah M. F. Synthesis, crystal structure, antimicrobial activity and DNA-binding of hydrogen-bonded proton-transfer complex of 2,6-diaminopyridine with picric acid. J. Photochem. Photobiol. B 2011, 103, 42–49. 10.1016/j.jphotobiol.2011.01.010. [DOI] [PubMed] [Google Scholar]
- Kidwai M.; Saxena S.; Rastogi S.; Venkataramanan R. Curr. Med. Chem.: Anti-Infect. Agents 2003, 2, 269–286. 10.2174/1568012033483015. [DOI] [Google Scholar]
- Khan I. M.; Ahmad A. Synthesis, spectral and thermal studies of the newly hydrogen bonded charge transfer complex of o-phenylenediamine with π acceptor picric acid. Spectrochim. Acta, Part A 2010, 77, 437–441. 10.1016/j.saa.2010.06.011. [DOI] [PubMed] [Google Scholar]
- Moustafa M. Z.; Moustafa Z. D.; Moustafa M. S. Resilience of a high latitude Red Sea corals to extreme temperature. Open J. Ecol. 2013, 03, 242–253. 10.4236/oje.2013.33028. [DOI] [Google Scholar]
- Brown E. G.Ring Nitrogen and Key Biomolecules; Kluwer Academic Publishers, 1998. [Google Scholar]
- History of the Great WAR – Surgery of the War, 1922; Vol. 1, p 175.
- Khan I. M.; Ahmad A.; Kumar S. Synthesis, spectroscopic characterization and structural investigations of a new charge transfer complex of 2,6-diaminopyridine with 3,5-dinitrobenzoic acid: DNA binding and antimicrobial studies. J. Mol. Struct. 2013, 1035, 38–45. 10.1016/j.molstruc.2012.09.016. [DOI] [Google Scholar]
- Khan I. M.; Ahmad A. Synthesis, spectrophotometric, structural and thermal studies of the charge transfer complex of p-phenylenediamine, as an electron donor with π acceptor 3,5-dinitrobenzoic acid. Spectrochim. Acta, Part A 2010, 76, 315–321. 10.1016/j.saa.2010.03.005. [DOI] [PubMed] [Google Scholar]
- Frisch M. J.; Trucks G. W.; Schlegel H. B.; Scuseria G. E.; Robb M. A.; Cheeseman J. R.; Montgomery J. A. Jr.; Vreven T.; Kudin K. N.; Burant J. C.; Millam J. M.; Iyengar S. S.; Tomasi J.; Barone V.; Mennucci B.; Cossi M.; Scalmani G.; Rega N.; Petersson G. A.; Nakatsuji H.; Hada M.; Ehara M.; Toyota K.; Fukuda R.; Hasegawa J.; Ishida M.; Nakajima T.; Honda Y.; Kitao O.; Nakai H.; Klene M.; Li X.; Knox J. E.; Hratchian H. P.; Cross J. B.; Bakken V.; Adamo C.; Jaramillo J.; Gomperts R.; Stratmann R. E.; Yazyev O.; Austin A. J.; Cammi R.; Pomelli C.; Ochterski J. W.; Ayala P. Y.; Morokuma K.; Voth G. A.; Salvador P.; Dannenberg J. J.; Zakrzewski V. G.; Dapprich S.; Daniels A. D.; Strain M. C.; Farkas O.; Malick D. K.; Rabuck A. D.; Raghavachari K.; Foresman J. B.; Ortiz J. V.; Cui Q.; Baboul A. G.; Clifford S.; Cioslowski J.; Stefanov B. B.; Liu G.; Liashenko A.; Piskorz P.; Komaromi I.; Martin R. L.; Fox D. J.; Keith T.; Al-Laham M. A.; Peng C. Y.; Nanayakkara A.; Challacombe M.; Gill P. M. W.; Johnson B.; Chen W.; Wong M. W.; Gonzalez C.; Pople J. A.. Gaussian 03; Gaussian, Inc.: Wallingford, CT, 2004. [Google Scholar]
- Becke A. D. Density-functional thermochemistry. III. The role of exact exchange. J. Chem. Phys. 1993, 98, 5648. 10.1063/1.464913. [DOI] [Google Scholar]
- Lee C.; Yang W.; Parr R. G. Development of the Colle-Salvetti correlation-energy formula into a functional of the electron density. Phys. Rev. B. 1988, 37, 785–789. 10.1103/PhysRevB.37.785. [DOI] [PubMed] [Google Scholar]
- Hariharan P. C.; Pople J. A. The effect of d-functions on molecular orbital energies for hydrocarbons. Chem. Phys. Lett. 1972, 16, 217–219. 10.1016/0009-2614(72)80259-8. [DOI] [Google Scholar]
- Wolff S. K.; Grimwood D. J.; McKinnon J. J.; Turner M. J.; Jayatilaka D.; Spackman M. A. CrystalExplorer. version 3.0, University of Western Australia, 2012.
- Spackman M. A.; Jayatilaka D. Hirshfeld surface analysis. CrystEngComm 2009, 11, 19–32. 10.1039/B818330A. [DOI] [Google Scholar]
- Dey T.; Chatterjee P.; Bhattacharya A.; Pal S.; Mukherjee A. K. Three nimesulide derivatives: synthesis, ab initio structure determination from powder x-ray diffraction, and quantitative analysis of molecular surface electrostatic potential. Cryst. Growth Des. 2016, 16, 1442–1452. 10.1021/acs.cgd.5b01547. [DOI] [Google Scholar]
- Khan I. M.; Shakya S.; Singh N. Preparation, single-crystal investigation and spectrophotometric studies of proton transfer complex of 2,6-diaminopyridine with oxalic acid in various polar solvents. J. Mol. Liq. 2018, 250, 150–161. 10.1016/j.molliq.2017.11.150. [DOI] [Google Scholar]
- Singh N.; Khan I. M.; Ahmad A.; Javed S. Synthesis and dynamics of a novel proton transfer complex containing 3,5-dimethylpyrazole as a donor and 2,4-dinitro-1-naphthol as an acceptor: crystallographic, UV–visible spectrophotometric, molecular docking and Hirshfeld surface analyses. New J. Chem. 2017, 41, 6810–6821. 10.1039/C7NJ00819H. [DOI] [Google Scholar]
- Khan I. M.; Ahmad A.; Ullah M. F. Synthesis, spectroscopic investigations, antimicrobial and DNA binding studies of a new charge transfer complex of o-phenylenediamine with 3,5-dinitrosalicylic acid. Spectrochim. Acta, Part A 2013, 102, 82–87. 10.1016/j.saa.2012.10.027. [DOI] [PubMed] [Google Scholar]
- Alam K.; Khan I. M. Crystallographic, dynamic and Hirshfeld surface studies of charge transfer complex of imidazole as a donor with 3,5-dinitrobenzoic acid as an acceptor: Determination of various physical parameters. Org. Electron. 2018, 63, 7–22. 10.1016/j.orgel.2018.08.037. [DOI] [Google Scholar]
- Khan I. M.; Ahmad A.; et al. Synthesis and spectrophotometric studies of charge transfer complexes of benzamide with picric acid in different polar solvents. Res. Chem. Intermed. 2015, 41, 1843–1861. 10.1007/s11164-013-1474-8. [DOI] [Google Scholar]
- Soltani S.; Magri P.; Rogalski M.; Kadri M. Charge-transfer complexes of hypoglycemic sulfonamide with π-acceptors: Experimental and DFT-TDDFT studies. J. Mol. Struct. 2019, 1175, 105–116. 10.1016/j.molstruc.2018.07.074. [DOI] [Google Scholar]
- Lakowicz J. R.Principles of Fluorescence Spectroscopy, 3rd ed.; Springer: New York, 2006. [Google Scholar]
- Wallace V. M.; Dhumal N. R.; Zehentbauer F. M.; Kim H. J.; Kiefer J. Revisiting the Aqueous Solutions of Dimethyl Sulfoxide by Spectroscopy in the Mid- and Near-Infrared: Experiments and Car-Parrinello Simulations. J. Phys. Chem. B 2015, 119, 14780–14789. 10.1021/acs.jpcb.5b09196. [DOI] [PubMed] [Google Scholar]
- Wang X.; Yan P.; Li Y.; An G.; Yao X.; Li G. Highly Efficient White-Light Emission and UV–Visible/NIR Luminescence Sensing of Lanthanide Metal–Organic Frameworks. Cryst. Growth Des. 2017, 17, 2178–2185. 10.1021/acs.cgd.7b00112. [DOI] [Google Scholar]
- Sama F.; Dhara A. K.; Akhtar M. N.; Chen Y.; Tong M.; Ansari I. A.; Raizada M.; Ahmad M.; Shahid M.; Siddiqi Z. A. Amino alcohols and benzoates-friends or foes? Tuning nuclearity of Cu(II) complexes, studies of their structures, magnetism, and catecholase-like activities as well as performing DFT and TDDFT studies. DaltonTrans. 2017, 46, 9801–9823. 10.1039/C7DT01571B. [DOI] [PubMed] [Google Scholar]
- Acharyya K.; Mukherjee P. S. A fluorescent organic cage for picric acid detection. Chem. Commun. 2014, 50, 15788–15791. 10.1039/C4CC06225F. [DOI] [PubMed] [Google Scholar]
- Dexter D. L. A Theory of Sensitized Luminescence in Solids. J. Chem. Phys. 1953, 21, 836–850. 10.1063/1.1699044. [DOI] [Google Scholar]
- Sun X.; Wang Y.; Lei Y. Fluorescence based explosive detection: From mechanisms to sensory materials. Chem. Soc. Rev. 2015, 44, 8019–8061. 10.1039/C5CS00496A. [DOI] [PubMed] [Google Scholar]
- Shanmugaraju S.; Mukherjee P. S. π-Electron rich small molecule sensors for the recognition of nitroaromatics. Chem. Commun. 2015, 51, 16014–16032. 10.1039/C5CC07513K. [DOI] [PubMed] [Google Scholar]
- Pramanik S.; Zheng C.; Zhang X.; Emge T. J.; Li J. New Microporous Metal–Organic Framework Demonstrating Unique Selectivity for Detection of High Explosives and Aromatic Compounds. J. Am. Chem. Soc. 2011, 133, 4153–4155. 10.1021/ja106851d. [DOI] [PubMed] [Google Scholar]
- a Sharma H.; Singh N.; Jang D. O. A benzimidazole/benzothiazole-based electrochemical chemosensor for nanomolar detection of guanine. RSC Adv. 2015, 5, 6962–6969. 10.1039/C4RA12892C. [DOI] [Google Scholar]; b Yao Y.; Tian D.; Li H. Cooperative binding of bifunctionalized and click-synthesized silver nanoparticles for colorimetric Co2+ Sensing. ACS Appl. Mater. Interfaces 2010, 2, 684–690. 10.1021/am900741h. [DOI] [PubMed] [Google Scholar]
- Sharma H.; Bhardwaj V. K.; Kaur N.; Singh N.; Jang D. O. A benzimidazole-based Co3+ complex for electrochemical and spectroscopic recognition of I- and HSO4- in semi-aqueous media. Tetrahedron Lett. 2013, 54, 5967–5670. 10.1016/j.tetlet.2013.08.051. [DOI] [Google Scholar]
- Sarkar S.; Roy S.; Sikdar A.; Saha R. N.; Panja S. S. A pyrene-based simple but highly selective fluorescence sensor for Cu 2+ ions via a static excimer mechanism. Analyst 2013, 138, 7119–7126. 10.1039/c3an00928a. [DOI] [PubMed] [Google Scholar]
- Chen D.; Chen P.; Zong L.; Sun Y.; Liu G.; Yu X.; Qin J. Colorimetric and fluorescent probes for real-time naked eye sensing of copper ion in solution and on paper substrate. R. Soc. Open Sci. 2017, 4, 171161 10.1098/rsos.171161. [DOI] [PMC free article] [PubMed] [Google Scholar]
- Li H.; Dou H.; Zhang Y.; Li Z.; Wang R.; Chang J. Studies of the interaction between FNC and human hemoglobin: A spectroscopic analysis and molecular docking. Spectrochim. Acta, Part A 2015, 136, 416–422. 10.1016/j.saa.2014.09.051. [DOI] [PubMed] [Google Scholar]
- Yadav R.; Trivedi M.; Kociok-Kohn G.; Prasad R.; Kumar A. New Ni(II) 1,2-bis(diphenylphosphino)ethane dithiolates: crystallographic, computational and Hirshfeld surface analyses. CrystEngComm 2015, 17, 9175–9184. 10.1039/C5CE01526J. [DOI] [Google Scholar]
- Shukla M.; Srivastava N.; Saha S. Investigation of ground state charge transfer complex between paracetamol and p-chloranil through DFT and UV–visible studies. J. Mol. Struct. 2012, 1021, 153–157. 10.1016/j.molstruc.2012.04.075. [DOI] [Google Scholar]
- Bhattacharya S. Ab initio and TDDFT investigations on charge transfer transition for the o-chloranil/aniline complex in gas phase. Chem. Phys. Lett. 2007, 446, 199–205. 10.1016/j.cplett.2007.08.041. [DOI] [Google Scholar]
Associated Data
This section collects any data citations, data availability statements, or supplementary materials included in this article.


