Abstract
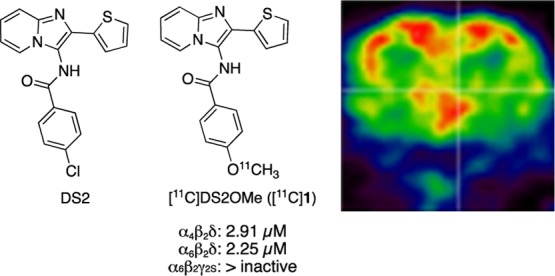
The α4/6βδ-containing GABAA receptors are involved in a number of brain diseases. Despite the potential of a δ-selective imaging agent, no PET radioligand is currently available for in vivo imaging. Here, we report the characterization of DS2OMe (1) as a candidate radiotracer, 11C-labeling, and subsequent evaluation of [11C]DS2OMe in a domestic pig as a PET radioligand for visualization of the δ-containing GABAA receptors.
Introduction
γ-Aminobutyric acid (GABA) is the main inhibitory neurotransmitter in the central nervous system and exerts its major physiological effect via interaction with ionotropic GABAA receptors (GABAARs). The GABAARs are assembled from a variety of subunits (α1–6, β1–3, γ1–3, δ, ε, θ, π, and ρ1–3) forming hetero- or homopentameric complexes in various combinations.1,2 The subunit composition of GABAARs appears to differ with subcellular localization, which dictates the type of inhibition mediated.3 The majority of GABAARs has the general stoichiometry of 2α, 2β, and 1γ subunits.4 However, in a subpopulation of receptors, the δ-subunit replaces the γ-subunit. δ-subunit-containing GABAARs, for example, α4βδ, α6βδ, and α1β2δ, are primarily found in peri- or extrasynaptic locations where they mediate tonic inhibition, distinct from the fast and transient synaptic inhibition.5,6 Aberrant tonic inhibition mediated by α4/6βδ-containing receptors has been implicated under various pathophysiological conditions and related to discrete brain regions,1 including stroke (cortex),7 Angelman syndrome (cerebellum),8 sleep-related disorders (thalamus),9 and depression (hippocampus).10 Therefore, these receptors have received a great deal of attention in the last decades as potential drug targets.11 Consequently, development of selective tool compounds and diagnostics to further understand the pharmacology and physiological roles of these receptors will prove therapeutically important.
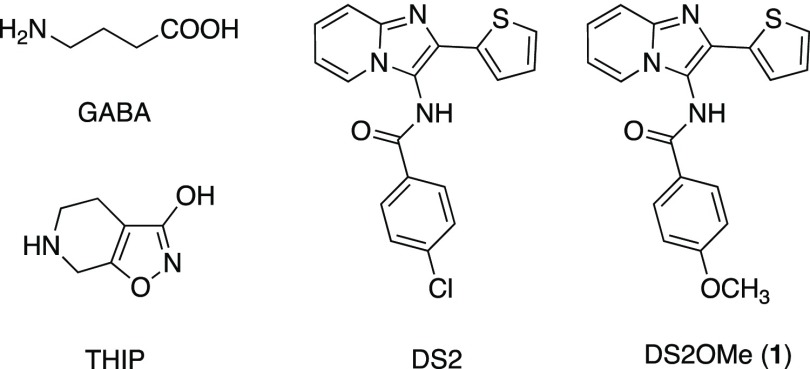
Among the orthosteric ligands reported, the functional δ-preferring orthosteric agonist THIP (gaboxadol) (Figure 1) has been pursued as a novel treatment for insomnia, reaching phase III clinical development. Gaboxadol is at present in phase III clinical trials for treatment of Angelman syndrome.12 The imidazopyridine DS2, a functionally selective α4/6β3δ positive allosteric modulator (PAM), relative to its action at α4β3γ2 and α1β3γ2 receptors, has been reported.13,14 However, poor brain penetration precludes the use of DS2 for in vivo studies.15
Figure 1.
Chemical structures of GABA, the orthosteric agonist THIP/gaboxadol, and the two PAMs, DS2 and DS2OMe (1).
Recently, we reported a structure–activity study on the δ-selective imidazopyridine DS2 (Figure 1) and the corresponding 6,8-dibromo analogue DS1 and the direct modulatory effect on [3H]-ethynylbicycloorthobenzoate ([3H]-EBOB) binding to δ-containing GABAARs.16 EBOB is a potent noncompetitive GABAAR antagonist that binds to the picrotoxinin-binding site within the GABAAR ion channel. [3H]-EBOB binding is sensitive to conformational changes in the chloride channel, which can be mediated by increasing concentrations of GABA and/or are affected by modulators in the presence or absence of GABA.17−20
Since the δ-containing GABAARs are potentially involved in the pathogenesis and symptoms of several disorders in the central nervous system, a positron emission tomography (PET) tracer would be a valuable tool. Inspired by the structure–activity study mentioned above, we herein report the identification, radiosynthesis, and in vivo PET studies of a low micromolar potency, selective, and brain-penetrant PAM of δ-containing GABAARs ([11C]DS2OMe, [11C]1), in pig, as a promising lead candidate for imaging the δ-containing GABAARs.
Results and Discussion
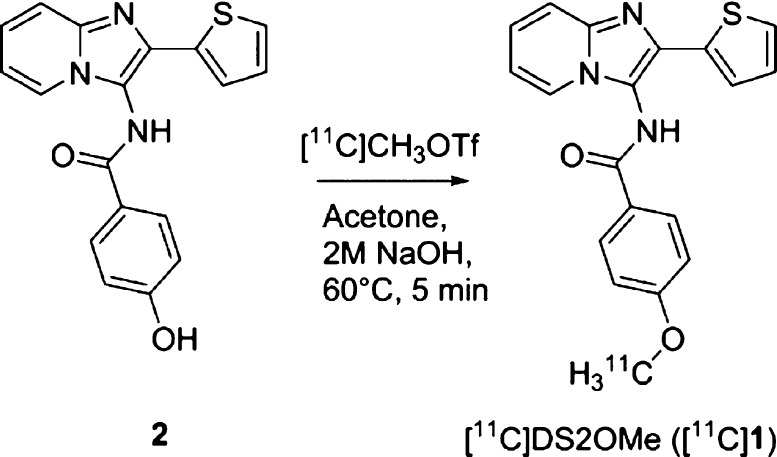
Initially, a potential 11C-labelling site in the core scaffold of DS2 was identified based on the reported structure–activity study and the experience obtained on the chemistry involved.16 Since the p-hydroxy analogue 2 (see Scheme 1) appears as an attractive precursor amenable for radiolabeling via conventional 11C-methylation, the [11C]-p-methoxy analogue of DS2 ([11C]1) was selected as the candidate radiotracer.
Scheme 1. Synthesis of [11C]1.
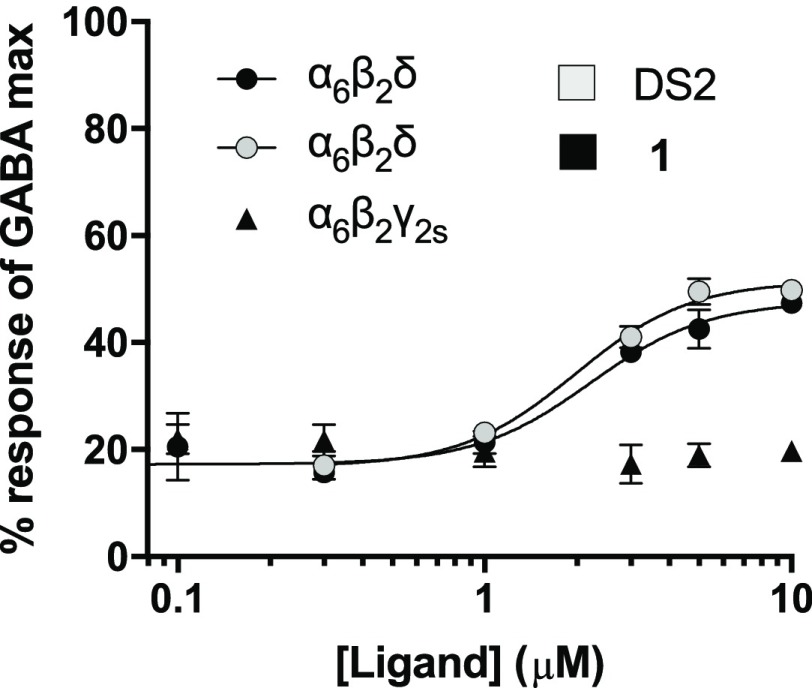
To probe the applicability of [11C]1 as a specific radiotracer for the δ-containing GABAARs, the selectivity profiles of 1 and DS2 as PAMs were compared using a fluorescence-based FLIPR membrane potential (FMP) assay, based on the transient expression of human α1/4/6 and β2 subunits in a HEK293 Flp-In cell line, stably expressing the human δ-subunit,21 or γ2 instead of δ for comparison. To this end, the concentration of GABA corresponding to GABA EC20 was first determined from the full concentration–response curves of GABA for each of the tested receptors (Table 1). Then, 1 and DS2 were tested as PAMs in the presence of the determined EC20 GABA concentration. To investigate the importance of the α-subunit for PAM activity, the subtypes, α1β2δ, α4β2δ, and α6β2δ, were compared. Full concentration–response curves showed that 1 and DS2 displayed near equipotent PAM activities (1–4 μM) at the different α-subunit-containing receptors (Table 1, Figure 2). In parallel, to confirm δ-subunit selectivity, 1 was also tested as a PAM at α6β2γ2s. As shown, neither DS2 nor 1 had any effect at this non-δ-containing receptor subtype when tested at concentrations up to 10 μM (Table 1, Figure 2). These data summarizes 1 as a novel δ-selective DS2-analogue with low micromolar PAM activity. The cell line stably expressing the δ-subunit has previously been used to study DS2 at α4β1δ versus binary α4β1/3 receptors using both the FMP assay and whole-cell patch-clamp recordings, confirming that DS2 is δ-selective.16
Table 1. Obtained PAM EC50 Values for 1 and DS2 at Selected GABAA Receptor Subtypesa.
| EC50 (μM) (pEC50 0ESEM, n) |
EC20 (μM) | |||
|---|---|---|---|---|
| 1b | DS2b | GABA | GABA | |
| α1β2δ | 3.68 (5.43 ± 0.055, 4) | 2.97 (5.53 ± 0.13, 3) | 6.71 (5.17 ± 0.087, 4) | 1.6–2.0 |
| α4β2δ | 2.91 (5.54 ± 0.069, 3) | 1.41 (5.85 ± 0.085, 3) | 0.25 (6.61 ± 0.030, 3) | 0.08 |
| α6β2δ | 2.25 (5.65 ± 0.0038, 3) | 2.02 (5.69 ± 0.10, 3) | 0.21 (6.68 ± 0.13, 3) | 0.05 |
| α6β2γ2s | no modulation (n = 3) | no modulation (n = 3) | 0.50 (6.30 ± 0.091, 3) | 0.1–0.2 |
GABA agonist EC50 values are given for reference and GABA EC20 used for PAM testing is also given. No modulation means no activity at 10 μM.
Tested as PAMs in the presence of the stated GABA EC20.
Figure 2.
Concentration–response curves of the modulation of GABA EC20 by 1 at α6β2δ and α6β2γ2s receptors and DS2 at α6β2δ receptors, tested in the FMP assay. Data are shown as mean reSD of a single representative experiment performed with three technical triplicates. Two additional experiments gave similar results; data are summarized in Table 1.
The selectivity was further explored in The National Institute of Mental Health’s Psychoactive Drug Screening Program (NIMH-PDSP) (Supporting Information Table S1), where binding affinity and cross selectivity of 1 to a large panel of brain targets was assessed. 1 did not show significant affinity (Ki > 10 μM) for other tested biogenic receptors and transporters (45 in total).
The high selectivity for δ-containing GABAARs establish 1 as an interesting compound, as a PET radiotracer candidate, for further studying the δ-containing GABAARs. Furthermore, since O-demethylation in general is a major metabolic pathway, the O-demethylated compound may be the major metabolite for 1. Therefore, radiolabeling of the methoxy group, resulting in [11C]1 via radiomethylation of the hydroxyl analogue (2), was rendered the most suitable strategy to avoid/limit radioactive metabolite formation.
Consequently, radiosynthesis of 1 was probed to obtain the corresponding [11C]1. To obtain the hydroxylated precursor, 2, a three-step procedure was applied, as previously reported,16 using 2-aminopyridine, thiophen-2-carbaldehyde, and potassium cyanide in a multicomponent reaction, followed by amide-bond formation using 4-acetoxybenzoyl chloride. The removal of the acetoxy group was accomplished with 5 M NaOH in tetrahydrofuran at room temperature.
The nonradiolabeling experiment was performed by using methyl triflate and 2 M NaOH in acetone for 3 min at 80 °C to enable the introduction of O-methyl into 2 affording the target compound 1.
The radiosynthesis of [11C]DS2OMe ([11C]1) was performed in a fully automated system. [11C]CH3OTf was dissolved in acetone containing the precursor and base and reacted for 5 min at 60 °C. Isolation of the final radiotracer, see Scheme 1, could be achieved via semipreparative high-performanec liquid chromatography (HPLC) with a total synthesis time of 37 min (Supporting Information Figures S1 and S2).
The radiolabeled compound [11C]1 was produced with a good radiochemical yield of 19.9 ± 1.2% (n = 3, decay corrected), sufficient chemical and radiochemical purity of >95%, and very high molar activities of 188–215 GBq/μmol.
Using the radiochemistry described and delineated in Scheme 1, [11C]1 was prepared for evaluation in in vivo PET imaging studies in a domestic pig using a high-resolution research tomography (HRRT) PET scanner. As an experimental animal, the pig allows us to acquire the arterial input function necessary for kinetic modelling of the data. The pig also has a larger and gyrenchephalic brain giving it a higher translational value compared to, for example, rats. [11C]1 successfully entered the pig brain, with the radioligand uptake being fairly uniform across different brain regions (Figure 3A). From the time–activity curves, it is also evident that [11C]1 has fast tracer kinetics in the four different regions measured, meaning that the retention of the tracer in the brain is limited (Figure 3B). Two other baseline PET experiments were conducted in two other pigs, showing a similar uniform uptake and fast tracer kinetics (data not shown).
Figure 3.
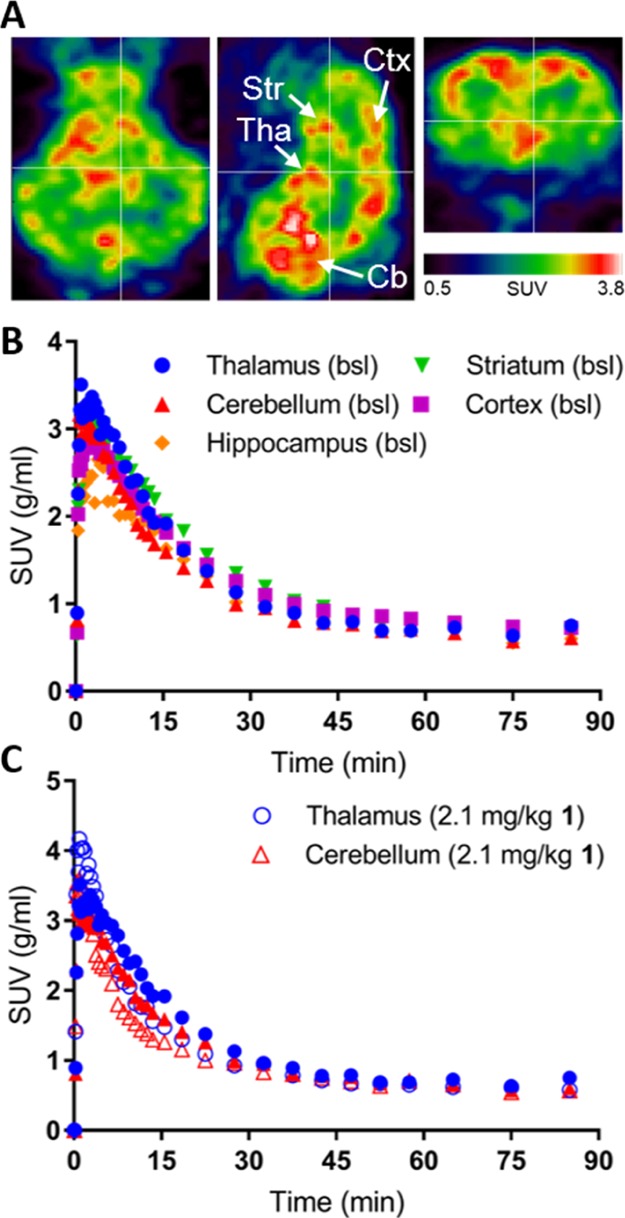
(A) PET images of the pig brain in the transverse, sagittal, and coronal planes (left to right). (B) Time–activity curves of [11C]1 in the indicated regions of the pig brain. (C) Time–activity curves of [11C]1 in the thalamus and cerebellum at the baseline (closed symbols) and after administration of 2.1 mg/kg unlabeled 1 (coadministrated with the tracer, open symbols). SUV: standardized uptake value. Tha: thalamus, Str: striatum, Ctx: cortex, Cb: cerebellum.
In one pig, we performed first the baseline scan and subsequently a self-block experiment, where we coinjected 2.1 mg/kg nonlabeled 1 along with [11C]1 (Figure 3C). Kinetic modelling of the baseline and self-block PET data confirmed that the binding of [11C]1 is quite uniform across the brain. The total distribution volume (VT) in the baseline situation was the highest in the cortex (5.6 mL/cm3), followed by the striatum (4.5 mL/cm3), thalamus (3.8 mL/cm3), hippocampus (3.8 mL/cm3), and last cerebellum (3.4 mL/cm3). This is not in accordance with the reported distribution of α4/6δ containing GABAARs. After administration of unlabeled 1, VTs was decreased in all regions: VT decreased by ∼40% in the hippocampus and cortex, whereas VT decreased by ∼18% in the thalamus and cerebellum (Supporting Information Figure S3A) indicating that there is some specific binding of [11C]1.
Radiometabolite analysis of plasma samples from the pig revealed that the metabolism of [11C]1 was fast with only 50% of the parent compound remaining after ∼5 min. If the metabolism of 1 is similarly fast in pharmacological doses, it would render this compound unsuited as a clinical drug. It is possible that the fast metabolism of [11C]1 is the reason for the observed fast tracer kinetics. After self-blockade, the radiometabolism of [11C]1 was similar to the baseline situation (Supporting Information Figure S3B). Only early eluting radiometabolites were detected with our radio-HPLC method, suggesting that these metabolites were of a polar nature (Supporting Information Figure S4). The free fraction of [11C]1 in pig plasma was measured to 15% using a dialysis chamber method with an incubation time of 3 h. This is comparable to other radiotracers evaluated in pigs.22,23
In conclusion, we here show a high uptake of [11C]1 into the pig brain but the uptake is uniform and clears quickly. However, when the uptake was quantified, we found decreases in binding after self-blockade, indicating some specific binding. In contrast to DS2,13 [11C]1 enters the brain, which, together with its selectivity for δ-containing GABAARs, renders 1 a promising lead in developing a radiotracer for the target.
Experimental Section
Radiosynthesis of [11C]DS2OMe ([11C]1)
[11C]methyl trifluoromethanesulfonate ([11C]MeOTf) was produced in an automated system and trapped in 300 μL of acetone solution containing the precursor 4-hydroxy-N-(2-(thiophen-2-yl)imidazo[1,2-a]pyridin-3-yl)benzamide (2, 0.1 mg, 0.3 μmol) and 5 μL 2 N NaOH at room temperature. The reaction mixture was heated for 5 min at 60 °C before it was diluted in 4.3 mL 0.1% phosphoric acid and isolated using semipreparative HPLC [C18 Onyx Semiprep monolithic column (Phenomenex Inc. 100 × 10 mm), 70:30 100 mM phosphate-buffer/EtOH, at a flow rate of 6 mL/min]. Retention times were 400 s for [11C]1 and 200–225 s for 2 (see Supporting Information Figure S1). The labeled product was collected into a sterile 20 mL vial containing phosphate-buffer (9 mL, 100 mM, pH 7). The final product was analyzed by analytical HPLC [Luna, 5μ, C-18(2) 100 Å column (Phenomenex Inc. 150 4.6 mm); 60:40 0.01 M sodium borate buffer/acetonitrile; 1.5 mL/min]. Retention time for 1 was 4.48 min (see Supporting Information Figure S2). The overall synthesis, purification, and formulation time was approximately 40 min. The product [11C]1 could be produced and isolated with sufficient molar activities (188–215 GBq/μmol (n = 2)) and radiochemical purities above 95%.
FMP Blue Assay on GABAA Receptors Expressed in HEK-293 Cells
The FMP assay was performed on HEK-293 Flp-In cells expressing human recombinant GABAA receptors using conditions for cell-culturing and transfection as described previously.21 In brief, the cells were plated for transfection 24 h later with GABAA receptor plasmids with the Polyfect Transfection Reagent (Qiagen, West Sussex, UK). For expression of the δ-containing GABAA receptor subtypes, α1β2δ, α4β2δ, and α6β2δ, HEK-293 Flp-In cells stably expressing the GABAA δ-subunit were transfected by a 1:1 ratio of either α1, α4 (both pUNIV) (Addgene, Cambridge, MA, USA),24 or α6 (pcDNA3.1zeo) and β2 (pcDNA3.1zeo).25 α6β2γ2s receptors were transiently expressed in background HEK-293 Flp-In cells21 using a 1:1:2 ratio of α6-, β2- and γ2s-subunits, respectively.
Transfected cells 16–24 h post-transfection were plated into poly-d-lysine coated black clear bottom 96-well plates (BD Biosciences, Bedford, MA, USA) at a density of 50 000 cells/well and incubated for 16–20 h. On the day of the assay, the medium was aspirated, and the cells were washed in 100 μL/well assay buffer [HBSS (Life technologies, Paisley, UK) + 20 mM HEPES pH 7.4] followed by addition of 100 μL/well of the FMP blue dye (0.5 mg/mL) (Molecular Devices, Sunnyvale, CA, USA) and incubated in the dark for 30 min in a CO2 incubator at 37 °C and 5% CO2. Ligand solutions were prepared in 5× in assay buffer, which for testing of the PAMs contained a concentration of GABA corresponding to GABA EC20. The GABA EC20 concentrations were determined from full GABA concentration–response curves for each subtype, as described in the Results and Discussion section. Before reading of the plate, the ligand solutions were added to 96-well ligand plates and incubated for 15 min at 37 °C in the NOVOstar plate reader (BMG, LABTECH GmbH, Offenburg, Germany). Fluorescence was determined by excitation of the dye at 530 nm and emission at 560 nm. The relative changes in the fluorescent signal (ΔFU) were analyzed by subtracting the baseline signal from the maximum peak/plateau signal induced by the ligands. Fluorescence signals were visually inspected, and any artefacts were manually omitted from the analysis. Concentration–response curves were fitted to obtain EC50 values using the four-parameter concentration–response curve using GraphPad Prism 7.0 (GraphPad Software Inc., San Diego, CA, USA)
with bottom and top being the lower (e.g., the GABA EC20 level) and upper plateau responses, respectively. [A] corresponds to the logarithmic concentration of the ligand and nH to the hill slope of the curve. The obtained EC50 values are based on at least three independent experiments with each data point performed with technical triplicates.
Animal Procedures, Pigs
One female domestic pig (crossbreed of Landrace × Yorkshire × Duroc, 22 kg) was used for in vivo PET imaging. All animal procedures were approved by the Danish Council for Animal Ethics (journal no. 2012-15-2934-00156). [11C]1 was given as intravenous (iv) bolus, and the injected dose was 509 MBq in the baseline scan and 488 MBq in the self-block scan. Molar activity at the time of injection was 129 and 113 GBq/μmol resulting in an injected mass of 1.37 and 1.51 μg. The pig was scanned twice for 90 min in the list mode. For the second (self-block) scan, [11C]1 was coinjected with 2.14 mg/kg unlabelled 1. 1 was dissolved in 10% beta-cyclodextrin solution (Sigma-Aldrich).
The animal was housed under standard conditions and was allowed to acclimatize for 1 week. Before scanning, anaesthesia was induced with im injection of 0.13 mL/kg Zoletil veterinary mixture (10.87 mg/kg xylazine + 10.87 mg/kg ketamine + 1.74 mg/kg methadone + 1.74 mg/kg butorphanol + 10.87 mg/kg tiletamine + 10.87 mg/kg zolezepam). Thereafter, anaesthesia was maintained with constant propofol infusion [1.5 mg/kg/h intravenous (iv); B. Braun, Melsungen, Germany]. Arterial iv access for drawing blood was granted in the right femoral artery via a minor incision, and two venous iv lines for injections were granted in the left and right mammary veins. Analgesia was assured by iv injection of fentanyl during surgery. During anaesthesia, animals were endotracheally intubated and ventilated. Vital parameters (heart rate, body temperature, blood pressure, blood glucose, oxygen saturation, and end tidal CO2) were continuously monitored during the scan.
Blood Sampling
During the first 30 min of the scans, radioactivity in the whole blood was continuously measured using an ABSS autosampler (Allogg Technology, Mariefred, Sweden) counting coincidences in a lead-shielded detector. Concurrently, arterial whole blood was sampled manually at times 2.5, 5, 10, 20, 30, 40, 50, 70, and 90 min after injection of [11C]1. Total radioactivity in plasma (500 μL) and whole blood (500 μL) was measured in a well counter (Cobra 5003; Packard Instruments, Meriden, CT, USA), which was cross-calibrated to the HRRT scanner and autosampler. All measurements of radioactivity were decay-corrected to the time of radioligand injection.
The free fraction of [11C]1 in pig plasma was measured using an equilibrium dialysis method as previously described26 and calculated as the ratio between radioactivity in a buffer and plasma.
Metabolite analysis
Radiolabelled parent compound and metabolites were determined by direct injection of plasma into a radio-HPLC system (Dionex Ultimate 3000; Thermo Fisher Scientific, Hvidovre, Denmark) configured for column switching. Manually drawn arterial whole blood samples were centrifuged (1500g, 7 min, 4 °C), and plasma was filtered through a syringe filter (Whatman GD/X 13 mm or 25 mm, poly(vinylidene difluoride) membrane, 0.45 μm pore size; Frisenette ApS, Knebel, Denmark) before the analysis by HPLC as previously described.27
Reconstruction and quantification of PET data
Ninety-minute list-mode PET data were reconstructed in 38 dynamic frames (6 × 10, 6 × 20, 4 × 30, 9 × 60, 2 × 180, 8 × 300, and 3 × 600 s). Images consisted of 207 planes of 256 × 256 voxels of 1.22 × 1.22 × 1.22 mm. A summed picture of all counts in the 90 min scan was reconstructed for the pig and used for coregistration to a multimodal pig brain atlas, as described by Villadsen et all.28 The time–activity curves were calculated for the following volumes of interest (VOIs): cortex, hippocampus, thalamus, striatum, and cerebellum (excluding the vermis). Outcome measure in the time–activity curves was calculated as the radioactive concentration in the VOI (in kBq/mL) normalized to the injected dose corrected for animal weight (in kBq/kg), yielding standardized uptake values (g/mL). Quantification of the binding was performed in PMOD (version 3.0) with the Logan graphical analysis, using the metabolite-corrected arterial plasma concentration to calculate the total distribution volume (VT).
Acknowledgments
The authors would like to thank the staff at the Department of Experimental Medicine (University of Copenhagen) and the PET and cyclotron unit (Rigshospitalet) for expert technical assistance. Agnete Dyssegaard is acknowledged for conducting the HPLC analysis of plasma samples.
Glossary
Abbreviations
- DS2
δ-selective compound 2
- GABA
γ-amino butyric acid
- GABAAR
γ-amino butyric acid receptor
- PET
positron emission tomography
- PAM
positive allosteric modulator
- EBOB
ethynylbicycloorthobenzoate
Supporting Information Available
The Supporting Information is available free of charge on the ACS Publications website at DOI: 10.1021/acsomega.9b00434.
Selectivity profiling in the National Institute of Mental Health’s Psycoactive Drug Screening Program, HPLC chromatograms on purification, and product UV HPLC (PDF)
Author Contributions
E.T.L. and H.D.H. contributed equally. The manuscript was written through contributions of all authors. All authors have given approval to the final version of the manuscript.
This work was funded by The Lundbeck Foundation (grants R164-2013-15384 to A.H., R133-A12270 to P.W., R230-2016-2562 to C.F.-P, and R90-A7722 for E.T.L.). The work was further supported by Innovation Fund Denmark (4108-0000-43).
The authors declare no competing financial interest.
Supplementary Material
References
- Olsen R. W.; Sieghart W. International Union of Pharmacology. LXX. Subtypes of gamma-aminobutyric acid(A) receptors: classification on the basis of subunit composition, pharmacology, and function. Update. Pharmacol. Rev. 2008, 60, 243–260. 10.1124/pr.108.00505. [DOI] [PMC free article] [PubMed] [Google Scholar]
- Olsen R. W.; Sieghart W. GABA A receptors: subtypes provide diversity of function and pharmacology. Neuropharmacology 2009, 56, 141–148. 10.1016/j.neuropharm.2008.07.045. [DOI] [PMC free article] [PubMed] [Google Scholar]
- Sieghart W.; Sperk G. Subunit composition, distribution and function of GABA(A) receptor subtypes. Curr. Top. Med. Chem. 2002, 2, 795–816. 10.2174/1568026023393507. [DOI] [PubMed] [Google Scholar]
- Whiting P. J. GABA-A receptor subtypes in the brain: a paradigm for CNS drug discovery?. Drug Discovery Today 2003, 8, 445–450. 10.1016/s1359-6446(03)02703-x. [DOI] [PubMed] [Google Scholar]
- Farrant M.; Nusser Z. Variations on an inhibitory theme: phasic and tonic activation of GABA(A) receptors. Nat. Rev. Neurosci. 2005, 6, 215–229. 10.1038/nrn1625. [DOI] [PubMed] [Google Scholar]
- Belelli D.; Harrison N. L.; Maguire J.; Macdonald R. L.; Walker M. C.; Cope D. W. Extrasynaptic GABAA receptors: form, pharmacology, and function. J. Neurosci. 2009, 29, 12757–12763. 10.1523/jneurosci.3340-09.2009. [DOI] [PMC free article] [PubMed] [Google Scholar]
- Clarkson A. N.; Huang B. S.; Macisaac S. E.; Mody I.; Carmichael S. T. Reducing excessive GABA-mediated tonic inhibition promotes functional recovery after stroke. Nature 2010, 468, 305–309. 10.1038/nature09511. [DOI] [PMC free article] [PubMed] [Google Scholar]
- Asahina N.; Shiga T.; Egawa K.; Shiraishi H.; Kohsaka S.; Saitoh S. [(11)C]flumazenil positron emission tomography analyses of brain gamma-aminobutyric acid type A receptors in Angelman syndrome. J. Pediatr. 2008, 152, 546–549. 10.1016/j.jpeds.2007.08.038. [DOI] [PubMed] [Google Scholar]
- Bright D. P.; Aller M. I.; Brickley S. G. Synaptic release generates a tonic GABA(A) receptor-mediated conductance that modulates burst precision in thalamic relay neurons. J. Neurosci. 2007, 27, 2560–2569. 10.1523/jneurosci.5100-06.2007. [DOI] [PMC free article] [PubMed] [Google Scholar]
- Holm M. M.; Nieto-Gonzalez J. L.; Vardya I.; Henningsen K.; Jayatissa M. N.; Wiborg O.; Jensen K. Hippocampal GABAergic dysfunction in a rat chronic mild stress model of depression. Hippocampus 2011, 21, 422–433. 10.1002/hipo.20758. [DOI] [PubMed] [Google Scholar]
- Brickley S. G.; Mody I. Extrasynaptic GABA(A) receptors: their function in the CNS and implications for disease. Neuron 2012, 73, 23–34. 10.1016/j.neuron.2011.12.012. [DOI] [PMC free article] [PubMed] [Google Scholar]
- Egawa K.; Kitagawa K.; Inoue K.; Takayama M.; Takayama C.; Saitoh S.; Kishino T.; Kitagawa M.; Fukuda A. Decreased tonic inhibition in cerebellar granule cells causes motor dysfunction in a mouse model of Angelman syndrome. Sci. Transl. Med. 2012, 4, 163ra157. 10.1126/scitranslmed.3004655. [DOI] [PubMed] [Google Scholar]
- Jensen M. L.; Wafford K.; Brown A.; Belelli D.; Lambert J.; Mirza N. A study of subunit selectivity, mechanism and site of action of the delta selective compound 2 (DS2) at human recombinant and rodent native GABA(A) receptors. Br. J. Pharmacol. 2013, 168, 1118–1132. 10.1111/bph.12001. [DOI] [PMC free article] [PubMed] [Google Scholar]
- Wafford K. A.; van Niel M. B.; Ma Q. P.; Horridge E.; Herd M. B.; Peden D. R.; Belelli D.; Lambert J. J. Novel compounds selectively enhance delta subunit containing GABA A receptors and increase tonic currents in thalamus. Neuropharmacology 2009, 56, 182–189. 10.1016/j.neuropharm.2008.08.004. [DOI] [PubMed] [Google Scholar]
- Jensen M. L.; Wafford K.; Brown A.; Belelli D.; Lambert J.; Mirza N. A study of subunit selectivity, mechanism and site of action of the delta selective compound 2 (DS2) at human recombinant and rodent native GABAA receptors. Br. J. Pharmacol. 2013, 168, 1118–1132. 10.1111/bph.12001. [DOI] [PMC free article] [PubMed] [Google Scholar]
- Yakoub K.; Jung S.; Sattler C.; Damerow H.; Weber J.; Kretzschmann A.; Cankaya A. S.; Piel M.; Rösch F.; Haugaard A. S.; Frølund B.; Schirmeister T.; Lüddens H. Structure-Function Evaluation of Imidazopyridine Derivatives Selective for delta-Subunit-Containing gamma-Aminobutyric Acid Type A (GABAA) Receptors. J. Med. Chem. 2018, 61, 1951–1968. 10.1021/acs.jmedchem.7b01484. [DOI] [PubMed] [Google Scholar]
- Maksay G.; Biro T. High affinity, heterogeneous displacement of [3H]EBOB binding to cerebellar GABA A receptors by neurosteroids and GABA agonists. Neuropharmacology 2005, 49, 431–438. 10.1016/j.neuropharm.2005.04.003. [DOI] [PubMed] [Google Scholar]
- Maksay G.; Finland E. R.; Korpi E. R.; Uusi-Oukari M. Bimodal action of furosemide on convulsant [3H]EBOB binding to cerebellar and cortical GABA(A) receptors. Neurochem. Int. 1998, 33, 353–358. 10.1016/s0197-0186(98)00038-2. [DOI] [PubMed] [Google Scholar]
- Uusi-Oukari M.; Maksay G. Allosteric modulation of [3H]EBOB binding to GABAA receptors by diflunisal analogues. Neurochem. Int. 2006, 49, 676–682. 10.1016/j.neuint.2006.06.001. [DOI] [PubMed] [Google Scholar]
- Yagle M. A.; Martin M. W.; de Fiebre C. M.; de Fiebre N. C.; Drewe J. A.; Dillon G. H. [3H]Ethynylbicycloorthobenzoate ([3H]EBOB) binding in recombinant GABAA receptors. NeuroToxicology 2003, 24, 817–824. 10.1016/s0161-813x(03)00051-2. [DOI] [PubMed] [Google Scholar]
- Falk-Petersen C. B.; Søgaard R.; Madsen K. L.; Klein A. B.; Frølund B.; Wellendorph P. Development of a Robust Mammalian Cell-based Assay for Studying Recombinant alpha4 beta1/3 delta GABAA Receptor Subtypes. Basic Clin. Pharmacol. Toxicol. 2017, 121, 119–129. 10.1111/bcpt.12778. [DOI] [PubMed] [Google Scholar]
- Hansen H. D.; Ettrup A.; Herth M. M.; Dyssegaard A.; Ratner C.; Gillings N.; Knudsen G. M. Direct comparison of [(18) F]MH.MZ and [(18) F] altanserin for 5-HT2A receptor imaging with PET. Synapse 2013, 67, 328–337. 10.1002/syn.21643. [DOI] [PubMed] [Google Scholar]
- Hansen H. D.; Lacivita E.; Di Pilato P.; Herth M. M.; Lehel S.; Ettrup A.; Andersen V. L.; Dyssegaard A.; De Giorgio P.; Perrone R.; Berardi F.; Colabufo N. A.; Niso M.; Knudsen G. M.; Leopoldo M. Synthesis, radiolabeling and in vivo evaluation of [(11)C](R)-1-[4-[2-(4-methoxyphenyl)phenyl]piperazin-1-yl]-3-(2-pyrazinyloxy)-2-p ropanol, a potential PET radioligand for the 5-HT(7) receptor. Eur. J. Med. Chem. 2014, 79, 152–163. 10.1016/j.ejmech.2014.03.066. [DOI] [PubMed] [Google Scholar]
- Venkatachalan S. P.; Bushman J. D.; Mercado J. L.; Sancar F.; Christopherson K. R.; Boileau A. J. Optimized expression vector for ion channel studies in Xenopus oocytes and mammalian cells using alfalfa mosaic virus. Pflügers Archiv 2007, 454, 155–163. 10.1007/s00424-006-0183-1. [DOI] [PMC free article] [PubMed] [Google Scholar]
- Petersen J. G.; Sørensen T.; Damgaard M.; Nielsen B.; Jensen A. A.; Balle T.; Bergmann R.; Frølund B. Synthesis and pharmacological evaluation of 6-aminonicotinic acid analogues as novel GABA(A) receptor agonists. Eur. J. Med. Chem. 2014, 84, 404–416. 10.1016/j.ejmech.2014.07.039. [DOI] [PubMed] [Google Scholar]
- Kornum B. R.; Lind N. M.; Gillings N.; Marner L.; Andersen F.; Knudsen G. M. Evaluation of the novel 5-HT4 receptor PET ligand [11C]SB207145 in the Gottingen minipig. J. Cereb. Blood Flow Metab. 2009, 29, 186–196. 10.1038/jcbfm.2008.110. [DOI] [PubMed] [Google Scholar]
- Gillings N. A restricted access material for rapid analysis of [(11)C]-labeled radiopharmaceuticals and their metabolites in plasma. Nucl. Med. Biol. 2009, 36, 961–965. 10.1016/j.nucmedbio.2009.07.004. [DOI] [PubMed] [Google Scholar]
- Villadsen J.; Hansen H. D.; Jørgensen L. M.; Keller S. H.; Andersen F. L.; Petersen I. N.; Knudsen G. M.; Svarer C. Automatic delineation of brain regions on MRI and PET images from the pig. J. Neurosci. Methods 2018, 294, 51–58. 10.1016/j.jneumeth.2017.11.008. [DOI] [PubMed] [Google Scholar]
Associated Data
This section collects any data citations, data availability statements, or supplementary materials included in this article.


