Abstract
Aim
To quantify the mitochondrial structure of ECs in intact arteries vs. cultured cells.
Methods and results
Cre-stop mito-Dendra2 mice, expressing the fluorescent protein Dendra2 in the mitochondrial matrix only, were used to label EC mitochondria using Cre-recombinase under the control of the VE-cadherin promoter. Conduit arteries, resistance arterioles and veins were fixed, mounted on glass slides and fluorescent images were obtained using a laser scanning confocal microscope (ex 488 nm; em 550 nm). ImageJ was used to calculate form factor (FF) and aspect ratio (AR) of the mitochondrial segments. Mitochondrial fragmentation count (MFC) was calculated by counting non-contiguous mitochondrial particles and dividing by the number of pixels which comprise the mitochondrial network. Primary aortic EC cultures (48 h on culture plates) were generated to compare the mitochondrial structure of cultured ECs vs. intact arteries. Aortic segments were also exposed to high glucose overnight (33 mM) ex vivo, and separate groups of mice were either infused with a high-glucose saline solution (300 mM) via tail vein catheter for 1 h or injected with streptozotocin (STZ; 50 mg/kg) to cause hyperglycaemia. Compared with cultured ECs, the mitochondria of ECs from the intact aorta were more fragmented (MFC: 6.4 ± 2.5 vs. 18.6 ± 9.4, respectively; P < 0.05). The mitochondrial segments of ECs within the aorta were more circular in shape (FF: 3.5 ± 0.75 vs. 1.8 ± 0.30, respectively; P < 0.05) and had less branching (AR: 2.9 ± 0.60 vs. 2.0 ± 0.25, respectively; P < 0.05) compared with cultured ECs. Ex vivo exposure of the intact aorta to high glucose overnight caused mitochondrial fission compared with normal glucose conditions (5 mM; MFC: 25.5 ± 11.1 high glucose vs. 11.0 ± 3.6 normal glucose; P < 0.05). Both 1-h infusion of high glucose saline (MFC: 22.4 ± 4.3) and STZ treatment (MFC: 40.3 ± 14.2) caused mitochondrial fission compared with freshly fixed aortas from control mice (MFC: 18.6 ± 9.4; P < 0.05 vs. high-glucose infusion and STZ treatment).
Conclusions
Using a novel mouse model, we were able to, for the first time, obtain high resolution images of EC mitochondrial structure in intact arteries. We reveal the endothelial mitochondrial network is more fragmented in the intact aorta compared with cultured ECs, indicating that mitochondria assume a more elongated and branched phenotype in cell culture.
Keywords: Endothelium, Mitochondria, Fission, Fusion, Vascular
1. Introduction
The mitochondria of endothelial cells (ECs) exist as dynamic networks which continually undergo fission and fusion events (the breaking apart of mitochondrial segments, or joining of discrete mitochondrial particles, respectively). The role played by altered mitochondrial dynamics in the development and progression of cardiovascular disease has been well studied (recently reviewed by Vásquez-Trincado et al.1 and Archer2), and the prevailing thought is that increased mitochondrial fission promotes an athero-prone phenotype in the vasculature. Mechanisms by which increased mitochondrial fission contribute to disease processes include mitochondrial depolarization, decreased ATP production, increased mitochondrial reactive oxygen species, mitochondrial DNA damage, decreased calcium exchange with the endoplasmic reticulum, and decreased mitochondrial mass.3 Conversely, mitochondrial fusion increases connectivity between mitochondrial segments and promotes an athero-protective phenotype through the exchange of proteins, nutrients, ions, and mitochondrial DNA throughout the mitochondrial network.3 However, much of this data has been generated in cell culture models and extrapolated to human disease processes as methods currently do not exist to visualize mitochondrial structure at the whole animal level, or even in the intact artery.
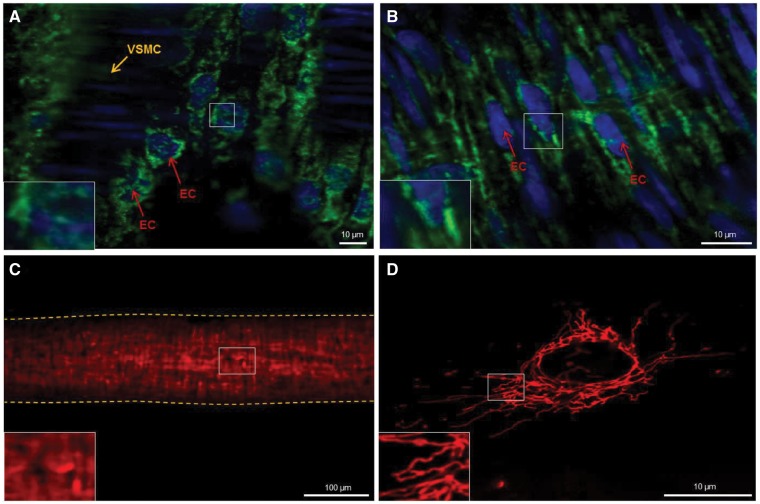
It has been suggested that mitochondrial structure may be altered in cultured cells compared with intact tissue, thereby producing conflicting results that do not necessarily capture true in vivo mitochondrial architectures. While numerous methods exist to fluorescently label and image the mitochondria in cultured cells (i.e. immunofluorescence of mitochondria-specific proteins, membrane-potential based dyes targeted to the mitochondria, and viral delivery of fluorescent proteins to the mitochondria), these methods do not provide cell-specificity, and fail to provide the level of resolution needed to quantify mitochondrial structure in three-dimensional, intact tissue (see Figure 1). Adding to the issue of poor signal-to-noise ratio, some of these labelling agents require significant exposure time (up to 24 h) to stain the mitochondria of live cells. Given that mitochondrial structure can change within seconds to minutes,4 many labelling techniques are too slow to insure that ex vivo labelling of tissue would accurately capture in vivo mitochondrial structure. Furthermore, the lack of cell-specific mitochondrial labelling makes quantification of mitochondrial structure in a single cell type problematic in intact tissue as fluorescence from other cell types can interfere with the signal from the cell-type of interest. Thus, there is an unmet need to develop a model that allows visualization of mitochondrial structure in intact tissues and in the whole animal with cell specificity, high resolution, and rapid processing.2
Figure 1.
Mitochondrial staining in intact vessels using primary antibodies for TOM20 (A) and Cytochrome C (B) fail to provide sufficient resolution to quantify mitochondrial structure at a sub-cellular level. Fixed mesenteric artery staining with MitoTracker Red (C) fails to provide cell-specific staining of ECs. Vessel outline is marked with dashed line. Live cell image of a cultured Human Umbilical Vein Endothelial Cell stained with MitoTracker Red (D) at sufficient resolution to quantify mitochondrial structure. EC, endothelial cell; VSMC, vascular smooth muscle cell.
The goal of this study was to develop a transgenic mouse model through selective breeding which expresses the photo-activatable fluorescent protein Dendra25 targeted to the mitochondrial matrix of ECs only. We present data which indicates that this approach provides, for the first time, the ability to image mitochondria at the single-cell level in intact arteries with sufficient resolution to use accepted methods to quantify mitochondrial structure. Further, we show that mitochondrial structure in fresh, rapidly fixed, intact arteries is not highly networked and elongated when compared with cultured ECs. Lastly, we confirm functional specificity using high glucose, a widely used inducer to mitochondrial fission in ECs, and streptozotocin (STZ) treatment to induce diabetes in Cre+/Dendra2+ mice.
2. Methods
Cre+/Dendra2+ mice between 10 weeks and 12 weeks of age were used for this study. All methods were approved by the Institutional Animal Care and Use Committee at the Medical College of Wisconsin and conform to the NIH guidelines for the care and use of laboratory animals.
2.1 Generation of Cre+/Dendra2+ transgenic mice
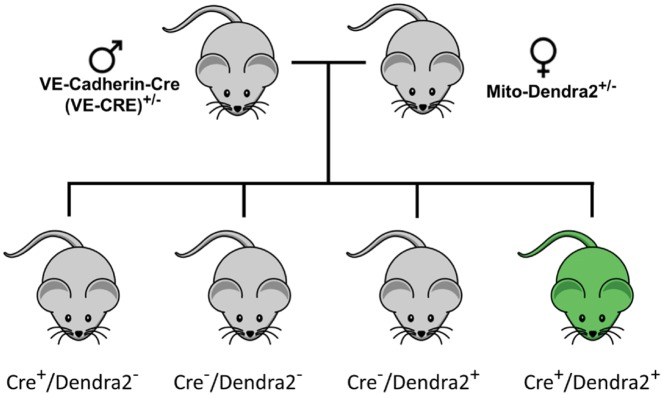
Mitochondrial specific Dendra2+ mice, which globally express Dendra2 in the mitochondrial matrix (targeted to subunit VIII of cytochrome c oxidase) were originally created by Pham et al.5 Original breeder pairs were obtained from Jackson Laboratories (Bar Harbor, ME). Female PhAMfloxed (photo-activatable mitochondria; aka Denra2+; stock No: 018385) mice were bred to male VE-Cadherin-Cre (VE-CRE; stock No: 006137) mice to generate animals that express Dendra2 in the mitochondrial matrix of the vascular endothelium only (Figure 2). Dendra2+/Cre+ offspring were used as experimental animals. All offspring were genotyped by the transgenic core facility at the Medical College of Wisconsin according to the protocol provided by Jackson laboratories for stock 18 385. Cre−/Dendra2+ mice were used as controls to show having the transgene encoding the Dendra2 protein behind a floxed stop codon in the genome had no negative impact on vascular function (see Supplementary material online). Animals were born in expected Mendelian ratios.
Figure 2.
Breeding schematic to generate Cre+/Dendra2+ transgenic mice.
2.2 Preparation of arteries for imaging
Euthanasia of the mice was carried out by overdose of beuthanasia (390 mg/mL solution diluted 1:100 and 0.5 mL given via intraperitoneal injection) combined with a bilateral pneumothorax. Arteries were carefully removed from euthanized animals as quickly as possible (approximately 15–30 s after sacrifice) using forceps and fine Vannas spring scissors (Fine Science Tools), and only the ends of the arterial segments were touched to avoid damaging the vascular endothelium. After removing the arteries from the animals, the tissues were immediately fixed in 4% paraformaldehyde to avoid morphological changes in mitochondrial structure which could potentially occur with immersion into various buffers prior to fixation. To ensure that handling of the vessels did not affect mitochondrial structure, whole animal perfusion fixation was performed on a separate group of three animals as previously described using 4% paraformaldehyde.6 No differences in mitochondrial structure were observed using either method to fix the arteries (P > 0.05 whole animal fixed vs. postmortem fixation for mitochondrial fragmentation count (MFC), AR, and FF; t-test). Once fixed, the arteries were carefully cleaned of connective tissue and cut longitudinally on one side. Arteries were then mounted onto 22 × 22 mm #1 coverslips covered in ProLong® Diamond Antifade Mountant with DAPI (Thermo) with the endothelium against the glass, and then placed on a slide for imaging. Separate segments of fresh aorta were removed and placed into M199 cell culture medium containing 100 mg/L glutamine with 20% FBS (v/v), 100 μg/mL heparin, 100 U/mL penicillin, 100 μg/mL streptomycin, and 0.292 mg/mL glutamine at 37°C for 16–20 h prior to fixation with paraformaldehyde. Glucose concentrations were adjusted to 5 mM for normal glucose treatment or 33 mM for high glucose treatment.
2.3 Immunofluorescence of CD31 and alpha smooth muscle actin
To confirm Denda2 expression was specific to only the EC layer, we performed immunofluorescence for CD31 (endothelial specific marker) and alpha smooth muscle actin (vascular smooth muscle specific marker). Aortas from Dendra2+/Cre+ mice were fixed with either 4% paraformaldehyde (for CD31) or 10% neutral buffered formalin (for alpha smooth muscle actin) for 15 min and then placed in PBS. Samples were then snap frozen in OCT following incubations in graded sucrose solution for cryoprotection. Samples were cryo-sectioned longitudinally at 5 µm and placed on Poly-L-Lysine coated slides. Prior to staining slides were allowed to air-dry at least 20 min, blocked for 20 min at room temperature, then incubated with either the CD31 (1:100; OriGene Technologies, Inc.) or alpha smooth muscle actin (1:500; Abcam) antibodies overnight at 4°C. The slides were then washed, incubated with a Cy3 secondary antibody and DAPI, and coversliped with ProLong Gold Antifade Mountant (Thermo Fisher Scientific). Fluorescent micrographs were then obtained using a Nikon A1 laser-scanning confocal microscope (see below).
2.4 Primary aortic endothelial cell culture
To generate primary cultured aortic ECs, the thoracic aorta was freshly excised from the mouse, cleaned of fat and connective tissues, perfused with free serum EGM-2 (Lonza) and then filled with media containing Collagenase B (Sigma Aldrich). After 45 min at 37°C, the aorta was flushed with 3 mL of 20% FBS-EGM-2 into a conical tube. The flushed media was centrifuged for 5 min at 12000 rpm and the pellet containing the ECs was then re-suspended in 10% FBS-EGM2 and transferred into two chambers of a four-chamber glass slide with a coverslip bottom (Nunc Lab-Tek II Chamber Slide). After 2 h, the cells were washed with fresh media and cultured in 5% FBS-EGM-2 media for 48 h at 37°C in a 5% CO2 environment. After 48 h the cells were fixed with 4% paraformaldehyde for 15 min, washed with phosphate buffered saline, and covered with ProLong® Diamond Antifade Mountant with DAPI (Thermo). Separate groups of cells were incubated in M199 culture medium (see above) containing either 5 mM or 33 mM glucose for 16–20 h prior to fixation. Purity of the EC cultures was not assessed as only the ECs express the Dendra2 fluorescent protein.
2.5 High-glucose infusion
To test whether in vivo EC mitochondrial structure changed in response to an established inducer of mitochondrial fission (high glucose), we acutely elevated blood glucose levels with a 1-h high-glucose infusion. Mice were anaesthetized with a cocktail of Ketamine (100 mg/mL), Xylazine (20 mg/mL), and Acepromazine (10 mg/mL) mixed in a 7/2/1 ratio, respectively, at a dose of 1 µL/g of body weight via intraperitoneal injection. The tail was then wiped with an alcohol pad, and a 26 gauge needle was used to make an entrance route for a tail vein catheter. After insertion through the puncture wound, the catheter was primed by flushing with 50 µL of a saline/heparin solution to ensure the catheter did not clot. After placing the animals on a heating pad to maintain body temperature, they were perfused with a high-glucose saline solution (300 mM glucose) at a rate of 10 µL/min for 1 h using an electronic syringe pump. A small tail clip was performed to draw blood before initial glucose infusion and during the hour-long procedure to ensure sufficient elevation of blood glucose levels using a commercially available blood glucose monitor. Glucose levels were collected at 0 min, 5 min; 10 min; 20 min, 30 min; 45 min and 60 min of glucose infusion. The animals were maintained under anaesthesia for the entire protocol using a cocktail of ketamine/xylazine/acepromazine. Depth of anaesthesia was tested using paw pinch. Blood glucose was elevated significantly after 10 min (>120 mg/dL increase). Blood glucose remained elevated throughout the 1-h infusion period (average value >400 mg/dL after 20 min).
2.6 Streptozotocin treatment
It is well established that hyperglycaemia induced by STZ injection (which destroys the insulin-producing pancreatic beta cells) causes endothelial dysfunction in both conduit arteries and in the microvasculature (reviewed by De Vriese et al.7). While the mechanisms that contribute to hyperglycaemia-induced endothelial dysfunction are multifactorial, mitochondrial dysfunction plays a central role.8 For example, cultured coronary ECs from diabetic mice have increased mitochondrial fission9 and venous ECs freshly isolated from patients with diabetes mellitus have increased mitochondrial fragmentation and expression of the fission-promoting protein Fis1.10 Thus, to determine if STZ-induced diabetes altered mitochondrial morphology in ECs of the intact aorta, Dendra2+/Cre+ mice were treated with STZ using established methods.11 Briefly, 10 week old mice were injected with STZ (intraperitoneal) dissolved in 0.1 M Na-Citrate buffer (pH 4.5) at a dose of 50 mg/kg with anaesthetic induction. Each day blood glucose measurements were taken with a glucometer to confirm diabetes development. If the glucose level was higher than 200 mg/dL no further injections were administered. If glucose levels did not reach this level, the intraperitoneal injection was repeated. Once blood glucose was greater than 300 mg/dL the animals were euthanized and tissue collected.
2.7 Confocal imaging of Dendra2
All images were acquired using a Nikon A1 laser-scanning confocal microscope equipped with ×20 air, and ×60 and ×100 oil immersion objectives. DAPI was excited by a wavelength of 405 nm with detection at 450/50 nm, while Dendra2 was excited at 488 nm with detection at 525/50 nm. Cy3 was excited at 561 nm with detection at 595/50 nm. Maximum projection Z-stack images were acquired using a resolution of 1048 × 1048, a scan speed of 0.5 Hz, and line averaging of 4.
2.8 Quantification of mitochondrial structure
Single cell mitochondrial structure was quantified using two accepted methodologies, which are commonly used in cell culture models. The first method uses ImageJ to describe each individual mitochondrial segment in a given cell by assigning FF (4π·area/perimeter2) and AR (derived from length of major and minor axis) values and is described by Koopman et al.12 Briefly, a high FF value is indicative of a long, highly branched mitochondrial segment, and a high AR value is assigned to long, elliptical segments.13 The second method of quantification, the calculation of MFC, was first described by Stephen Archer’s laboratory in 201214 and assigns a single numerical value to each cell. The MFC is calculated by dividing the number of discrete mitochondrial segments in the cell by the total mitochondrial mass (black pixels) and arbitrarily multiplying by 1000. A higher MFC value corresponds to a more fragmented mitochondrial network.
To calculate FF, AR, and MFC, unedited image files were opened in ImageJ and the brightness and contrast of the images were adjusted to optimize visualization of the mitochondrial segments and to reduce background noise. The images were then converted to a binary image using the Otsu method, and the polygon selection tool was used to outline an individual cell within a given field. After selecting an individual cell, the Analyze Particles function (pixel size 10-infinitiy; circularity 0.00–1.00) was used to count the number of noncontiguous, discrete particles, and describe their shape. The FF of each segment is calculated as the inverse of the circularity of each particle, and AR is automatically calculated as 4π·area/perimeter2. The average of all FF and AR values within each cell was then calculated for each treatment group.
To calculate MFC, the number of black pixels which comprises the binary mitochondrial network were counted using the Histogram function within ImageJ. The number of mitochondrial particles (above) was then divided by the number of black pixels and multiplied by 1000. A visual representation of these quantification methods is shown in Supplementary material online, Figure S1.
2.9 Statistical methods
All data are presented as mean value ± standard deviation and all statistical analysis was performed on a per-cell basis (vs. per animal). All data sets were tested for normality using the Shapiro–Wilk test. When appropriate, either a parametric unpaired Students’ t-test or non-parametric Mann–Whitney rank sum test were used to compare differences in FF, AR, and MFC between cultured cells and intact arteries, and normal and high glucose treated cells and arteries. A Kruskal–Wallis one way analysis of variance (ANOVA) on ranks with a post hoc Dunn’s test was used to compare the FF, AR, and MFC of mitochondria from ECs from high glucose infused animals and STZ treated animals to animals that were whole-animal fixed (control). A P-value of <0.05 was considered statistically significant.
3. Results
3.1 The fluorescent protein Dendra2 is specifically expressed in the mitochondria of endothelial cells
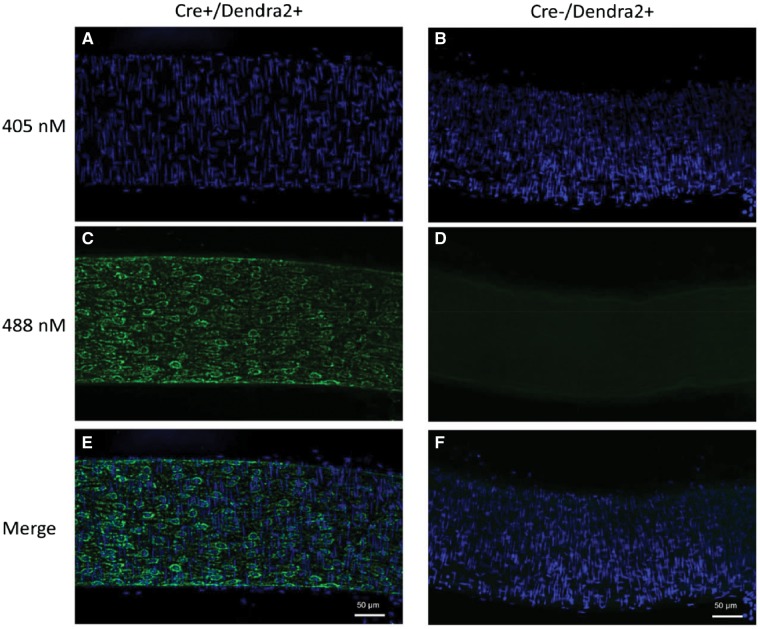
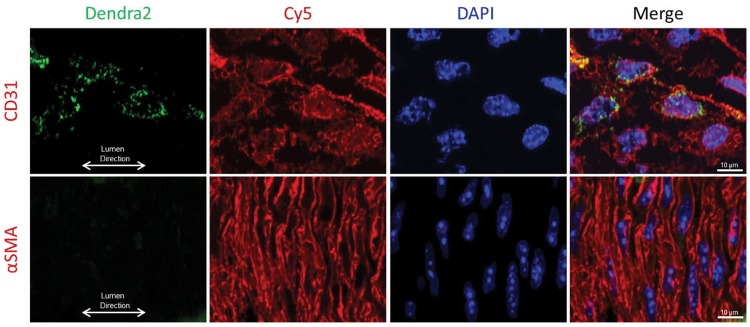
Mice carrying the Dendra2 transgene under the VE-cadherin promotor specifically express the green fluorescent protein Dendra2 in the vascular endothelium. Figure 3 is a representative image of an intact mesenteric artery from a Cre+/Dendra2+ animal, which displays green fluorescence in the EC layer (left panel), whereas arteries from a Cre−/Dendra2+ mouse have no discernable fluorescence aside from weak autofluorescence (right panel). As shown in Figure 4, the expression of Dendra2 is specific to the EC layer as there is co-localization of Dendra2 fluorescence with CD31 (endothelial specific marker) with no green Dendra2 fluorescence observed in the vascular smooth muscle cell layer (stained with alpha smooth muscle actin). Supplementary material online, Figure S2 shows representative images of mitochondrial structure in the ECs of six different intact arteries, the (A) aorta; (B) carotid artery; (C) femoral artery; (D) mesenteric artery; (E) middle cerebral artery; and the (F) pulmonary artery. Robust Dendra2 fluorescence is also observed in the EC layer of the jugular vein (Supplementary material online, Figure S3). All images were taken with a laser-scanning confocal microscope at ×100 magnification using an oil-immersion lens, and are maximum-projection Z-stacks.
Figure 3.
Laser-scanning confocal micrographs of an intact mesenteric artery from a Cre+/Dendra2+ mouse (left; A, C, E) and a Cre−/Dendra2+ (right; B, D, F) mouse. Nuclei were stained with DAPI (A, B). Green Dendra2 fluorescence was observed only in the Cre+/Dendra2+ artery (C), while no green fluorescence was observed in the artery from the Cre−/Dendra2+ mouse (D). Merged images indicate the green fluorescence of the Dendra2 protein co-localizes with EC nuclei (E), which run parallel to the lumen of the vessel. All images were taken at ×20 magnification and are maximum projection Z-stacks. Scale bar = 50 µm. Images were taken from three consecutive mice.
Figure 4.
Visualization of Dendra2 protein expression within the intact aorta. Dendra2 protein expression (green fluorescence) is only observed in the EC layer and not the vascular smooth muscle cell layer as evidenced by co-localization with CD31 (top), and not alpha smooth muscle actin (bottom) immunofluorescence. Image taken at ×60 magnification. Scale bar = 10 µm.
3.2 The fluorescence of Dendra2 in the mitochondrial matrix of intact arteries is robust and the signal-to-noise ratio is sufficient to allow high resolution imaging and quantification of mitochondrial structure
As shown in Supplementary material online, Figure S1, the resolution of mitochondrial structure in the intact arteries of Cre+/Dendra2+ mice is sufficient to accurately count the number of discrete, non-contiguous mitochondrial segments, as well as the number of pixels which comprise the mitochondrial network in a binary image, allowing calculation of the MFC.14 Further, using standard methodology, we were able to describe the degree of branching of each mitochondrion, as well as the relative circularity of each segment, by calculating the FF and AR, respectively.12,13
Of note, the composite Z-stacks (typically 10 unique planes) which form each image can give the illusion that individual mitochondrion are located within the nucleus. Because of the three-dimensional shape of ECs, these mitochondria are above or below the nucleus as there was no Dendra2 fluorescence present in the nuclear area in the specific Z-plane at which the DAPI signal was acquired. As shown in Supplementary material online, Figure S4, Dendra2 fluorescence is localized only to the mitochondrial matrix, as there is precise co-localization of the Dendra2 fluorescent signal with MitoTracker Red fluorescence in cultured aortic ECs from a Cre+/Dendra2+ mouse. This is consistent with the previous work by Pham et al. who developed the breeder mouse lines with the Dendra2 protein targeted selectively to the mitochondrial matrix (with a mitochondrial targeting sequence to subunit VIII of cytochrome c oxidase) as evidenced by exact colocalization of the signal with HSP-60, a marker for the mitochondrial matrix.5
3.3 The mitochondrial network is more fragmented in endothelial cells of the intact artery compared with cultured endothelial cells from the same animal
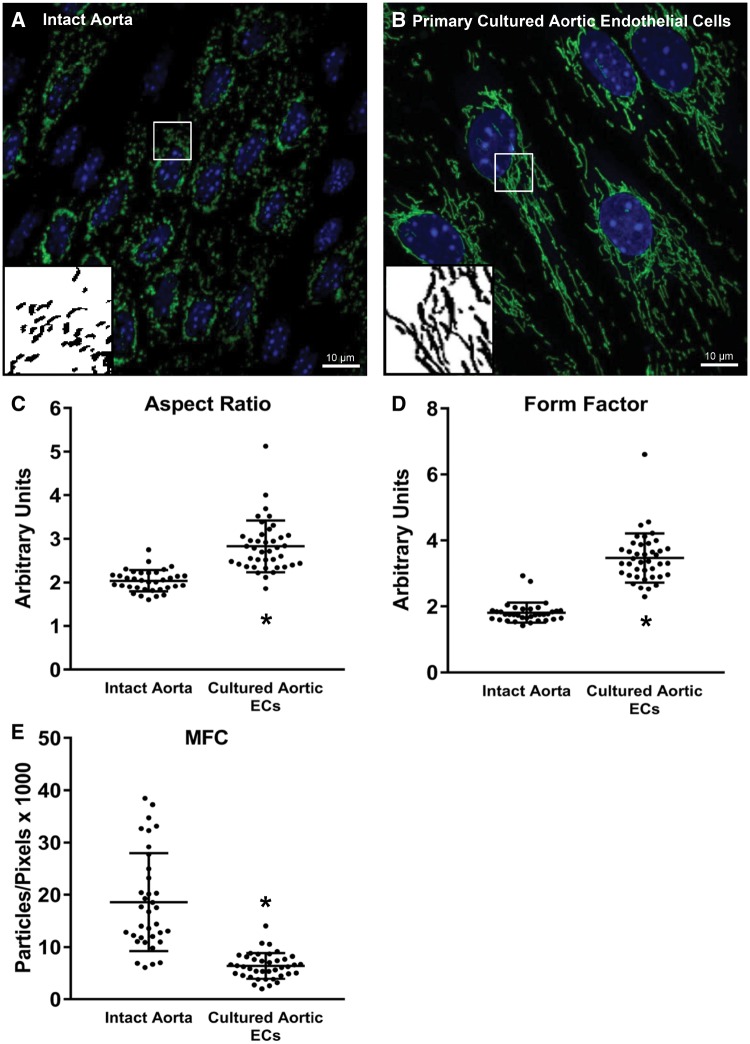
EC mitochondria generally exist in a highly dynamic and largely networked state to maintain homeostatic conditions; however, to date all studies of EC mitochondrial dynamics have been performed in cultured cells as methods haven’t been developed to visualize EC mitochondrial structure in intact arteries. In Figure 5, EC mitochondrial structure is shown in the intact, abdominal aorta of a Cre+/Dendra2+ mouse (A) compared with primary cultured ECs from the thoracic aorta of the same animal (B). After 48 h in culture, the ECs appear much larger and the mitochondria exist in a highly elongated and networked structure. As shown in panels C and D, respectively, the MFC of cultured aortic ECs is approximately one-third that of ECs from the intact artery (P < 0.001 vs. intact aorta; Mann–Whitney rank sum test) and the FF and AR are significantly less in the intact artery (P < 0.001 vs. cultured cells, Mann–Whitney rank sum test). While the mitochondria appear to exist in a highly fragmented state (typically associated with endothelial dysfunction), mesenteric resistance arteries from Cre+/Dendra2+ animals exhibit dose-dependent vasodilation to both acetylcholine and shear stress, similar to arteries from Cre−/Dendra2+ animals which do not express Dendra2 in the mitochondrial matrix, but still carry the Dendra2 transgene (Supplementary material online, Figure S5). These data suggest that the presence of Dendra2 in the mitochondrial matrix exerts no adverse effects on endothelium-dependent vasodilation in the microvasculature.
Figure 5.
Juxtaposition of mitochondrial structure of ECs within the aorta and primary cultured aortic ECs. Mitochondrial structure of ECs from the intact aorta (A) of a Cre+/Dendra2+ mouse vs. primary culture aortic ECs (B) from the same mouse. After 48 h in culture the AR and FF are significantly higher (C and D, respectively) and the MFC (E) is significantly lower in the cultured cells, indicating the mitochondrial structure is more elongated and highly networked in the cultured cells. Both images were taken at ×100 magnification. Scale bar = 10 µm. Green: Dendra2; Blue: DAPI. Inserts are processed, binary examples from ImageJ. Intact aorta: n = 40 cells, four biological replicates. Primary cultured cells: n = 40 cells, three biological replicates. *P < 0.05 vs. Intact Aorta, Mann–Whitney rank sum test. • indicates a measurement from an individual cell.
3.4 High glucose causes mitochondrial fission in cell culture and in intact arteries
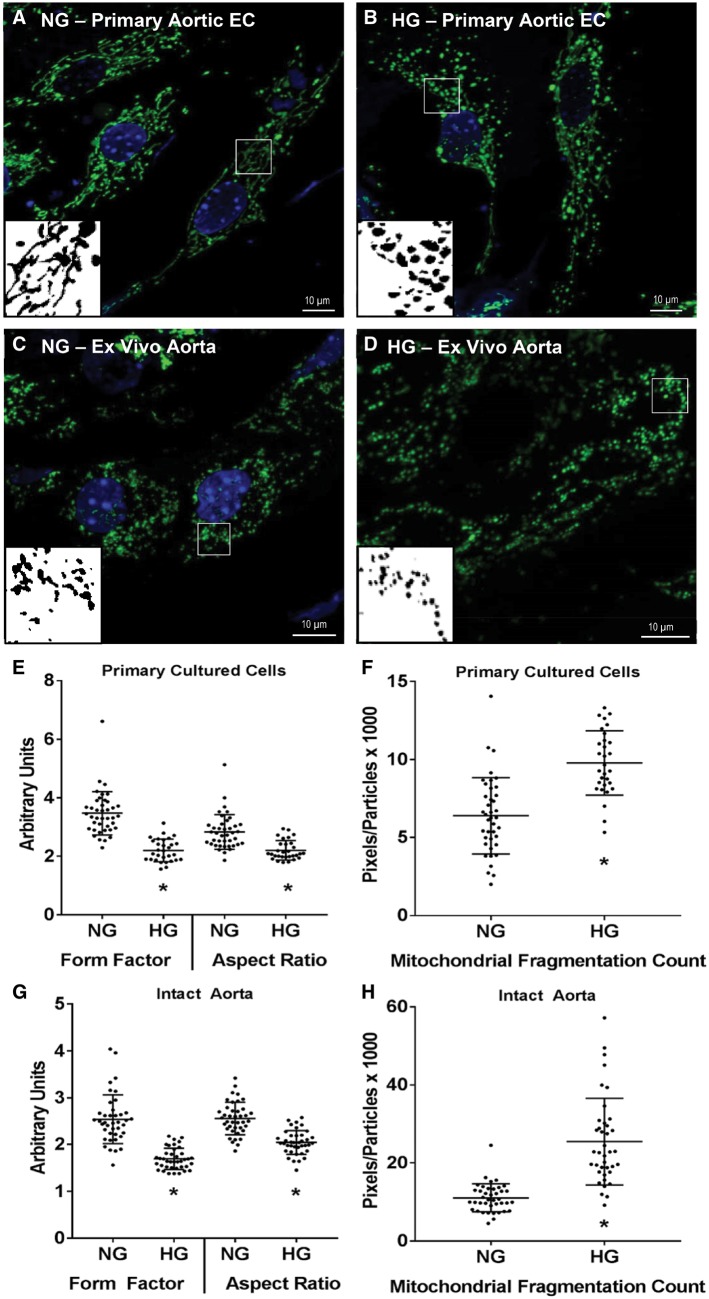
Exposure to high concentrations of glucose is a well-studied inducer of mitochondrial fission in the vascular endothelium.10,15 As shown in Figure 6, overnight (16–20 h) exposure to 33 mM glucose increased MFC (P < 0.001, unpaired t-test) and reduced FF (P < 0.001, Mann–Whitney rank sum test) and AR (P < 0.001, Mann–Whitney rank sum test) in primary culture aortic ECs despite those cells having a higher degree of baseline mitochondrial networking compared with the intact artery. A similar increase in MFC (P < 0.001, Mann–Whitney rank sum test) and reduction in FF (P < 0.001, Mann–Whitney rank sum test) and AR (P < 0.001, unpaired t-test) were observed in ECs from isolated vessels exposed to 33 mM glucose for 16–20 h overnight ex vivo.
Figure 6.
Effect of ex vivo high glucose exposure on mitochondrial structure in primary culture aortic ECs or intact aortas from a Cre+/Dendra2+ mouse. Representative micrographs of normal and high glucose incubated cells and aortas are shown in A–D. In primary cultured cells high glucose caused a decrease in FF and AR (E) and an increase in the MFC (F). Similar changes in FF, AR, and MFC were observed in aortas incubated in high glucose overnight (G and H). All images were taken at ×100 magnification. Scale bar = 10 µm. Green: Dendra2; Blue: DAPI. Inserts are processed, binary examples from ImageJ. n = 30–40 cells in each group, three or four biological replicates. *P < 0.05 vs. normal glucose, Mann–Whitney rank sum test (E, G, H) or unpaired t-test (F). • indicates a measurement from an individual cell.
3.5 Acute high-glucose infusion and STZ treatment cause mitochondrial fission in vivo
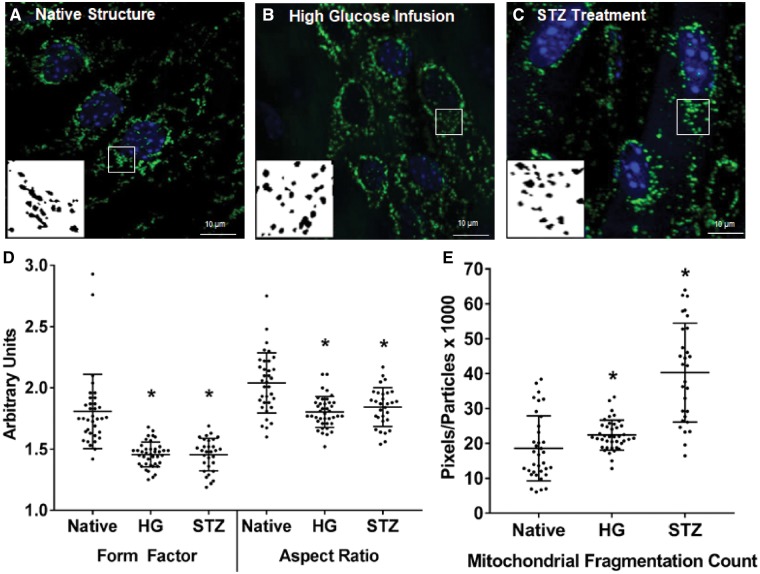
As shown in Figure 7, 1-h infusion of a high-glucose saline solution (300 mM glucose) via the tail vein to anaesthetized mice caused mitochondrial fission in vivo, as the mitochondria in the endothelium of intact arteries from the high glucose infused animals had a reduced FF and AR and increased MFC compared with their native structure (P < 0.001 vs. native structure, one-way ANOVA on ranks). Similarly, treating Cre+/Dendra2+ mice with STZ to induce diabetes significantly increased blood glucose levels (mean blood glucose at time of euthanasia = 338 ± 58 mg/dL) and caused mitochondrial fission in the aortic ECs within the intact artery.
Figure 7.
Effect of in vivo high-glucose infusion or STZ treatment on mitochondrial structure in intact aortas from a Cre+/Dendra2+ mouse. Representative micrographs of ECs from an intact aorta of a whole-animal fixed control mouse (A), a mouse infused with 300 mM glucose for 1 h (B) or a mouse treated with STZ to induce diabetes (C). Compared with a whole-animal fixed control mouse, both high-glucose infusion and STZ treatment reduced FF and AR (D) and increased the MFC (E). All images were taken at ×100 magnification. Scale bar = 10 µm. Green: Dendra2; Blue: DAPI. Inserts are processed, binary examples from ImageJ. n = 30–40 cells in each group, three to four biological replicates. *P < 0.05 vs. Native, Kruskal–Wallis one-way ANOVA on ranks. • indicates a measurement from an individual cell.
As shown in Figures 6 and 7, ex vivo treatment of the aorta with high glucose or STZ treatment, respectively, causes robust mitochondrial fission. As shown in Supplementary material online, Figure S6, this is much less apparent in electron micrographs of ECs in mesenteric arteries from the same animals due to the large degree of heterogeneity of mitochondrial structure, even within the same image. We believe this is a limitation of the EM method, which is limited to a two-dimensional view (i.e. a tubular mitochondrion would appear circular if imaged transversely) vs. the three dimensions used to form composite Z-stacks on a confocal microscope.
4. Discussion
The novel findings in this study are three-fold. First, using a transgenic mouse model which specifically expresses the fluorescent protein Dendra2 targeted to the mitochondrial matrix of the vascular endothelium, we show mitochondrial structure at high resolution in the ECs of intact arteries. Importantly, the optical properties of Dendra2 fluorescence in intact tissue are sufficient to allow quantification of mitochondrial structure using accepted methods. Second, we present novel data which indicates that mitochondrial structure in cultured ECs is markedly different than in the intact arterial endothelium. Specifically, the mitochondrial structure of ECs in culture is highly elongated and networked, while the mitochondria exist in a more punctate and less networked structure in the intact artery. Third, we show that high glucose, a well-established inducer of mitochondrial fission, causes fission in cultured ECs, in the intact artery exposed to high glucose ex vivo, and in vessels excised from live animals after infusion of high glucose. Further, in vivo STZ treatment significantly raises blood glucose and causes mitochondrial fission. These data suggest that the physiological processes that mediate mitochondrial fission operate similarly in cultured cells compared with the intact blood vessel in vivo.
The reason that EC mitochondria exist in a more punctate structure in the intact blood vessel compared with cell culture remains to be determined. The fluid dynamic forces of flowing blood, the presence of blood elements, the influence of underlying parenchymal cells, the presence of cell-culture media growth factors, and various cell isolation techniques may exert influence on EC mitochondrial structure. Alternatively, in intact vessels, mitochondrial fission could be a consequence of a greater degree of autophagy, a cellular reparative process. It is unlikely this observation is an artefact of Dendra2 expression in the mitochondrial matrix, or a consequence of fixation with paraformaldehyde, because cultured aortic ECs from Cre+/Dendra2+ mice, also fixed with paraformaldehyde, have a highly networked and elongated mitochondrial structure which is typical of what is observed in cells cultured under standard conditions. In addition, isolated mesenteric arterioles from these animals display typical dose-dependent vasodilation to multiple endothelium-dependent stimuli, indicating that Dendra2 expression does not impair endothelial function which typically occurs with mitochondrial fission. Future mechanistic studies are warranted to determine which of these factors contribute to the different mitochondrial phenotype observed in the intact artery.
It is important to note that while the native mitochondrial structure within the intact vessel is significantly more punctate, exposure to a fission-inducing stimulus (high glucose), or in vivo treatment of mice with STZ to induce diabetes, caused further dissolution of the mitochondrial network, indicating that while in vivo mitochondrial structure may be more punctate than the cell-culture literature would suggest, the process of mitochondrial fission appears to still occur in a predicable manner. Future studies which involve genetic and pharmacological manipulation of the primary fission-inducing proteins such as dynamin related protein 1 (DRP-1) and mitochondrial fission 1 protein (FIS1) may provide key insight into the induction and regulation of mitochondrial fission in the intact vasculature. Conversely, up-regulation and overexpression of the proteins responsible for mitochondrial fusion, such as the mitofusins (MFN1 and 2) and optic atrophy protein 1 (OPA1), would provide insight into how varying degrees of mitochondrial fusion impact vascular endothelial function and protect against stress-induced fission at the level of the whole animal. Further, creating double transgenic mouse lines which manipulate these genes on the Dendra2 background would provide many opportunities to study the pathways involved in mitochondrial fission and fusion in vivo.
The development of this novel animal model will also provide a valuable tool to investigate how in vivo mitochondrial structure responds to a broad range of physiological processes, environmental stressors and cardiovascular pathologies which cannot be replicated in cell culture. For example, ECs within an intact blood vessel are continuously exposed to varying levels and types of shear forces that can directly alter mitochondrial structure and promote mitochondrial biogenesis.16,17 The approach of using an animal model which expresses fluorescently labelled mitochondria also allows investigation into how inter-cellular signalling between other cell types which come into contact with the vascular endothelium (e.g. vascular smooth muscle cells, platelets, or macrophages) can affect EC mitochondrial structure, which is not possible without co-culturing ECs with different cell types (an approach which is rarely practiced). Finally, this model will provide a tool to investigators who are developing and testing therapeutics which target the mitochondria as a means to treat cardiovascular disease, an area of high interest and importance, which was recently highlighted by a Scientific Statement from the American Heart Association on the roles of mitochondrial dysfunction in the development of disease.18
We did not examine differences in mitochondrial structure within different arteries or arterial beds and also propose this as a future area of investigation. For example, the Cre+/Dendra2+ animals will provide a valuable tool to examine the differences in mitochondrial structure in conduit vs. smaller resistance arteries. Another future area of investigation will be to examine how mitochondrial structure differs in different regions within the same artery where flow patterns may be different, for example in the descending aorta vs. the aortic arch. Further, it is unknown if mitochondrial structure is more affected by stressors in the conduit arteries, arterioles, or on the venous side of the circulation.
In this study, we imaged Dendra2 fluorescence in fixed arteries only. Dendra2 was developed as a photo-switchable protein, and when imaged under live-cell conditions, undergoes photo-conversion from green to red fluorescence after brief exposure to UV light, allowing for the study of mitochondrial dynamics and turn-over in real-time.5 It is worth mentioning that with the use of intravital confocal microscopy, it could be possible to visualize in vivo mitochondrial dynamics in the intact microvasculature of live animals in real-time, using techniques like the cranial window or cremaster muscle preparations. Thus, applying intravital microscopy techniques to study in vivo mitochondrial dynamics represents a critical next step to these studies.
In summary, we present a novel method to visualize and quantify mitochondrial structure in intact arteries by using a transgenic mouse with fluorescently labelled mitochondria specifically in the vascular endothelium. Our data indicates that the mitochondria exist in a more punctate and less networked structure in the intact artery compared with cultured ECs, but still undergo mitochondrial fission in response to a well-described fission-inducing stimulus. Future studies utilizing this animal model will provide valuable insight into how mitochondrial dynamics are regulated at the whole animal level and will provide a vehicle to study mitochondrial fission and fusion responses to conditions that cannot be recapitulated in cell culture.
Supplementary Material
Acknowledgements
The authors would like to thank Joe Hockenberry and Jasmine Linn for overseeing the breeding of the mice, and maintenance of the mouse colony.
Conflict of interest: none declared.
Funding
This work was supported by National Institutes of Health [R01-HL-113612, R01-HL-133029 R21-OD-018306, T32-HL-007792] and American Heart Association [14POST18780022].
Time for primary review: 43 days
References
- 1. Vasquez-Trincado C, Garcia-Carvajal I, Pennanen C, Parra V, Hill JA, Rothermel BA, Lavandero S.. Mitochondrial dynamics, mitophagy and cardiovascular disease. J Physiol 2016;594:509–525. [DOI] [PMC free article] [PubMed] [Google Scholar]
- 2. Archer SL. Mitochondrial dynamics—mitochondrial fission and fusion in human diseases. N Engl J Med 2013;369:2236–2251. [DOI] [PubMed] [Google Scholar]
- 3. Liesa M, Palacin M, Zorzano A.. Mitochondrial dynamics in mammalian health and disease. Physiol Rev 2009;89:799–845. [DOI] [PubMed] [Google Scholar]
- 4. Kuznetsov AV, Hermann M, Troppmair J, Margreiter R, Hengster P.. Complex patterns of mitochondrial dynamics in human pancreatic cells revealed by fluorescent confocal imaging. J Cell Mol Med 2010;14:417–425. [DOI] [PMC free article] [PubMed] [Google Scholar]
- 5. Pham AH, McCaffery JM, Chan DC.. Mouse lines with photo-activatable mitochondria to study mitochondrial dynamics. Genesis 2012;50:833–843. [DOI] [PMC free article] [PubMed] [Google Scholar]
- 6. Gage GJ, Kipke DR, Shain W.. Whole animal perfusion fixation for rodents. J Vis Exp 2012;(65):3564. [DOI] [PMC free article] [PubMed] [Google Scholar]
- 7. De Vriese AS, Verbeuren TJ, Van de Voorde J, Lameire NH, Vanhoutte PM.. Endothelial dysfunction in diabetes. Br J Pharmacol 2000;130:963–974. [DOI] [PMC free article] [PubMed] [Google Scholar]
- 8. Rolo AP, Palmeira CM.. Diabetes and mitochondrial function: role of hyperglycemia and oxidative stress. Toxicol Appl Pharmacol 2006;212:167–178. [DOI] [PubMed] [Google Scholar]
- 9. Makino A, Scott BT, Dillmann WH.. Mitochondrial fragmentation and superoxide anion production in coronary endothelial cells from a mouse model of type 1 diabetes. Diabetologia 2010;53:1783–1794. [DOI] [PMC free article] [PubMed] [Google Scholar]
- 10. Shenouda SM, Widlansky ME, Chen K, Xu G, Holbrook M, Tabit CE, Hamburg NM, Frame AA, Caiano TL, Kluge MA, Duess MA, Levit A, Kim B, Hartman ML, Joseph L, Shirihai OS, Vita JA.. Altered mitochondrial dynamics contributes to endothelial dysfunction in diabetes mellitus. Circulation 2011;124:444–453. [DOI] [PMC free article] [PubMed] [Google Scholar]
- 11. Brosky G, Logothetopoulos J.. Streptozotocin diabetes in the mouse and guinea pig. Diabetes 1969;18:606–611. [DOI] [PubMed] [Google Scholar]
- 12. Koopman WJ, Verkaart S, Visch HJ, van der Westhuizen FH, Murphy MP, van den Heuvel LW, Smeitink JA, Willems PH.. Inhibition of complex I of the electron transport chain causes O2-. -mediated mitochondrial outgrowth. Am J Physiol Cell Physiol 2005;288:C1440–C1450. [DOI] [PubMed] [Google Scholar]
- 13. Trudeau K, Molina AJ, Roy S.. High glucose induces mitochondrial morphology and metabolic changes in retinal pericytes. Invest Ophthalmol Vis Sci 2011;52:8657–8664. [DOI] [PMC free article] [PubMed] [Google Scholar]
- 14. Rehman J, Zhang HJ, Toth PT, Zhang Y, Marsboom G, Hong Z, Salgia R, Husain AN, Wietholt C, Archer SL.. Inhibition of mitochondrial fission prevents cell cycle progression in lung cancer. FASEB J 2012;26:2175–2186. [DOI] [PMC free article] [PubMed] [Google Scholar]
- 15. Trudeau K, Molina AJ, Guo W, Roy S.. High glucose disrupts mitochondrial morphology in retinal endothelial cells: implications for diabetic retinopathy. Am J Pathol 2010;177:447–455. [DOI] [PMC free article] [PubMed] [Google Scholar]
- 16. Kim B, Lee H, Kawata K, Park JY.. Exercise-mediated wall shear stress increases mitochondrial biogenesis in vascular endothelium. PLoS One 2014;9:e111409.. [DOI] [PMC free article] [PubMed] [Google Scholar]
- 17. Scheitlin CG, Nair DM, Crestanello JA, Zweier JL, Alevriadou BR.. Fluid mechanical forces and endothelial mitochondria: a bioengineering perspective. Cel Mol Bioeng 2014;7:483–496. [DOI] [PMC free article] [PubMed] [Google Scholar]
- 18. Murphy E, Ardehali H, Balaban RS, DiLisa F, Dorn GW 2nd, Kitsis RN, Otsu K, Ping P, Rizzuto R, Sack MN, Wallace D, Youle RJ; American Heart Association Council on Basic Cardiovascular Sciences, Council on Clinical Cardiology, and Council on Functional Genomics and Translational Biology. Mitochondrial function, biology, and role in disease: a scientific statement from the American Heart Association. Circ Res 2016;118:1960–1991. [DOI] [PMC free article] [PubMed] [Google Scholar]
Associated Data
This section collects any data citations, data availability statements, or supplementary materials included in this article.


