Abstract
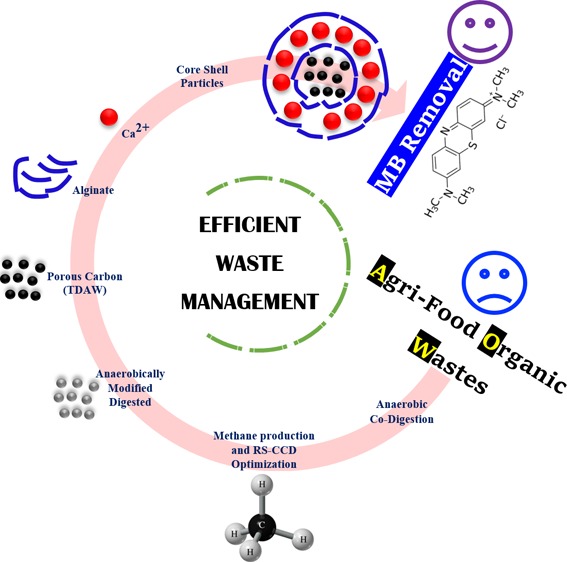
Valorization of agri-food organic waste in order to reach zero waste using cleaner methods is still a challenge. Therefore, both anaerobic co-digestion (ACD) (biological process) and adsorption (physicochemical process) were used in combination for this objective. ACD allows the activation of biodegradable organic matter by microbial action and produces a digestate (co-product). This coproduct was used as a raw material to produce porous carbon having a high specific surface area after chemical treatment using sulfuric acid and thermal activations at temperature T = 350 °C. The resulted material was used for the preparation of core–shell particles with a core made of porous carbon and a shell consisting mainly of alginate and a calcium ion layer. The final core–shell particles were then used for dye treating wastewater and solving the solid–liquid separation problem in the adsorption process. We show here that in the ACD process, significant bio-methane potential (BMP) was produced. Furthermore, the data indicate that 153 L CH4 kg·SV–1 of BMP was produced under optimum conditions of pH = 8 and inoculum/load ratio = 1.2. The overall results concerning the methylene blue (MB) adsorption from water onto the core–shell particles show the occurrence of a maximum adsorbed amount equal to 26.178 mg g–1, and good agreement was found between the experimental adsorption data with pseudo-second-order and Langmuir theoretical models. The response surface methodology coupled with the central composite design has allowed the identification of optimal conditions for MB removal and has led to the elucidation of adsorption mechanism and the regeneration of the adsorbent without the occurrence of the solid/liquid separation problem.
1. Introduction
In recent years, the increase of water contamination by organic matter (OM) has led to the increase of toxic organic waste and energy requirements resulting in worldwide problems.1−3 Hence, more than 10–15% of 10 000 types of toxic organic dyes released into the aquatic environment are originating from the industrial manufacturing operations.4 Moreover, the increased organic waste amounts are mainly because of the increase of the inhabitant number.2 These wastes also lead to a very deep energy problem resulting in the lack of renewable sources such as water, coupled with environmental risks related to fossil fuels.5−7 For a long time, researchers and industrialists have devoted their knowledge and paved the ways necessary to solve these pollution and consumption energy problems.8 Adsorption and anaerobic co-digestion (ACD) processes were used with high efficiencies to address these environmental issues.9−21 However, it is worth noting that these processes often have disadvantages, such as the recovery mass in the adsorption process, the separation of liquid and solid phases after adsorption, and the resulting coproducts (digestate) from the anaerobic process.22−34 Nonetheless, significant limitation is that each technique can manage only one of the numerous ecological issues. Therefore, the key factor to address and/or to efficiently manage these environmental issues is to use coupled procedures leading to synergistic effects and, hence, improve the productivity.35
Nowadays, carbonaceous materials (e.g.: bio char, activated carbon, carbon nanotubes, etc.) have been of great interest in several fields such as energy conversion and storage, and organic pollution remediation.36−39 The preparation of these materials was performed by several activation modes, including physical, chemical, and biological. However, biological activation (biological modification) may be an effective route as compared to other modes.40−43 Such biological activation of the OM based on the use of ACD, constitutes multiple processes and allows the production of a very important renewable energy (methane) and a coproduct (digestate) which will in turn lead to the preparation of functional carbonaceous materials. These materials are characterized by their marked adsorptive properties resulting from their large surface area, the presence of functional groups on the surface and its tunable electrical surface with the aqueous phase pH.36 The prepared carbonaceous adsorbent from the modified digestate shows a high removal efficiency of methylene blue (MB) from water. Furthermore, the effect of ACD on the adsorbent properties can be discriminated by the increase of parameters such the pH, zeta potential, Brunauer–Emmett–Teller (BET) surface area, CEC, and AEC as reported in Ref. 44.44
The aim of the present work is to biologically activate four agri-food organic wastes using ACD at 38 °C, which allows the production of a very large amount of methane, thanks to the use of biologically modified digestate. The latter was used to prepare a carbonaceous material having a bead shape with a 400 μm layer, for MB removal from water (Figure 1). The bead-shaped carbonaceous material was selected in order to avoid the drawback related to the adsorbent regeneration. Indeed, several studies have shown the effectiveness of the bead-shaped materials in the removal from water of toxic dyes, in the separation phases, as well as in the adsorbent regeneration.30−34 On theother hand, alginate has recently received considerable attention for powder immobilization to prepare bead materials because of the alginate ability to form hydrogels with metallic divalent cations such as Ca2+.4,45 This work can be summarized in three big parts:
In the first part (ACD): we described a facile synthesis of the inoculum used for OM degradation by the ACD process. Then, the physicochemical characterization of different wastes was investigated by the measurements of temperature, aqueous phase pH, conductivity, alkalinity, turbidity, heavy metal concentration, COD, BOD, and other physicochemical parameters (NO3–, NH4+, TH, SV, SM, and ST). The bio methane potential (BMP) of wastes was studied using a design of experiments (DOE) by the response surface methodology coupled with the central composite design (RSM-CCD). After this, the kinetics of methane production and the optimization of digestion process monitoring were investigated.
In the second part (preparation of core–shell particles for solving the solid–liquid separation problem): the digestate obtained after the ACD process was used as a carbonaceous material in the form of core–shell particles and the protocol of preparation was detailed. Furthermore, the electrostatic attraction occurring between alginate, calcium (Ca2+) ions, and carbonaceous material leads, hence, to the formation of core (carbonaceous)–shell (alginate–calcium ions) particles
In the third part (adsorption of MB): in this part of work, the key parameters that affect the adsorption of MB have been studied. Furthermore, the kinetics and equilibrium of adsorption processes of dyes as well as the surface response methodology (RSM) were reported to get better insights into the adsorption process. Finally, the regeneration tests, thermodynamic studies, and mechanism of adsorption were investigated.
Figure 1.
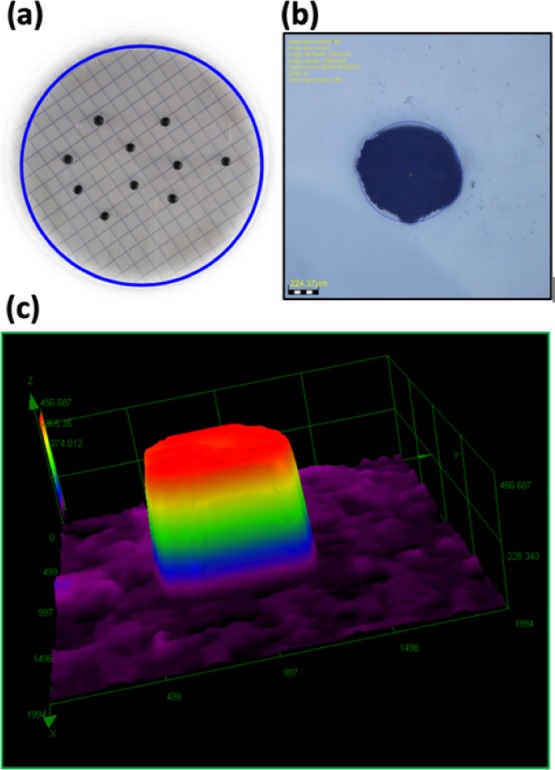
Images of the prepared core–shell particles taken using a (a) camera pro and optical microscopy in (b) 2D and (c) 3D forms.
2. Results and Discussion
2.1. Results of the Physicochemical Characterization of Wastes Used in This Work
Table S1 shows the measured values of pH and volatile solids (VS) for each substrate used in this work. As can be observed in Table S1, the substrates contain mainly OM with a very high amount in the loss of dairy product (LDP), compared with other wastes. The high OM amount of the LDP can be explained by the strong presence of the sweet and polysaccharide compounds.
The physicochemical characterization of the mixture of wastes (Table 1), shows an acidic pH, an average conductivity of 15.04 mS cm–3, a fairly high content of volatile fatty acids (VFA), concentrations of COD and BOD5 largely exceeding the Moroccan standards, the presence of large amounts of nitrates and phosphates, and low concentrations of heavy metals. On the other hand, Table 1 indicates the presence of a high level of calcium and magnesium (conductivity of 15.04 ms/cm, 1543 mg/L of Ca2+ and 856 mg/L of Mg2+), which is due to the nature of the substrates used in this work. However, the concentration of both elements does not exceed the limits of the inhibition medium for digestion (excessive amounts of calcium lead to precipitation of carbonate or phosphate and Mg2+ ions at high concentrations have been shown to stimulate the production of single cells).46 As can be seen in Table 1, the waste mixture was characterized by medium alkalinity with significant VSs equal to 36.1 g L–1. Table 1 also shows the non-biodegradability of the inoculum compared with that of the substrate. The ratio COD/BOD5 = 1.96 < 3 (in the case of inoculum) while in the case of the substrate it was = 4.72 > 3.47
Table 1. Physicochemical Characteristics of the Mixture and Inoculum.
| analyses | mixture | inoculum | unit |
|---|---|---|---|
| pH | 5.64 | 6.78 | |
| conductivity | 15.04 | 37.1 | ms/cm |
| Ca2+ | 1543 | 30.12 | mg/L |
| Mg2+ | 856 | 25.18 | mg/L |
| TDS | 6.99 | 17.1 | g/LTDS |
| turbidity | 4012 | 5012 | NTU |
| temperature | 20.1 | 24.4 | °C |
| volatile fatty acids | 2103 | 1800 | mg/L |
| COD | 29 333 | 21 547 | mgO2/L |
| BDO5 | 14 897 | 4571 | mgO2/L |
| COD/BDO5 | 1.96 | 4.72 | |
| TS | 41.66 | 64.44 | g/L |
| VS | 36.11 | 38.4 | g/L |
| MS | 5.51 | 26.04 | g/L |
| VS/TS (%) | 87 | 59.59 | % |
| TH | 901.5 | 125 | mg/L |
| Cu2+ | 0.3 | 1.05 | mg/L |
| Pb2+ | ND | ND | mg/L |
| Cd2+ | 0.29 | ND | mg/L |
| Cr2+ | ND | 0.02 | mg/L |
| alkalinity | 1308 | 2015.2 | mg/L |
| P | 85.6 | 96.51 | mg/L P |
| NH4+ | 194 | 345 | mg/L |
Table 1 shows the value of ammonia concentration, which is a major inhibitory factor in the ACD process. According to the literature, the inhibitory limit of TAN concentration that can cause a 50% reduction in methane production ranges from 1.7 to 14 g L–1.46 In our case, the ammonia concentration was found to be 164.18 mg L–1, which is beneficial for our anaerobic process because nitrogen is an essential nutrient for anaerobic microorganisms. Physicochemical characterization makes it possible to assess the feasibility of applying the process of ACD for methane energy recovery.
2.2. Kinetics of Methane Production and Digestion Process Monitoring
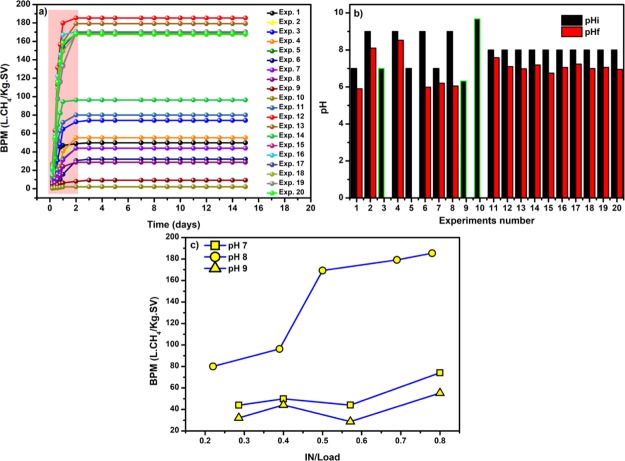
Methane production kinetics is a key parameter for the ACD process. It provides information on the growth kinetics of microorganisms and the speed of OM transformation. The kinetic study of 20 ACD experiments (Figure 2a) shows the appearance of two phases, one rapid in the first 3 days and the second is slow with a plateau-like behavior lasting for 12 days. A higher BMP is found near pH 8 with a 15 day TRH, which is consistent with other studies.48,49
Figure 2.
ACD of agri-food organic waste (a) BMP as a function of time, (b) pH variation during the ACD process, and (c) BMP as a function of the volume inoculum/feedstock ratio at different pH values.
Figure 2b shows that the BMP increases with the increase of the ratio (inoculum/load), and it is more significant in the reactors with pH = 8. At this pH value, the variation of the ratio (inoculum/load) from 0.22 to 0.80 promotes an increase of BMP by +105 L CH4 kg SV–1. VS reduction is important at pH 8 compared to another pH. In fact, 78.38% of the OM has been removed near this pH. In the case of reactors with pH = 7 and pH = 9, increasing the ratio (inoculum/load) from 0.28 to 0.80 was in favor of an increase of the BMP by +30.16 L CH4 kg SV–1.
After the ACD process, the final pH changed to acidic values for an initial pH = 7, probably because of the high concentration of organic acids. The system shutdown in reactors 3, 5, 10, and 11 was explained by the accumulation of ammonium and VFA in the medium which blocks the system.23 Nevertheless, when initial pH = 8, the final pH changed to alkaline pH (Figure 2c). These results show that the digestate resulting from this process can be used for possible applications, especially in the retention of positively charged dyes such as MB. The monitoring of the ACD process was performed by Fourier-transform infrared (FTIR) analysis. Figure S1 shows the appearance and disappearance of certain functional groups with a large change in the intensity during ACD. The FTIR spectrum before ACD shows the presence of different vibrations; Table S2 reports all the vibrations before and after ACD.50,51 The same analysis after ACD allowed us to detect differences in band positions with intensities. It is, therefore, likely that some of the OM has turned into CH4. Indeed, a wide band located at 1100 cm–1 probably attributed to the symmetric and asymmetric stretching of phosphodiesters or polysaccharides and polysaccharide substances present in milk has disappeared and been replaced by another band and may be assigned to the −C–O– groups.50 In addition, all the other peaks are displaced and their intensities decrease, more precisely the peaks of −C–O–, −C=O–, and −O–H. This confirms the degradation of OM present in agri-food waste.
2.3. Modeling of the ACD Process
The experimental results of the CCD matrix were used to elaborate a quadratic polynomial equation (eq 1). The statistical and predictive qualities of this equation have been examined by several statistical tests (Table S3).24,52,53 The analysis of the variance shows a P-value less than 0.05, which confirms the significance of the model in terms of the correlation between the experimental data. Figure S2 confirms the normality of the residues and the absence of the aberrant points.29 In addition, coefficients of determination values indicate a good fit between the experimental and calculated results by the model (Table S3). The significance of the coefficients was examined using the P-value (Table S3). Indeed, all coefficients are significant at 5 or 1%, except the interaction between the pH and the load (P-value = 0.46 > 0.05).
 |
1 |
2.4. Optimization of ACD Using CCD-RSM
The process of transforming the OM on methane has been optimized and the interactions between different factors were investigated. Thus, eq 1 was used for constructing response surfaces (3D) and contour plots (2D) as shown in Figure S3; 3D and 2D presentations allow us to see the distribution of the responses (methane yield) as functions of different independent variables (pH, load, and inoculum). The responses of the methane yield essentially depend on the experiment operating conditions. Therefore, the most significant yields are always recorded in the centers of the experimental domains and more precisely at pH 8. Figure S3 summarizes the 3D and 2D presentations. In a more profound and specific way, we can see:
Figure S3a (plan inoculum–pH): in this presentation, the response surface is a parabolic form, which shows that the significant responses are concentrated in the center of experimental domains. Indeed, the variation of pH from 6.27 to 8 favors a considerable increase of the methane yield (from 2.71–173.08 L·CH4/kg SV). The variation of pH above pH 8 makes the process transformation difficult and the OM reduction was gradually decreased; these variations are proportional to the decrease in the inoculum volume with a load fixed at 180 mL.
Figure S3b (plan load–pH): the same parabolic form in Figure S3a, has been observed in this plane and the large yield values are recorded at pH 8. The pH and load variation have a positive influence on the methane production especially when the pH is around 8 and the charge is in the range of 180 ± 10 mL.
Figure S3c (Plan inoculum–load): this plan makes it possible to examine the influence of the inoculum and the load when the pH is equal to 8. The present plan shows that an inoculum/load ratio between 0.5 and 0.7 is recommendable to have a relatively high BMP.
These results were used to determine the optimal conditions of the ACD process. Nevertheless, during the optimization process, several criteria were taken into consideration and not just the methane yield. These criteria are as follows :
Minimize alimentation pH to values below 8.
Minimize the inoculum volume versus volume of waste.
Produce a large quantity of methane with a final pH close to neutral at the end of the process (stabilized digestate).
Table S4 presents the different proposals chosen during this work. According to Table S4, the pH can be optimized at 7.40 with an acceptable methane yield of 152 ± 1.23 L. The comparison of anaerobic mono- and co-digestion of agri-food organic wastes under optimum conditions showed that methane production was strongly affected by the substrate ratios. Therefore, the BMP has been increased 9.92, 5.92, 2.52, and 4.14 times for LDP, physicochemical sludge (PCS), and liquid biological sludge (LBS), pure whey (PW), respectively. These results could be explained by the increase of microbial diversity provided by mixing the four substrates, which contributed to the increased consumption of the OMs in this mixture.54 For instance, Maragkaki and co-workers showed that the biogas production can be increased by adding other wastes to the sewage sludge without affecting the operation of existing digesters and without requiring additional facilities,55 this is in agreement with our observations. In addition, Vivekanand showed that the methane yields were up to 84% higher than the weighted average of the methane yields obtained with the individual substrates for ACD of whey, manure, and fish ensilage.56
Biogas production from agri-food is very promising to generate renewable energy. The present results were compared with others cited in the bibliography in terms of treatment efficiency and cumulative methane production and showed a good performance.57−59 For example, Amon et al. reported that manures received from contrasting dairy systems were anaerobically digested. The resulting methane yield ranged between 125 and 166 L·CH4/kg SV depending on the milk yield and diet of the dairy cow.58 In addition, Ince et al., 1998, showed the performance of a laboratory-scale two-phase anaerobic digestion system treating dairy wastewater, and the results showed an overall 90% COD and 95% BOD removal.59
Another study of Berna Kavacik reported the production of biogas by different mixtures of cheese, whey, and dairy manure: the rate of methane production was determined and showed a value of 1.510 m3 m–3 d–1 at hydraulic retention times (HRTs) of 5 days in the mixture containing 8% total solid matters at 34 °C. Despite the different temperatures of digestion, the results are consistent. In addition, Rajesh Banu and coworkers tested the performance of treatment of dairy wastewater using anaerobic and solar photocatalytic methods. In this work, it is not only the temperature of digestion that differs but the system of digestion by the substitution of a batch reactor by a laboratory-scale hybrid up-flow anaerobic sludge blanket reactor. The maximum loading rate was found to be 19.2 kg COD/m3 day with 84% of COD removal.48,49 The findings suggest that our optimum conditions found by the RSM-CCD technique for the co-anaerobic treatment process would be a promising alternative for the treatment of agri-food organic wastes.
2.5. Characterization of TDAW@alginate Beads for MB Adsorption
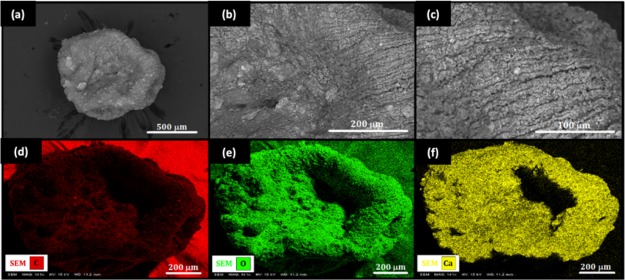
The scanning electron microscopy (SEM) analysis (Figure 3a–c) was adapted to show the morphological characteristics of our spherical material. The SEM images show a spherical shape in the order of 1 mm (after drying) with homogeneously distributed pores on the surface. The membrane created by the carboxylic groups of the alginate and the Ca2+ ions was observed using mapping analysis (Figure 3d–f); this membrane almost uniformly buries particles. In addition, the presence of Ca2+ ions is very concentrated in the shell of each bead while in the core it was lower (immobilization of the TDAW material inside the core–shell). The energy-dispersive X-ray spectrometry analysis (Figure S4) confirms the previous results. Therefore, in the shell of the TDAW@alginate beads, the atomic percentage of calcium (7.23%) is very high compared with that in the core (0.35%). The same remark was observed for the percentage of carbon and oxygen, very low in the shell and the opposite in the core with the presence of impurities that characterize our material: Al (0.04%), P (0.01%), S (0.38%), Ca (0.35%), and Fe (0.37%). The morphologically interesting SEM images, the distribution of the elements shown by the mapping, and the percentage of chemical elements present on the surface confirm the synthesis of TDAW@alginate.
Figure 3.
SEM and mapping analyses of the prepared core–shell particles: (a–c) topographic images. (d) Carbon distribution, (e) oxygen distribution, and (f) calcium distribution on the TDAW@alginate surface.
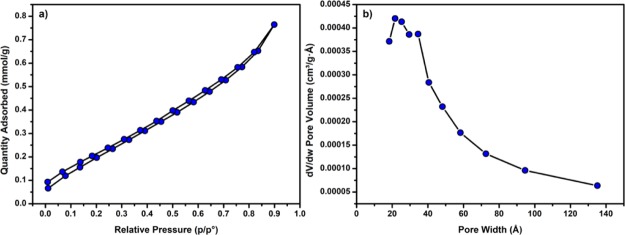
The nitrogen physisorption measurement was used to characterize the porosity of the TDAW@alginate material (Figure 4). The specific surface area of our carbonaceous material was equal to 471.85 m2/g,53 and after the preparation of the beads, the surface was decreased to 20.50 m2/g (Figure 4a). The decrease in the BET values was explained by the fact that the surface area of TDAW was coated with Ca2+ ions and alginate, which in turn lead to the blockage of the carbonaceous material pores and only a part of pores appears. In addition, nitrogen physisorption analysis shows a combination of type II adsorption–desorption isotherms and the plot of pore distribution indicates that mesopores, which were not coated with alginate after drying, are predominant (Figure 4b).
Figure 4.
(a) BET analysis and (b) pore size distribution of the TDAW@alginate particles.
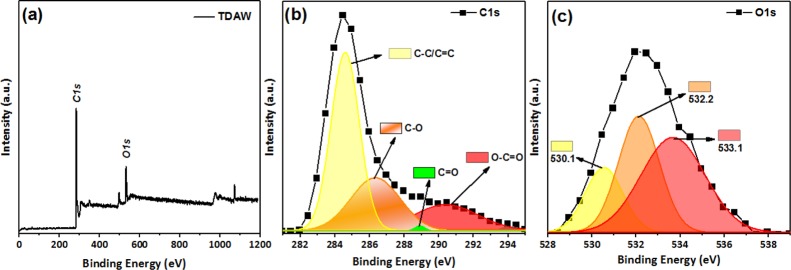
X-ray photoelectron spectroscopy (XPS) analysis was performed to characterize the oxygen-containing functional groups in the surface of porous carbon material. In Figure 5a–c the surface of TDAW constituted mainly of sp2-bonded carbon, C–OH, and C=O bonds. The sp2-bonded carbon atoms were detected at 284.99 eV, C–OH broad peaks were confirmed at 286.2 eV, and C=O bonds were observed at 288.45 eV.29,60 The deconvolution of the O 1s band shows three crests at 530, 532, and 533 eV assigned to O atoms in phenolic and ether and carbonyl O atoms in anhydrides and lactones, whereas the third peak is attributed to the O groups in carboxylic acid groups.61 Nevertheless, impurities were observed in the TDAW structure related to the starting biomass and the reagents used for the preparation of TDAW.
Figure 5.
(a) XPS patterns of TDAW and normalized XPS spectra of TDAW C 1s (b) and TDAW O 1s (c).
2.6. Effect of the TDAW@alginate Bead Dose and the MB pH Solution
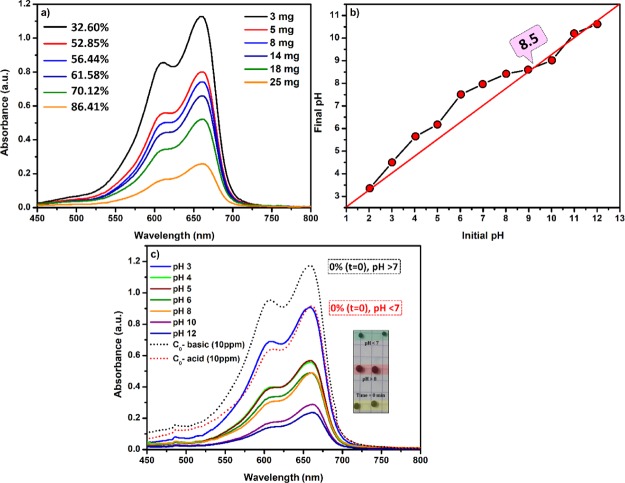
The effect of the TDAW@alginate mass was investigated under the following conditions: 40 mL of MB solution, an initial dye concentration of 10 mg·L–1, an adsorbent–adsorbate contact time of 100 mn, room temperature for the adsorption process, and normal pH. Figure 6a shows the curves of UV–visible absorption spectra measured after a contact time of 100 min, at different adsorbent dosages. It can be seen that the MB removal increases with the increasing adsorbent mass. The higher adsorption capacity at a lower adsorbent amount was explained by the availability of active sites in TDAW@alginate (more surface area and pores).
Figure 6.
(a) Effect of the adsorbent dose, (b) point zero charge of the TDAW@alginate adsorbent, and the (c) effect of the pH solution on the adsorption of MB over TDAW@alginate.
The effect of pH on the adsorption of MB onto TDAW@alginate was also evaluated (Figure 6a,c). It was found that the pH of the MB solution has a critical impact on MB removal. When the pH of the solution was very acidic (pH = 3), the removal of MB was very low, which may be related to the proton H+ competition with MB for the available adsorption sites.33 On the other hand, when pH > pHPZC (Figure 6b), the removal of MB was increased from 5.44 to 95.21%. In alkaline pH (Figure 6c), the surface of the TDAW@alginate was negatively charged, which is in favor of the electrostatic attraction forces occurring between TDAW@alginate and the MB cations.32
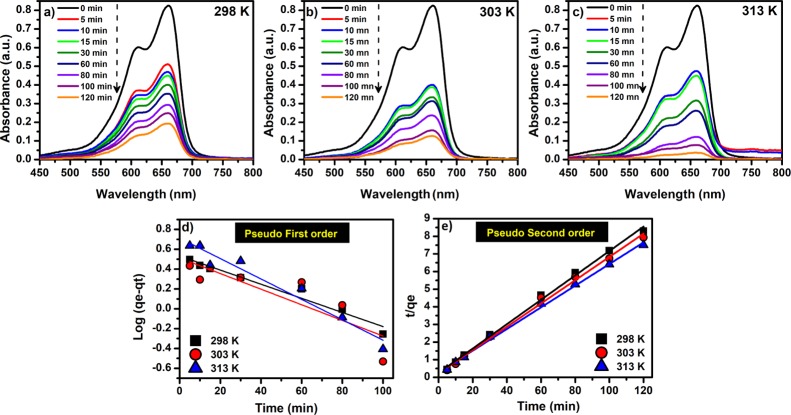
2.7. Effect of the Contact Time on the Removal of MB
The effect of the contact time was investigated in the interval of 5–120 min at different temperatures (25, 30, and 40 °C). Figure 7a–c shows the UV–visible absorption spectra as measured at different values of the contact time and temperature. It was found that the increasing temperature from 25° to 40 °C has slightly increased the MB removal efficiency. Therefore, these results indicate that the adsorption of the dye onto TDAW@alginate is a thermodynamically controlled process. Thus, our data are in agreement with the reported studies according to which the temperature has a positive influence on the mobility of the MB molecule.62,63 The optimum values of the equilibrium contact time and the temperature in the present work were found to be 120 min and 40 °C, respectively. Bare alginate beads were used for MB adsorption as shown in Figure S5a. The experimental results show that alginate bare beads have an adsorption rate of 12.24% (at 40 °C), 13.23% (at 40 °C), and 17.09% (at 40 °C) compared with TDAW@alginate, which shows the effectiveness of the TDAW adsorbed MB molecule (Figure 5a).
Figure 7.
Effect of the contact time on the extent of MB removal (a) at 298, (b) 303, and (c) 313 K; (d) pseudo first and (e) second order plots.
The pseudo-first-order (PFO) and the pseudo-second-order (PSO) adsorption kinetic models were investigated in order to determine the mechanism of the adsorption process. Figure 7d,e shows the linear plot of PFO and PSO models and Table 2 summarizes the different kinetic constant parameters obtained. From Table 2, it can be seen that the adsorption capacity qe,cal obtained from the plots of ln(qe – qt) versus t (Figure 7d) and the experimental value obtained at equilibrium (qe,exp) are not identical compared with those obtained from the PSO (Figure 7e). In addition, the value of the correlation coefficient found by PSO was higher (R2 > 0.99) than that of the PFO model. It comes out that the processes of MB adsorption on TDAW@alginate follow the PSO model.
Table 2. Characteristic Kinetic Adsorption Parameters.
| pseudo-first-order |
pseudo-second-order |
||||||
|---|---|---|---|---|---|---|---|
| T (K) | qe,exp (mg/g) | qe,cal (mg/g) | K1 (min–1) | R2 | qe,cal (mg/g) | K1 (min–1) | R2 |
| 298 | 14.46 | 1.703 | 0.0070 | 0.9616 | 14.451 | 0.0193 | 0.9970 |
| 303 | 15.13 | 1.669 | 0.0079 | 0.7605 | 15.152 | 0.0082 | 0.9958 |
| 313 | 16.01 | 2.039 | 0.0103 | 0.9547 | 16.287 | 0.0133 | 0.9973 |
The intra-particle model has been widely used to study the diffusion mechanism.64,65Figure 5b presents the intraparticle diffusion plot of MB adsorption onto TDAW@alginate, which shows no linear form (the linear plots did not pass through the origin). In general, if a plot of Qt against t0.5 is linear and passes through the origin, the adsorption is entirely governed by the intra-particle diffusion. In contrast, the adsorption process is controlled by a multistep mechanism.66 Based on these results, we conclude that the external mass transfer of MB molecules from an aqueous phase to the surface of TDAW@alginate was the first step in the adsorption mechanism: diffusion from the film to the particle surface: the adsorbate molecules are transported from the bulk liquid phase to the adsorbent external surface through a hydrodynamic boundary layer or film.65,66 Then, in the second stage, the MB molecules are diffused inside the pores and the last step is related to the adsorption uptake.
2.8. Adsorption Isotherms and Thermodynamic Parameters
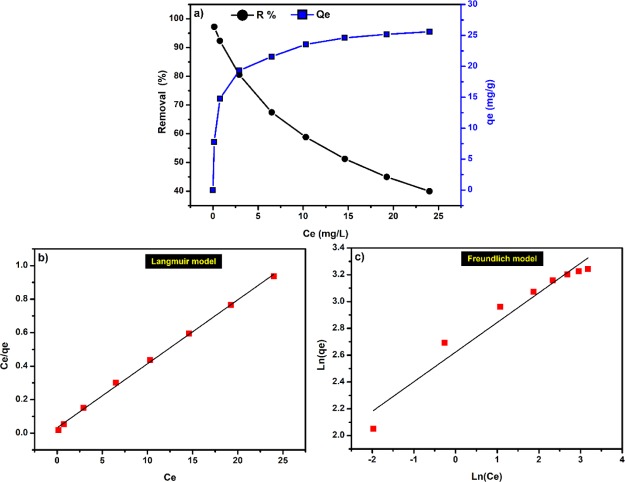
To find the equilibrium adsorbed amount of MB onto TDAW@alginate, the initial dye concentration was varied as depicted in Figure 8a. The adsorbed MB amount increases with the increasing initial dye concentration up to a plateau value. This behavior is explained by the strong gradient of MB concentration and the lack of active sites in TDAW@alginate, which makes the transfer of mass between the material and the liquid phase difficult. However, the removal efficiency is gradually decreased to values below 45% and adsorption equilibrium was achieved at a concentration of 15 mg/L.
Figure 8.
(a) Initial concentration effect of the MB dye on the adsorbed amount, (b) adsorption data fitted with Langmuir model and (c) adsorption data fitted with Freundlich model.
The adsorption isotherm of MB onto TDAW@alginate has been compared to both Langmuir and Freundlich theoretical models. The Langmuir model indicates the achievement of a homogeneous adsorbed monolayer whereas the Freundlich model shows the heterogeneity of the surface with multilayer adsorption.67−71Figure 8b,c shows the linear shapes of both models and the different parameters calculated are presented in Table S5. The correlation between the experimental and calculated data using both models was tested. The correlation coefficient shows a good fit in the case of Langmuir (R2 = 0.9984). The values of RL (=0.145–0.032) and n (calculated using the Freundlich equation) show a favorable adsorption of MB onto TDAW@alginate, which confirms that the adsorption of MB onto TDAW@alginate is a monolayer. In addition, the results of the thermodynamic study presented in Figure S6 and Table S6 show that:
The value of Ea is in the range of 16–40 kJ mol–1 suggests a physisorption process.72
ΔG < 0 indicates the spontaneous and favorable nature of the MB adsorption.73
The decrease of ΔG values implies that higher temperature favors the MB adsorption.73,74
ΔH < 0 suggests that the MB adsorption is exothermic. The ΔH value was less than 25 kJ·mol–1 indicates that MB adsorption onto TDAW@alginate involves mainly van der Waals type forces and confirms the physisorption nature of the adsorption.74,75
ΔS > 0 indicates an increase in the disorder degree of the adsorbed layer at the solid/solution interface.
2.9. RSM-CCD: Interactive Effects of Operational Parameters and Numerical Optimization
The RSM coupled with the CCD has been widely used for process optimization.76Table S7 summarizes the CCD matrix and experimental results of MB removal on TDAW@alginate. Based on Table S7, an empirical quadratic regression equation was obtained as
| 2 |
The adequacy of the regression model (eq 2) and significance of each coefficient was checked by analysis of variance (ANOVA) and the results obtained are depicted in Table S8. ANOVA analysis for the proposed model shows that all coefficients were significant, whereas the quadrature effect of MB concentration is insignificant (P-value = 0.747 > 0.05).77 The significance of the model was confirmed by the P-value which is less than 0.05 with a high F-value.78 The high values of R2 (=0.989) indicate the qualitative agreement between the predicted and experimental data obtained for the three variables under MB adsorption onto TDAW@alginate. The value of Radj2 shows that 2.2% of the response variation could not be explained by the model and that 97.8% of the MB removal variation was because of the independent variables. To evaluate the real system approximation of the model, normal probability versus studentized residual was investigated (Figure S7). This plot shows a normal distribution of residuals with a straight line, which confirms the normality of the model.76 The final model can be expressed using the following eq 3
| 3 |
The response surface (3D) and the corresponding contour plots (2D) were applied to show the effects of various independent variables influencing MB adsorption onto TDAW@alginate (Figure S8a,b). The plan of adsorbent dose–contact time at an initial concentration constant was chosen to optimize the adsorption process of MB onto TDAW@alginate. Indeed, a significant variation in the MB removal was observed in this plan compared with the others (adsorbent dose–MB concentration and MB concentration–contact time). In Figure S8b, an increase in the MB dye removal with the increasing adsorbent dose and contact time can be clearly seen which can be explained by the fact that the increase in the adsorbent dose facilitates more active sites for MB adsorption onto the TDAW@alginate surface.76
The 3D presentation of the adsorbent dose–contact time plan shows a croissant shape when the initial mass and the contact time vary. The optimal contact time for significant MB removal was equal to 45 min; at this value, the variation of the adsorbent dose from 6.34 to 23.66 mg was in favor of an increase in the MB removal by +40%. Therefore, numerical optimization was preferred to search the maximum MB removal using 3D and 2D presentations. 97.89 ± 2.62% MB removal was chosen as an optimum obtained at 23.3 mg, contact time of 45 min, an initial concentration of 9 mg/L, a temperature of 25 °C, and pH 10. To evaluate the value of the response (MB removal) using the postulated model, triplicate verification was realized. The experimental MB removal was found to be 98.12 ± 0.77%, demonstrating the accuracy of the model for predicting dye removal.
2.10. Regeneration of the TDAW@alginate Adsorbent
The reusability of the adsorbent was considered as a crucial economic factor when assessing the cost-effectiveness of the treatment process.4,34 Additionally, the recovery ability of the adsorbent was a very important index for industrial applicability. Generally, bead materials based on alginate form hydrogels which are insoluble in solution and allow the collection of the adsorbed dye quickly.79
In order to investigate the possibility of reusability of MB from TDAW@alginate, a regeneration experiment was carried out under optimum conditions found by the RSM using a solution with a pH of 2 and methanol. As shown in Figure S8c, the adsorption performance of TDAW@Ag was gradually decreased with the increasing regeneration cycles in both cases (with HCl or methanol). The regeneration with methanol successfully eluted 74.15% of the MB loaded onto TDAW@alginate after eight cycles of sorption–desorption. On the other hand, 90.81% was observed when HCl was used. The results reveal that TDAW@alginate shows high reusability efficiencies when HCl was used compared with methanol. The higher desorption efficiency at pH 2 is due to the excessive H+ ions, which replace the adsorbed MB molecules through the ion exchange process.80 No difference was found in the retrieved mass of TDAW@alginate after the six sorption–desorption cycles, indicating the recovery ability of TDAW@alginate, thereby making the dye-contaminated wastewater treatment more sustainable and economical.
2.11. Mechanism of MB Adsorption onto TDAW@alginate
The adsorption mechanism of MB dye onto TDAW@alginate was investigated based on FTIR spectra before and after MB adsorption (Figure 9). As we have reported elsewhere,53 the FTIR spectrum of the TDAW adsorbent contains many functional groups such as −OH, C=O, −C–O–, and some oxides like Al–O and P–O. The analysis of the FTIR spectrum of TDAW@alginate before MB adsorption shows the same characteristic bands. Therefore, the main functional groups of alginate are apparent at 3400, 1630, and 520 cm–1 attributed to −OH stretching, the carboxyl group, and characteristic bands of alginate, respectively.81 The sharp peak at 1095 cm–1 indicates the presence of the −C–O– stretching in the TDAW material. It is noted that the wide band at 520 cm–1 absorbs all characteristic bands of the oxide residual in the surface of TDAW, which are apparent on the surface of TDAW in this region. In addition, the FTIR spectrum of MB loaded TDAW@alginate shows that the peaks of −C–O– and −OH are slightly shifted from their original position by +67 and −80 cm–1, respectively. Moreover, the intensity of some bands such as C=O and −C–O– has been increased after MB fixation on the surface of TDAW@alginate. This confirms that these functional groups are involved in the adsorption of MB onto TDAW@alginate by electrostatic interaction. From these results, it can be concluded that the mechanism is mainly referred to the electrostatic interaction, pore sizes, and hydrogen bonding.
Figure 9.
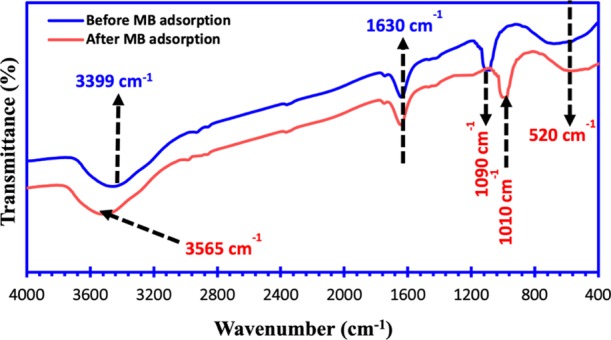
FTIR spectra of TDAW@alginate before and after the MB adsorption.
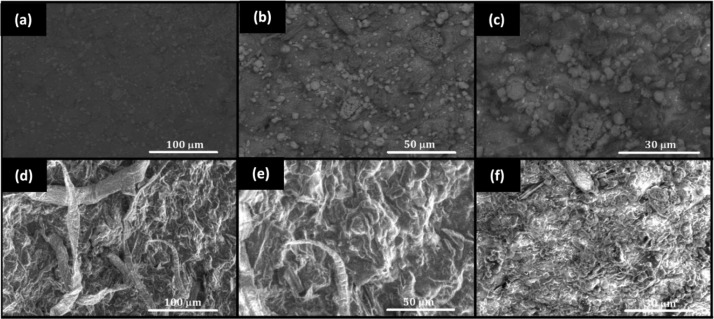
The first observation of SEM images of TDAW@alginate before and after MB adsorption shows changes in the topography as well as in the chemical contrast (Figure 10). These analyses allowed us to describe and explain the adsorption process of MB molecules on our spherical carbon material. Therefore, before the dye adsorption, the surface of TDAW@alginate was very thin and compact (Figure 10a–c). However, after the dye adsorption, the TDAW@alginate surface becomes rough and contains aggregates having different chemical contrasts (Figures 9d and 10e,f). These changes in the morphology confirm the adsorption of MB on the surface and in the interior of TDAW@alginate particles.
Figure 10.
SEM analyses of the prepared TDAW@alginate beads; (a–c) before and (d–f) after MB adsorption, respectively.
3. Conclusions
This work encompassed a systematic investigation on ACD and adsorption processes leading to efficient depollution and management of agri-food organic wastes. In the ACD process, BMP was successfully modified by the variation of three independent variables such as the pH, inoculum, and load, by using DOE-based CCD-RSM. Accordingly, higher microbial activity was observed at pH 7.42 with an inoculum/load ratio equal to 0.55 at 15 days of HRTs. In addition, the degradation of the OM present in agri-food wastes during the ACD process was confirmed by FTIR analysis, which showed the disappearance of polysaccharides and polysaccharide substances present in the wastes. The present work could be supplemented by examining the effect of waste mixing ratios on the cumulative methane yield, providing, hence, valuable insight into this topic.
Based on the modified digestion during the ACD process, the core–shell porous carbon material was prepared and showed higher MB molecule removal capacity from water. Furthermore, the comparison of the experimental adsorption data to the Langmuir model allowed the estimation of the adsorbed maximum amount, which achieved 26.178 mg/g. In addition, the adsorption process was found to be spontaneous and exothermic; the core–shell particles have shown high reusability efficiencies after eight cycles of sorption–desorption. These findings suggest that the coupling of the ACD and the adsorption process seems to be an efficient protocol for the following reasons:
Large amount of methane, as a source of clean energy, was generated.
Bio-digestate was converted into porous carbon with a very high surface area.
Core–shell particles were prepared using a biopolymer that is not toxic in water.
The problem of liquid/solid phase separation during adsorption processes was solved which reduces the filtration process financial cost.
4. Experimental Section
4.1. Chemical Reagents
The reagents used in this work are NaOH (Sigma-Aldrich, >98%), HCl (Sigma-Aldrich, 37%), MB (Sigma-Aldrich dye content, ≥82%), H2SO4 (Sigma-Aldrich, 99.99%), NaCl (Sigma-Aldrich, >99.5%), acetone (Sigma-Aldrich, for analysis), alginate (Sigma-Aldrich, primary grade), distilled water (laboratory grade), ethanol (Sigma-Aldrich, for analysis), KH2PO4, Na2HPO4, NH4Cl, CaCl2, MgCl2·6H2O, NaHCO3, Na2S·9H2O, (NH4)6Mo7O24·4H2O, and COCl2·6H2O et MnCl2·4H2O (Sigma-Aldrich, primary grade).
4.2. Substrates and Inoculum for Co-Anaerobic Digestion
The substrates used in this work to carry out ACD were collected from the industry active in several fields ranging from agricultural production to processing. These substrates represent the agri-food organic wastes generated by this industry and whose management is difficult. The agri-food organic wastes are of various types such as PW, LDP, LBS, and PCS. To achieve ACD and a mixture composed by these wastes, the proportions of preparation are presented in Table S1.
The inoculum, used to increase microbial diversity and the effectiveness of degradation, was prepared by a mixture of:
-
(i)
Primary treatment sludge from anaerobic decantation of treatment plant wastewater constituting the normal inoculum (INp).
-
(ii)
Sludge diluted in a basic medium specific to the methanogenic bacteria constituting the synthetic inoculum (INS).82,83
The inoculum preparation method is presented in Table S1. The synthesized inoculum was stored for 15 days at 38 °C to ensure the degradation of the OM.5 The details of physicochemical characteristics of the inoculum and its contents are given in Table S1.
4.3. Batch Adsorption Study and Regeneration Experiments
In the present work, the TDAW@alginate was used as the adsorbent to remove MB molecules from water, and the influence of five parameters was tested. Thus, the effect of the TDAW@alginate dose was investigated for a contact time of 160 min, a volume of the dye aqueous solution of 40 mL, a dye concentration of 10 mg/L, and a natural pH. The effect of pH on MB adsorption onto TDAW@alginate was investigated using 40 mL of MB (10 mg/L) for different pH values (3–12), at room temperature. The effects of the contact time (from 0 to 120 mn) and the initial dye concentration (from 5 to 40 mg/L) were evaluated by using 25 mg of TDAW@alginate and 40 mL of the MB aqueous solution. Finally, samples were withdrawn from the solution using a previously cleaned spatula; then the residual MB concentrations were determined by measuring the absorbance at λmax = 664 nm of the supernatant. In order to investigate the adsorbent reusability, 25 mg of TDAW@alginate loaded with MB was washed thoroughly in 20 mL of HCl (0.1 M) or methanol, and then the mixture was magnetically stirred for 30 min. Eight cycles of adsorption–desorption studies were carried out. Different equations used in this work to fit the data are presented in Table S9.
Acknowledgments
This work was supported by the MNEFPESRS, CNRST, SCAC, IFM, Institute of Materials Science Mulhouse—University of Upper Alsace, and Materials and Environment Laboratory (LME)—Ibn Zohr University in the framework of Franco-Moroccan cooperation, research projects under no. 08/00057. We thank the MAScIR foundation for their support. We thank the MAScIR foundation for their support. We thank OSIEN Ludovic and MICHELIN Laure for XRD analyses. We thank FIOUX Philippe (IS2M-Mulhouse-France) for XPS analyses. We thank VIDAL Loïc (IS2M-Mulhouse-France) and KNOPF Stéphan (IS2M-Mulhouse-France) for SEM and TEM analyses, respectively.
Supporting Information Available
The Supporting Information is available free of charge on the ACS Publications website at DOI: 10.1021/acsomega.9b00524.
More details on physicochemical parameters, structural and spectroscopic characterization, modeling and fitting equations, and ACD experiments can be found in the Supporting Information (PDF)
Author Present Address
# King Abdullah University of Science and Technology (KAUST), Division of Physical Science and Engineering (PSE).
Author Contributions
Z.A., H.A.A., A.J., and N.E.A. conceived the idea and designed the experiments; Z.A. and A.J. characterized the materials; A.A., A.A.E.F., M.Z, R.E.H., and S.L. helped to perform the experimental adsorption and co-digestion experiments. Z.A., H.A.A., and M.Z. wrote the manuscript. All authors have given approval to the final version of the manuscript.
The authors declare no competing financial interest.
Supplementary Material
References
- Miraboutalebi S. M.; Nikouzad S. K.; Peydayesh M.; Allahgholi N.; Vafajoo L.; McKay G. Methylene Blue Adsorption via Maize Silk Powder: Kinetic, Equilibrium, Thermodynamic Studies and Residual Error Analysis. Process Saf. Environ. Prot. 2017, 106, 191–202. 10.1016/j.psep.2017.01.010. [DOI] [Google Scholar]
- Edwards J.; Othman M.; Burn S. A Review of Policy Drivers and Barriers for the Use of Anaerobic Digestion in Europe, the United States and Australia. Renewable Sustainable Energy Rev. 2015, 52, 815–828. 10.1016/j.rser.2015.07.112. [DOI] [Google Scholar]
- Strömberg S.; Nistor M.; Liu J. Towards Eliminating Systematic Errors Caused by the Experimental Conditions in Biochemical Methane Potential (BMP) Tests. Waste Manag. 2014, 34, 1939–1948. 10.1016/j.wasman.2014.07.018. [DOI] [PubMed] [Google Scholar]
- Jung K.-W.; Choi B. H.; Hwang M.-J.; Jeong T.-U.; Ahn K.-H. Fabrication of Granular Activated Carbons Derived from Spent Coffee Grounds by Entrapment in Calcium Alginate Beads for Adsorption of Acid Orange 7 and Methylene Blue. Bioresour. Technol. 2016, 219, 185–195. 10.1016/j.biortech.2016.07.098. [DOI] [PubMed] [Google Scholar]
- Angelidaki I.; Alves M.; Bolzonella D.; Borzacconi L.; Campos J. L.; Guwy A. J.; Kalyuzhnyi S.; Jenicek P.; Van Lier J. B. Defining the Biomethane Potential (BMP) of Solid Organic Wastes and Energy Crops: A Proposed Protocol for Batch Assays. Water Sci. Technol. 2009, 59, 927–934. 10.2166/wst.2009.040. [DOI] [PubMed] [Google Scholar]
- Ariunbaatar J.; Panico A.; Esposito G.; Pirozzi F.; Lens P. N. L. Pretreatment Methods to Enhance Anaerobic Digestion of Organic Solid Waste. Appl. Energy 2014, 123, 143–156. 10.1016/j.apenergy.2014.02.035. [DOI] [Google Scholar]
- Shen Y.; Linville J. L.; Urgun-Demirtas M.; Schoene R. P.; Snyder S. W. Producing pipeline-quality biomethane via anaerobic digestion of sludge amended with corn stover biochar with in-situ CO2 removal. Appl. Energy 2015, 158, 300–309. 10.1016/j.apenergy.2015.08.016. [DOI] [Google Scholar]
- Goel J.; Kadirvelu K.; Rajagopal C.; Garg V. K. Cadmium(II) Uptake from Aqueous Solution by Adsorption onto Carbon Aerogel Using a Response Surface Methodological Approach. Ind. Eng. Chem. Res. 2006, 45, 6531–6537. 10.1021/ie060010u. [DOI] [Google Scholar]
- Ozay Y.; Ünşar E. K.; Işık Z.; Yılmaz F.; Dizge N.; Perendeci N. A.; Mazmanci M. A.; Yalvac M. Optimization of Electrocoagulation Process and Combination of Anaerobic Digestion for the Treatment of Pistachio Processing Wastewater. J. Cleaner Prod. 2018, 196, 42–50. 10.1016/j.jclepro.2018.05.242. [DOI] [Google Scholar]
- Su R.; Li Q.; Chen Y.; Gao B.; Yue Q.; Zhou W. One-Step Synthesis of Cu2O@carbon Nanocapsules Composites Using Sodium Alginate as Template and Characterization of Their Visible Light Photocatalytic Properties. J. Cleaner Prod. 2019, 209, 20–29. 10.1016/j.jclepro.2018.10.234. [DOI] [Google Scholar]
- Liu S.; Chen X.; Ai W.; Wei C. A New Method to Prepare Mesoporous Silica from Coal Gasification Fine Slag and Its Application in Methylene Blue Adsorption. J. Cleaner Prod. 2019, 212, 1062–1071. 10.1016/j.jclepro.2018.12.060. [DOI] [Google Scholar]
- Wong S.; Tumari H. H.; Ngadi N.; Mohamed N. B.; Hassan O.; Mat R.; Saidina Amin N. A. Adsorption of Anionic Dyes on Spent Tea Leaves Modified with Polyethyleneimine (PEI-STL). J. Cleaner Prod. 2019, 206, 394–406. 10.1016/j.jclepro.2018.09.201. [DOI] [Google Scholar]
- Serrano León E.; Perales Vargas-Machuca J. A.; Lara Corona E.; Arbib Z.; Rogalla F.; Fernández Boizán M. Anaerobic Digestion of Municipal Sewage under Psychrophilic Conditions. J. Cleaner Prod. 2018, 198, 931–939. 10.1016/j.jclepro.2018.07.060. [DOI] [Google Scholar]
- Novais R. M.; Caetano A. P. F.; Seabra M. P.; Labrincha J. A.; Pullar R. C. Extremely Fast and Efficient Methylene Blue Adsorption Using Eco-Friendly Cork and Paper Waste-Based Activated Carbon Adsorbents. J. Cleaner Prod. 2018, 197, 1137–1147. 10.1016/j.jclepro.2018.06.278. [DOI] [Google Scholar]
- da Silva T. L.; da Silva A. C.; Vieira M. G. A.; Gimenes M. L.; da Silva M. G. C. Biosorption study of copper and zinc by particles produced from silk sericin - alginate blend: evaluation of blend proportion and thermal cross-linking process in particles production. J. Cleaner Prod. 2016, 137, 1470–1478. 10.1016/j.jclepro.2015.05.067. [DOI] [Google Scholar]
- Kuczman O.; Gueri M. V. D.; De Souza S. N. M.; Schirmer W. N.; Alves H. J.; Secco D.; Buratto W. G.; Ribeiro C. B.; Hernandes F. B. Food Waste Anaerobic Digestion of a Popular Restaurant in Southern Brazil. J. Cleaner Prod. 2018, 196, 382–389. 10.1016/j.jclepro.2018.05.282. [DOI] [Google Scholar]
- Kumar A.; Jena H. M. Removal of Methylene Blue and Phenol onto Prepared Activated Carbon from Fox Nutshell by Chemical Activation in Batch and Fixed-Bed Column. J. Cleaner Prod. 2016, 137, 1246–1259. 10.1016/j.jclepro.2016.07.177. [DOI] [Google Scholar]
- Bedoić R.; Čuček L.; Ćosić B.; Krajnc D.; Smoljanić G.; Kravanja Z.; Ljubas D.; Pukšec T.; Duić N. Green Biomass to Biogas – a Study on Anaerobic Digestion of Residue Grass. J. Cleaner Prod. 2018, 213, 700–709. 10.1016/j.jclepro.2018.12.224. [DOI] [Google Scholar]
- Moretti M.; Van Dael M.; Malina R.; Van Passel S. Environmental Assessment of Waste Feedstock Mono-Dimensional and Bio-Refinery Systems: Combining Manure Co-Digestion and Municipal Waste Anaerobic Digestion. J. Cleaner Prod. 2018, 171, 954–961. 10.1016/j.jclepro.2017.10.097. [DOI] [Google Scholar]
- Pfluger A.; Coontz J.; Zhiteneva V.; Gulliver T.; Cherry L.; Cavanaugh L.; Figueroa L. Anaerobic Digestion and Biogas Beneficial Use at Municipal Wastewater Treatment Facilities in Colorado: A Case Study Examining Barriers to Widespread Implementation. J. Cleaner Prod. 2019, 206, 97–107. 10.1016/j.jclepro.2018.09.161. [DOI] [Google Scholar]
- Ahmad A.; Bhat A. H.; Buang A. Biosorption of Transition Metals by Freely Suspended and Ca-Alginate Immobilised with Chlorella Vulgaris: Kinetic and Equilibrium Modeling. J. Cleaner Prod. 2018, 171, 1361–1375. 10.1016/j.jclepro.2017.09.252. [DOI] [Google Scholar]
- Luo G.; Wang W.; Angelidaki I. Anaerobic Digestion for Simultaneous Sewage Sludge Treatment and CO Biomethanation: Process Performance and Microbial Ecology. Environ. Sci. Technol. 2013, 47, 10685–10693. 10.1021/es401018d. [DOI] [PubMed] [Google Scholar]
- Xie S.; Wickham R.; Nghiem L. D. Synergistic Effect from Anaerobic Co-Digestion of Sewage Sludge and Organic Wastes. Int. Biodeterior. Biodegrad. 2017, 116, 191–197. 10.1016/j.ibiod.2016.10.037. [DOI] [Google Scholar]
- Zou S.; Wang H.; Wang X.; Zhou S.; Li X.; Feng Y. Application of Experimental Design Techniques in the Optimization of the Ultrasonic Pretreatment Time and Enhancement of Methane Production in Anaerobic Co-Digestion. Appl. Energy 2016, 179, 191–202. 10.1016/j.apenergy.2016.06.120. [DOI] [Google Scholar]
- Wang X.; Yang G.; Li F.; Feng Y.; Ren G.; Han X. Evaluation of Two Statistical Methods for Optimizing the Feeding Composition in Anaerobic Co-Digestion: Mixture Design and Central Composite Design. Bioresour. Technol. 2013, 131, 172–178. 10.1016/j.biortech.2012.12.174. [DOI] [PubMed] [Google Scholar]
- Vadivelan V.; Kumar K. V. Equilibrium, Kinetics, Mechanism, and Process Design for the Sorption of Methylene Blue onto Rice Husk. J. Colloid Interface Sci. 2005, 286, 90–100. 10.1016/j.jcis.2005.01.007. [DOI] [PubMed] [Google Scholar]
- Pathania D.; Sharma S.; Singh P. Removal of Methylene Blue by Adsorption onto Activated Carbon Developed from Ficus Carica Bast. Arabian J. Chem. 2017, 10, S1445–S1451. 10.1016/j.arabjc.2013.04.021. [DOI] [Google Scholar]
- Zbair M.; Ainassaari K.; Drif A.; Ojala S.; Bottlinger M.; Pirilä M.; Keiski R. L.; Bensitel M.; Brahmi R. Toward New Benchmark Adsorbents: Preparation and Characterization of Activated Carbon from Argan Nut Shell for Bisphenol A Removal. Environ. Sci. Pollut. Res. 2018, 25, 1869–1882. 10.1007/s11356-017-0634-6. [DOI] [PubMed] [Google Scholar]
- Zbair M.; Anfar Z.; Ait Ahsaine H.; El Alem N.; Ezahri M. Acridine orange adsorption by zinc oxide/almond shell activated carbon composite: Operational factors, mechanism and performance optimization using central composite design and surface modeling. J. Environ. Manage. 2018, 206, 383–397. 10.1016/j.jenvman.2017.10.058. [DOI] [PubMed] [Google Scholar]
- Fabryanty R.; Valencia C.; Soetaredjo F. E.; Putro J. N.; Santoso S. P.; Kurniawan A.; Ju Y.-H.; Ismadji S. Removal of crystal violet dye by adsorption using bentonite - alginate composite. J. Environ. Chem. Eng. 2017, 5, 5677–5687. 10.1016/j.jece.2017.10.057. [DOI] [Google Scholar]
- Nasrullah A.; Bhat A. H.; Naeem A.; Isa M. H.; Danish M. High Surface Area Mesoporous Activated Carbon-Alginate Beads for Efficient Removal of Methylene Blue. Int. J. Biol. Macromol. 2018, 107, 1792–1799. 10.1016/j.ijbiomac.2017.10.045. [DOI] [PubMed] [Google Scholar]
- Rocher V.; Bee A.; Siaugue J.-M.; Cabuil V. Dye Removal from Aqueous Solution by Magnetic Alginate Beads Crosslinked with Epichlorohydrin. J. Hazard. Mater. 2010, 178, 434–439. 10.1016/j.jhazmat.2010.01.100. [DOI] [PubMed] [Google Scholar]
- Hassan A. F.; Abdel-Mohsen A. M.; Fouda M. M. G. Comparative Study of Calcium Alginate, Activated Carbon, and Their Composite Beads on Methylene Blue Adsorption. Carbohydr. Polym. 2014, 102, 192–198. 10.1016/j.carbpol.2013.10.104. [DOI] [PubMed] [Google Scholar]
- Benhouria A.; Islam M. A.; Zaghouane-Boudiaf H.; Boutahala M.; Hameed B. H. Calcium Alginate-Bentonite-Activated Carbon Composite Beads as Highly Effective Adsorbent for Methylene Blue. Chem. Eng. J. 2015, 270, 621–630. 10.1016/j.cej.2015.02.030. [DOI] [Google Scholar]
- Mohamed S. K.; Hegazy S. H.; Abdelwahab N. A.; Ramadan A. M. Coupled Adsorption-Photocatalytic Degradation of Crystal Violet under Sunlight Using Chemically Synthesized Grafted Sodium Alginate/ZnO/Graphene Oxide Composite. Int. J. Biol. Macromol. 2017, 108, 1185–1198. 10.1016/j.ijbiomac.2017.11.028. [DOI] [PubMed] [Google Scholar]
- Wang B.; Gao B.; Fang J. Recent Advances in Engineered Biochar Productions and Applications. Crit. Rev. Environ. Sci. Technol. 2017, 47, 2158–2207. 10.1080/10643389.2017.1418580. [DOI] [Google Scholar]
- Qian K.; Kumar A.; Zhang H.; Bellmer D.; Huhnke R. Recent Advances in Utilization of Biochar. Renewable Sustainable Energy Rev. 2015, 42, 1055–1064. 10.1016/j.rser.2014.10.074. [DOI] [Google Scholar]
- Ok Y. S.; Chang S. X.; Gao B.; Chung H.-J. SMART Biochar Technology-A Shifting Paradigm towards Advanced Materials and Healthcare Research. Environ. Technol. Innov. 2015, 4, 206–209. 10.1016/j.eti.2015.08.003. [DOI] [Google Scholar]
- Rajapaksha A. U.; Chen S. S.; Tsang D. C. W.; Zhang M.; Vithanage M.; Mandal S.; Gao B.; Bolan N. S.; Ok Y. S. Engineered/Designer Biochar for Contaminant Removal/Immobilization from Soil and Water: Potential and Implication of Biochar Modification. Chemosphere 2016, 148, 276–291. 10.1016/j.chemosphere.2016.01.043. [DOI] [PubMed] [Google Scholar]
- Inyang M.; Gao B.; Yao Y.; Xue Y.; Zimmerman A. R.; Pullammanappallil P.; Cao X. Removal of Heavy Metals from Aqueous Solution by Biochars Derived from Anaerobically Digested Biomass. Bioresour. Technol. 2012, 110, 50–56. 10.1016/j.biortech.2012.01.072. [DOI] [PubMed] [Google Scholar]
- Inyang M.; Gao B.; Zimmerman A.; Zhang M.; Chen H. Synthesis, Characterization, and Dye Sorption Ability of Carbon Nanotube-Biochar Nanocomposites. Chem. Eng. J. 2014, 236, 39–46. 10.1016/j.cej.2013.09.074. [DOI] [Google Scholar]
- Yao Y.; Gao B.; Inyang M.; Zimmerman A. R.; Cao X.; Pullammanappallil P.; Yang L. Biochar Derived from Anaerobically Digested Sugar Beet Tailings: Characterization and Phosphate Removal Potential. Bioresour. Technol. 2011, 102, 6273–6278. 10.1016/j.biortech.2011.03.006. [DOI] [PubMed] [Google Scholar]
- Inyang M.; Gao B.; Ding W.; Pullammanappallil P.; Zimmerman A. R.; Cao X. Enhanced Lead Sorption by Biochar Derived from Anaerobically Digested Sugarcane Bagasse. Sep. Sci. Technol. 2011, 46, 1950–1956. 10.1080/01496395.2011.584604. [DOI] [Google Scholar]
- Inyang M.; Gao B.; Pullammanappallil P.; Ding W.; Zimmerman A. R. Biochar from Anaerobically Digested Sugarcane Bagasse. Bioresour. Technol. 2010, 101, 8868–8872. 10.1016/j.biortech.2010.06.088. [DOI] [PubMed] [Google Scholar]
- Kim T. Y.; Jin H. J.; Park S. S.; Kim S. J.; Cho S. Y. Adsorption Equilibrium of Copper Ion and Phenol by Powdered Activated Carbon, Alginate Bead and Alginate-Activated Carbon Bead. J. Ind. Eng. Chem. 2008, 14, 714–719. 10.1016/j.jiec.2008.07.004. [DOI] [Google Scholar]
- Chen Y.; Cheng J. J.; Creamer K. S. Inhibition of Anaerobic Digestion Process: A Review. Bioresour. Technol. 2008, 99, 4044–4064. 10.1016/j.biortech.2007.01.057. [DOI] [PubMed] [Google Scholar]
- Rodier J.; Legube B.; Merlet N.. Analyse de l’eau Rodier, 9th ed.; Rodie J., Eds.; Dunod: Paris, 2009. [Google Scholar]
- Kavacik B.; Topaloglu B. Biogas Production from Co-Digestion of a Mixture of Cheese Whey and Dairy Manure. Biomass Bioenergy 2010, 34, 1321–1329. 10.1016/j.biombioe.2010.04.006. [DOI] [Google Scholar]
- Rajesh Banu J.; Anandan S.; Kaliappan S.; Yeom I.-T. Treatment of Dairy Wastewater Using Anaerobic and Solar Photocatalytic Methods. Sol. Energy 2008, 82, 812–819. 10.1016/j.solener.2008.02.015. [DOI] [Google Scholar]
- Marcato C.-E.; Mohtar R.; Revel J.-C.; Pouech P.; Hafidi M.; Guiresse M. Impact of Anaerobic Digestion on Organic Matter Quality in Pig Slurry. Int. Biodeterior. Biodegrad. 2009, 63, 260–266. 10.1016/j.ibiod.2008.10.001. [DOI] [Google Scholar]
- Droussi Z.; D’orazio V.; Provenzano M. R.; Hafidi M.; Ouatmane A. Study of the biodegradation and transformation of olive-mill residues during composting using FTIR spectroscopy and differential scanning calorimetry. J. Hazard. Mater. 2009, 164, 1281–1285. 10.1016/j.jhazmat.2008.09.081. [DOI] [PubMed] [Google Scholar]
- Bagheri A. R.; Ghaedi M.; Asfaram A.; Bazrafshan A. A.; Jannesar R. Comparative study on ultrasonic assisted adsorption of dyes from single system onto Fe 3 O 4 magnetite nanoparticles loaded on activated carbon: Experimental design methodology. Ultrason. Sonochem. 2017, 34, 294–304. 10.1016/j.ultsonch.2016.05.047. [DOI] [PubMed] [Google Scholar]
- Anfar Z.; El Haouti R.; Lhanafi S.; Benafqir M.; Azougarh Y.; El Alem N. Treated Digested Residue during Anaerobic Co-Digestion of Agri-Food Organic Waste: Methylene Blue Adsorption, Mechanism and CCD-RSM Design. J. Environ. Chem. Eng. 2017, 5, 5857–5867. 10.1016/j.jece.2017.11.015. [DOI] [Google Scholar]
- Kashi S.; Satari B.; Lundin M.; Horváth I. S.; Othman M. Application of a Mixture Design to Identify the Effects of Substrates Ratios and Interactions on Anaerobic Co-Digestion of Municipal Sludge, Grease Trap Waste, and Meat Processing Waste. J. Environ. Chem. Eng. 2017, 5, 6156–6164. 10.1016/j.jece.2017.11.045. [DOI] [Google Scholar]
- Maragkaki A. E.; Fountoulakis M.; Kyriakou A.; Lasaridi K.; Manios T. Boosting Biogas Production from Sewage Sludge by Adding Small Amount of Agro-Industrial by-Products and Food Waste Residues. Waste Manag. 2018, 71, 605–611. 10.1016/j.wasman.2017.04.024. [DOI] [PubMed] [Google Scholar]
- Vivekanand V.; Mulat D. G.; Eijsink V. G. H.; Horn S. J. Synergistic Effects of Anaerobic Co-Digestion of Whey, Manure and Fish Ensilage. Bioresour. Technol. 2018, 249, 35–41. 10.1016/j.biortech.2017.09.169. [DOI] [PubMed] [Google Scholar]
- Demirer G. N.; Chen S. Two-Phase Anaerobic Digestion of Unscreened Dairy Manure. Process Biochem. 2005, 40, 3542–3549. 10.1016/j.procbio.2005.03.062. [DOI] [Google Scholar]
- Amon T.; Amon B.; Kryvoruchko V.; Bodiroza V.; Pötsch E.; Zollitsch W. Optimising Methane Yield from Anaerobic Digestion of Manure: Effects of Dairy Systems and of Glycerine Supplementation. Int. Congr. Ser. 2006, 1293, 217–220. 10.1016/j.ics.2006.03.007. [DOI] [Google Scholar]
- Ince O. Performance of a Two-Phase Anaerobic Digestion System When Treating Dairy Wastewater. Water Res. 1998, 32, 2707–2713. 10.1016/s0043-1354(98)00036-0. [DOI] [Google Scholar]
- Ahsaine H. A.; Zbair M.; Anfar Z.; Naciri Y.; haouti R. E.; Alem N. E.; Ezahri M. Cationic Dyes Adsorption onto High Surface Area “Almond Shell” Activated Carbon: Kinetics , Equilibrium Isotherms and Surface Statistical Modeling. Mater. Today Chem. 2018, 8, 121–132. 10.1016/j.mtchem.2018.03.004. [DOI] [Google Scholar]
- Haldorai Y.; Voit W.; Shim J.-J. Nano ZnO@reduced Graphene Oxide Composite for High Performance Supercapacitor: Green Synthesis in Supercritical Fluid. Electrochim. Acta 2014, 120, 65–72. 10.1016/j.electacta.2013.12.063. [DOI] [Google Scholar]
- Wang Y.; Wang W.; Wang A. Efficient Adsorption of Methylene Blue on an Alginate-Based Nanocomposite Hydrogel Enhanced by Organo-Illite/Smectite Clay. Chem. Eng. J. 2013, 228, 132–139. 10.1016/j.cej.2013.04.090. [DOI] [Google Scholar]
- Hassani A.; Soltani R. D. C.; Karaca S.; Khataee A. Preparation of Montmorillonite-Alginate Nanobiocomposite for Adsorption of a Textile Dye in Aqueous Phase: Isotherm, Kinetic and Experimental Design Approaches. J. Ind. Eng. Chem. 2015, 21, 1197–1207. 10.1016/j.jiec.2014.05.034. [DOI] [Google Scholar]
- Weber W. J.; Morris J. C. Kinetics of Adsorption Carbon from Solutions. J. Sanit. Eng. Div. Am. Soc. Civ. Eng. 1963, 89, 31–60. [Google Scholar]
- Weber W. J.; Smith E. H. Simulation and Design Models for Adsorption Processes. Environ. Sci. Technol. 1987, 21, 1040–1050. 10.1021/es00164a002. [DOI] [Google Scholar]
- Tran H. N.; You S.-J.; Hosseini-Bandegharaei A.; Chao H.-P. Mistakes and Inconsistencies Regarding Adsorption of Contaminants from Aqueous Solutions: A Critical Review. Water Res. 2017, 120, 88–116. 10.1016/j.watres.2017.04.014. [DOI] [PubMed] [Google Scholar]
- Tanyildizi M. Ş. Modeling of Adsorption Isotherms and Kinetics of Reactive Dye from Aqueous Solution by Peanut Hull. Chem. Eng. J. 2011, 168, 1234–1240. 10.1016/j.cej.2011.02.021. [DOI] [Google Scholar]
- Laabd M.; Ait Ahsaine H.; Jaouhari A. E.; Bakiz B.; Bazzaoui M.; Ezahri M.; Albourine A.; Benlhachemi A. Congo red removal by PANi/Bi 2 WO 6 nanocomposites: Kinetic, equilibrium and thermodynamic studies. J. Environ. Chem. Eng. 2016, 4, 3096–3105. 10.1016/j.jece.2016.06.024. [DOI] [Google Scholar]
- Ahsaine H. A.; Zbair M.; El Haouti R. Mesoporous Treated Sewage Sludge as Outstanding Low-Cost Adsorbent for Cadmium Removal. Desalin. Water Treat. 2017, 85, 330–338. 10.5004/dwt.2017.21310. [DOI] [Google Scholar]
- Langmuir I. The Constitution and Fundamental Properties of Solids and Liquids. Part I. Solids. J. Am. Chem. Soc. 1916, 38, 2221–2295. 10.1021/ja02268a002. [DOI] [Google Scholar]
- Freundlich H. Über Die Adsorption in Lösungen. Z. Phys. Chem. 1907, 57U, 385–470. 10.1515/zpch-1907-5723. [DOI] [Google Scholar]
- Guo J.-Z.; Li B.; Liu L.; Lv K. Removal of Methylene Blue from Aqueous Solutions by Chemically Modified Bamboo. Chemosphere 2014, 111, 225–231. 10.1016/j.chemosphere.2014.03.118. [DOI] [PubMed] [Google Scholar]
- Borah L.; Goswami M.; Phukan P. Adsorption of Methylene Blue and Eosin Yellow Using Porous Carbon Prepared from Tea Waste: Adsorption Equilibrium, Kinetics and Thermodynamics Study. J. Environ. Chem. Eng. 2015, 3, 1018–1028. 10.1016/j.jece.2015.02.013. [DOI] [Google Scholar]
- Fan S.; Wang Y.; Wang Z.; Tang J.; Tang J.; Li X. Removal of Methylene Blue from Aqueous Solution by Sewage Sludge-Derived Biochar: Adsorption Kinetics, Equilibrium, Thermodynamics and Mechanism. J. Environ. Chem. Eng. 2017, 5, 601–611. 10.1016/j.jece.2016.12.019. [DOI] [Google Scholar]
- Zbair M.; Ait Ahsaine H.; Anfar Z.; Slassi A. Carbon microspheres derived from walnut shell: Rapid and remarkable uptake of heavy metal ions, molecular computational study and surface modeling. Chemosphere 2019, 231, 140–150. 10.1016/j.chemosphere.2019.05.120. [DOI] [PubMed] [Google Scholar]
- Ahmad R.; Hasan I. Optimization of the Adsorption of Pb (II) from Aqueous Solution onto PAB Nanocomposite Using Response Surface Methodology. Environ. Nanotechnol., Monit. Manag. 2016, 6, 116–129. 10.1016/j.enmm.2016.09.002. [DOI] [Google Scholar]
- Auta M.; Hameed B. H. Optimized Waste Tea Activated Carbon for Adsorption of Methylene Blue and Acid Blue 29 Dyes Using Response Surface Methodology. Chem. Eng. J. 2011, 175, 233–243. 10.1016/j.cej.2011.09.100. [DOI] [Google Scholar]
- Esmaeili A.; Khoshnevisan N. Optimization of Process Parameters for Removal of Heavy Metals by Biomass of Cu and Co-Doped Alginate-Coated Chitosan Nanoparticles. Bioresour. Technol. 2016, 218, 650–658. 10.1016/j.biortech.2016.07.005. [DOI] [PubMed] [Google Scholar]
- Thakur S.; Pandey S.; Arotiba O. A. Development of a Sodium Alginate-Based Organic/Inorganic Superabsorbent Composite Hydrogel for Adsorption of Methylene Blue. Carbohydr. Polym. 2016, 153, 34–46. 10.1016/j.carbpol.2016.06.104. [DOI] [PubMed] [Google Scholar]
- Li Y.; Du Q.; Liu T.; Sun J.; Wang Y.; Wu S.; Wang Z.; Xia Y.; Xia L. Methylene Blue Adsorption on Graphene Oxide/Calcium Alginate Composites. Carbohydr. Polym. 2013, 95, 501–507. 10.1016/j.carbpol.2013.01.094. [DOI] [PubMed] [Google Scholar]
- Belhouchat N.; Zaghouane-boudiaf H.; Viseras C. Removal of Anionic and Cationic Dyes from Aqueous Solution with Activated Organo-Bentonite/Sodium Alginate Encapsulated Beads. Appl. Clay Sci. 2016, 135, 9–15. 10.1016/j.clay.2016.08.031. [DOI] [Google Scholar]
- Gil A.; Siles J. Á.; Serrano A.; Martín M. Á. Mixture Optimization of Anaerobic Co-Digestion of Tomato and Cucumber Waste. Environ. Technol. 2015, 36, 2628–2636. 10.1080/09593330.2015.1041425. [DOI] [PubMed] [Google Scholar]
- Wang J. Y.; Zhang H.; Stabnikova O.; Tay J. H. Comparison of Lab-Scale and Pilot-Scale Hybrid Anaerobic Solid-Liquid Systems Operated in Batch and Semi-Continuous Modes. Process Biochem. 2005, 40, 3580–3586. 10.1016/j.procbio.2005.03.047. [DOI] [Google Scholar]
Associated Data
This section collects any data citations, data availability statements, or supplementary materials included in this article.


