Abstract
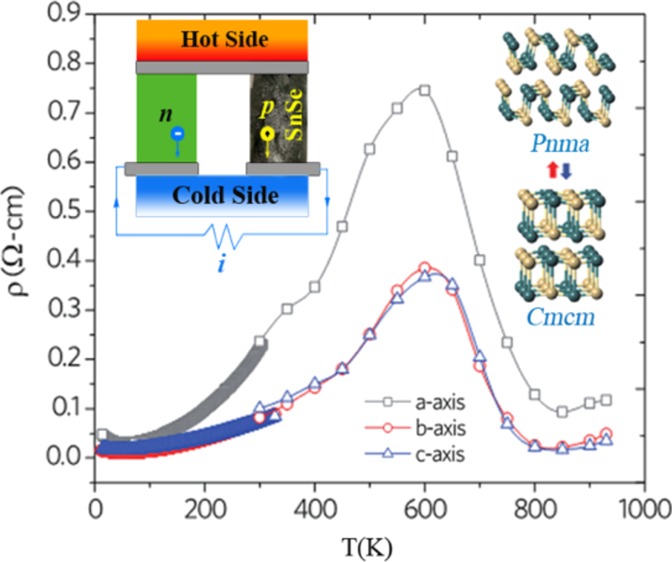
Single-crystalline SnSe has attracted much attention because of its record high figure-of-merit ZT ≈ 2.6; however, this high ZT has been associated with the low mass density of samples which leaves the intrinsic ZT of fully dense pristine SnSe in question. To this end, we prepared high-quality fully dense SnSe single crystals and performed detailed structural, electrical, and thermal transport measurements over a wide temperature range along the major crystallographic directions. Our single crystals were fully dense and of high purity as confirmed via high statistics 119Sn Mössbauer spectroscopy that revealed <0.35 at. % Sn(IV) in pristine SnSe. The temperature-dependent heat capacity (Cp) provided evidence for the displacive second-order phase transition from Pnma to Cmcm phase at Tc ≈ 800 K and a small but finite Sommerfeld coefficient γ0 which implied the presence of a finite Fermi surface. Interestingly, despite its strongly temperature-dependent band gap inferred from density functional theory calculations, SnSe behaves like a low-carrier-concentration multiband metal below 600 K, above which it exhibits a semiconducting behavior. Notably, our high-quality single-crystalline SnSe exhibits a thermoelectric figure-of-merit ZT ∼1.0, ∼0.8, and ∼0.25 at 850 K along the b, c, and a directions, respectively.
1. Introduction
Thermoelectric (TE) materials enable a green conversion of waste heat to electrical energy. This conversion efficiency is mainly determined by the dimensionless figure-of-merit ZT = S2T/ρκ, where ρ, S, T, and, κ are the electrical resistivity, Seebeck coefficient, absolute temperature, and thermal conductivity, respectively. In the simplest case, κ = κE + κL, where κE and κL are the electronic and lattice contributions, respectively, and the power factor, PF = S2/ρ, is often defined to measure the electrical performance of the material. Several effective approaches for enhancing ZT have been devised, for example, reduced dimensionality,1 high crystal structure complexity,2 band convergence,3 defect engineering,4 anharmonicity,5 and cagey semiconductors.6 To date, state-of-the-art TE materials are predominantly semimetals or semiconductors with high crystal symmetry, small electronegativity difference among constituent elements, and complex unit cell with the presence of heavy elements (e.g., Bi, Pb, etc.). In this regard, pristine SnSe is an outlier among these materials and has been the subject of much research because of a high ZT ≈ 2.6 that was reported in early studies by Zhao et al.,7 and a ZT ≈ 1 in subsequent studies.8
Unlike other high-performance TE materials such as Bi2Te3, CoSb3, PbTe, and SiGe that have hexagonal or cubic crystal structures, SnSe has a relatively lower symmetry orthorhombic structure which undergoes a second-order Pnma (#62)-to-Cmcm (#63) displacive phase transition at Tc ≈ 800 K.9 In addition, although SnSe has a low number of atoms per unit cell and contains no heavy elements such as Bi and Pb, it surprisingly exhibits an exceptionally low κL in its pristine form. It is this ultralow κL that underscores the reported record-high ZT.7 On the one hand, strong anharmonicity has been confirmed in SnSe, and recent inelastic neutron scattering measurements combined with first-principle simulations have provided further insights into the origin of the anharmonicity in SnSe, viz., a coupling of the lattice distortion below Tc to the instability of the electronic structure.10,11 On the other hand, it is an open question as to whether strong anharmonicity alone can account for the observed low κL in ref (7) because it has been argued in the literature that the SnSe samples therein were of low packing density (∼88% of the theoretical density).8 Moreover, contrary to our present understanding of phonon scattering mechanisms in solids, κL of polycrystalline SnSe12,13 was higher than that reported by Zhao et al.7 Furthermore, in their study of fully dense SnSe single crystals, Ibrahim et al.14 reported an electrical transport behavior that is distinct from the earlier findings of Zhao et al.7 and Wang et al.,15 which is possibly due to different growth conditions leading to different hole concentrations.16 In a recent study, Wang et al.17 also reported that the hole-doping mechanism in SnSe and resulting electron conduction behavior were sensitive to synthesis parameters that led to two unique defects, namely, the formation of SnSe2 and/or dislocations, albeit no strong evidence for these defects was provided in their study. Last, although SnSe is an intrinsic p-type semiconductor with a band gap ∼0.9–1.0 eV and a low carrier concentration ∼1017 cm–318−20 in the Pnma phase, the high ZT in pristine SnSe is achieved through its high carrier concentration in the Cmcm phase (∼1019 cm–3).7 The p-type nature of SnSe has been attributed to native Sn vacancies.21
Theoretical studies of pristine SnSe have shown the temperature evolution of the Pnma crystal phase that leads to significant changes in the electronic band structure.18,19 Thus, it is imperative to experimentally investigate the interplay between a small yet robust Fermi surface as inferred from a finite Sommerfeld coefficient and the temperature-dependent band gap by means of electrical and thermal measurements over a wide temperature range. Here, we report detailed temperature-dependent structural, electronic, and thermal properties along the three major crystallographic orientations of fully dense single-crystalline SnSe. A unique aspect of this study is that in our density functional theory (DFT) calculations, we used the experimentally determined temperature-dependent structural parameters to gain a deeper understanding of the fundamental mechanisms at play in SnSe and to describe their behavior over a wide range of temperatures (10–900 K). We conclude that fully dense pristine single-crystalline SnSe, with <0.35 at. % Sn(IV) as revealed by high precision 119Sn Mössbauer spectroscopy, exhibits a ZT ≈ 0.8–1 above ∼800 K.
2. Results and Discussion
2.1. Structural Properties
Two representative SnSe single crystals grown by the Bridgman method are shown in Figure 1A. The crystals could be cleaved easily along the a direction (because of the weak van der Waals bonds), yielding atomically flat surfaces that exhibit a metallic luster.22 The room-temperature density of SnSe crystals as determined from the Archimedes method (6.16 ± 0.01 g cm–3) and gas pycnometry (6.15 ± 0.06 g cm–3) on both as-grown ingot and cut pieces was consistent with the density estimated from our synchrotron X-ray diffraction (XRD) measurements (∼6.14 g cm–3) which is ∼100% of the theoretical density. Figure 1B shows the neutron rocking curve of a 19 g SnSe crystal at 2θ = 48.46°. The full width at half-maximum (fwhm) is estimated to be 0.48(1)°, revealing the excellent quality of monocrystalline SnSe from the Bridgman method. The XRD pattern of our SnSe crystal revealed four distinct (111) peaks and is shown in Figure 1C. From the XRD phi-scan, the in-plane orientation of SnSe single crystals can be explicitly identified, for example, the angles between two adjacent (111) peaks were found to be 86.13° and 93.87° (Figure 1C,D), in good agreement with previous neutron scattering results.9 It is well known that the Sn–Se atomic layers are corrugated (because of the zigzagged Sn–Se atomic chains along the c direction as shown in the inset figure of Figure 1E), and hence, the topography of the scanning tunneling spectrometer (STM) image of the (100) surface in Figure 1E collected at 5 K reveals only the top Sn layer of the crystal, which is defect-free. Figure 1F shows a representative differential-conductance, dI/dV spectrum for SnSe, which represents the density of state (DOS) as a function of energy. Clearly, the valence band maximum (VBM) is close to the Fermi level (EF = 0), leading to the p-type nature of SnSe, and the band gap is estimated to be ∼1.15 eV at ∼5 K.
Figure 1.
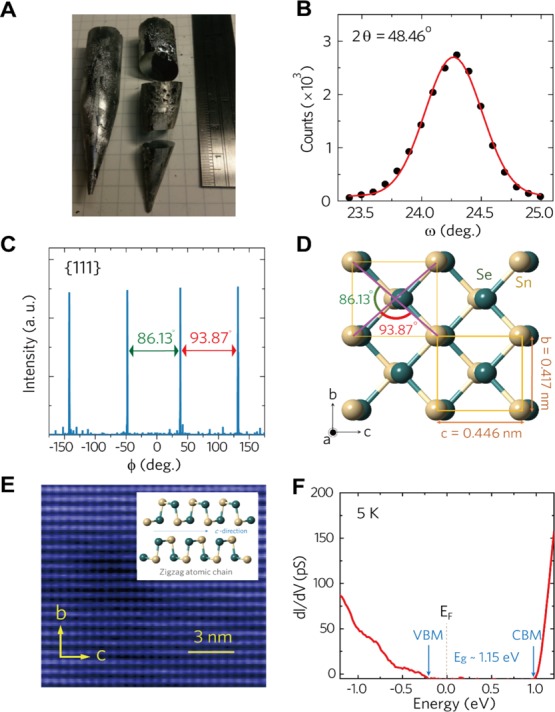
Structural characterization of fully dense single-crystalline SnSe. (A) Bridgman-grown SnSe crystals with the crystal direction along the (100) face. (B) Neutron rocking curve of single-crystalline SnSe (19 g) measured at room temperature. The fwhm is estimated to be 0.48(1)°, indicating the high crystallinity of our Bridgman-grown SnSe samples. (C) X-ray phi-scan profile of SnSe (111) reflection. (D) Crystal structure of Pnma-SnSe along the a direction. (E) STM topography of SnSe (100) surface obtained at a bias voltage of 1.6 V and 200 pA constant current at 5 K, inset: zigzag chains of Sn–Se atoms. (F) Tunneling spectrum dI/dV obtained at 4.8 K on (100) surface, where VBM and CBM are valence band maximum and the conduction band minimum, respectively. EF and Eg are the Fermi energy and the energy band gap, respectively.
2.2. Mössbauer Spectroscopy
A detailed 119Sn Mössbauer spectral study was performed on a single-crystalline SnSe sample (Figure 2) to confirm their stoichiometry and high crystalline quality. No measurable amount of oxidation or SnO2, which would appear as a signal at 0 mm/s, was observed. A very small minority component which is other than SnSe [∼0.35(5) at. % Sn(IV) in SnSe] is observed in the spectrum and was modeled with the spectral parameters of SnSe2 (an isomer shift of 1.3 mm/s, a quadrupole splitting of 0 mm/s, and a linewidth of 0.9 mm/s).23 The impurity phase could also be attributed to defective local coordination that yields an isomer shift similar to Sn(IV) in chalcogenide coordination. The main phase Mössbauer spectrum is an asymmetric doublet, which is also observed in powders24 but is more pronounced here because of the anisotropy of the single-crystalline layers. An initial fit (with a simple doublet) yields the spectral parameters for the majority phase corresponding to SnSe.23,25 The isomer shift is 3.34(1) mm/s, and the quadrupole splitting is 0.732(5) mm/s, with a linewidth of 0.73(2) mm/s. This sum of square residuals (SSR) for this fit is 296.0(0.1) for 256 data points and 7 fit parameters, (χred.2 = 1.19). The doublet asymmetry is given by a 36:64 ratio of intensity between the left and right lines, for SnSe. The difference plot with the initial fit, in magenta, top of Figure 2 indicates the presence of a small residual component around 0.9 mm/s. Hence, a broadened line corresponding to SnSe2 was included in the final fit. The difference plot with the final fit, in blue, top of Figure 2 indicates no further residual components, implying that the two-component fit suffices [SSR = 278.0(0.1), k = 8 parameters, N = 256 data points, χred.2 = 1.12]. Figure 2 shows the data and the two-component fit for SnSe. The difference plot at the top is magnified by a factor 10 and the ±1σ deviation is depicted by gray lines. The inset to the figure enlarges the velocity range where the secondary doublet is observed. The majority SnSe phase component is displayed in magenta, the minority doublet is displayed in blue and the total fit is displayed in black. Note that to quantify the minority phase, we have taken into account the temperature dependence of the Lamb–Mössbauer factor for Sn in SnSe and SnSe2 as calculated from the partial density of Sn phonon states obtained experimentally11 and theoretically,26 respectively.
Figure 2.
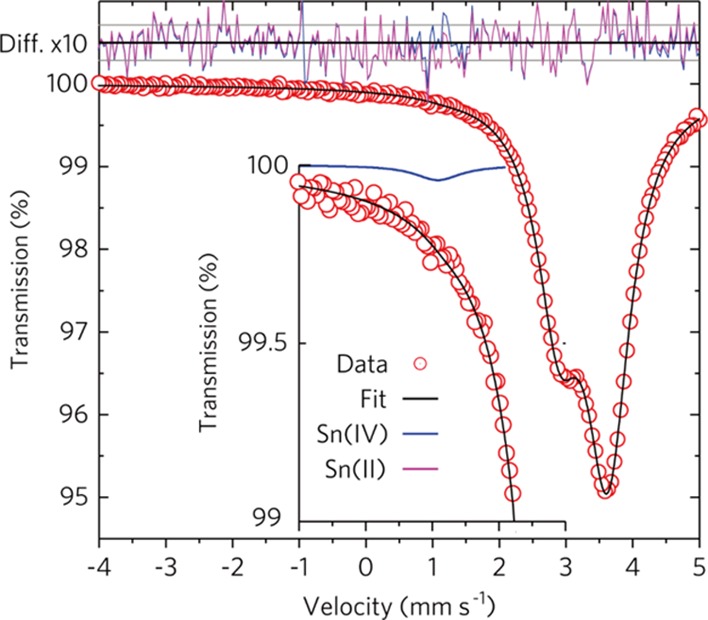
Room-temperature Mössbauer spectra of fully dense SnSe. Top: difference plot for fits with a single SnSe doublet fit (purple) and a fit with an additional Sn(IV) singlet (blue). The scale is magnified by a factor 10. The gray lines represent the ±1σ deviation calculated from the counting statistics. Center: Mössbauer spectral data, red dots, and total fit, black line, for the model with SnSe and a minor Sn(IV) component. Inset: vertically enlarged spectrum and fit components in the −1 to 2 mm/s range. The Sn(IV) minority component displayed in blue amounts to 0.35 at. %. The SnSe doublet is displayed in magenta. Data points for data are scaled to match the error bar.
2.3. Temperature-Dependent Synchrotron XRD and Heat Capacity
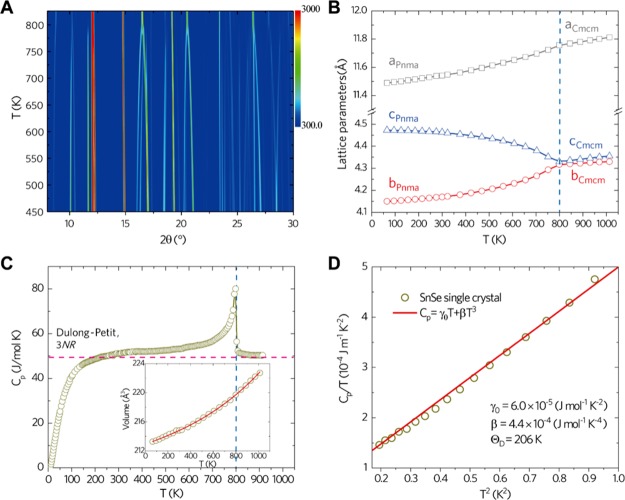
Figure 3A shows the temperature-dependent evolution of synchrotron XRD patterns of SnSe powder. It is evident that several peaks split into two near the phase transition temperature (800 K, from Cmcm to Pnma). The temperature-dependent lattice parameters obtained from XRD and neutron diffraction measurements are shown in Figure 3B. With increasing temperature, the two shorter lattice parameters (along b and c directions) in the Pnma phase approach each other and become nearly equal in the Cmcm phase, whereas the lattice parameter along the a direction increases monotonically. All the three lattice parameters evolve continuously across Tc to a higher symmetry Cmcm phase. Interestingly, the lattice parameter along the c direction decreases with the increasing temperature, indicative of a negative thermal expansion due to a strong coupling to the anharmonic phonon modes.11 To further elucidate this anharmonicity, the Cp of a fully dense SnSe crystal was measured from 0.45 to 875 K (Figure 3C). In addition to the continuity of unit cell volume at 800 K (inset in Figure 3C), the characteristic lambda-shaped Cp peak at Tc ≈ 800 K is a signature of a second-order phase transition,27 the shape of which was retained through several temperature cycles. In the temperature range from 300 K to Tc, the measured Cp is higher than the Dulong–Petit limit ∼49.9 J mol–1 K–1, signifying a strong anharmonicity at T < Tc, prior to the onset of the lambda transition near Tc. In contrast, the Cp attains the Dulong–Petit limit above Tc. As shown in the inset in Figure 3C, the volume expansion largely retains the same positive temperature coefficient above Tc, indicating the presence of anharmonicity above Tc that is largely offset by the phonon softening in the Cmcm phase.
Figure 3.
Temperature-dependent synchrotron XRD patterns and heat capacity data of SnSe. (A) Temperature-dependent XRD patterns showing the peak evolution with temperature. (B) Lattice parameters determined from Rietveld refinement and plotted as a function of temperature along a, b, and c directions. (C) Cp as a function of temperature below and above Tc (vertical blue dashed line). Inset: unit cell volume plotted as a function of temperature. (D) Estimated Debye temperature (ΘD) from the plot of Cp/T vs T2.
From a linear plot of Cp/T versus T2 in the low temperature regime (0.45–1 K), a Debye temperature ΘD ≈ 206 K was estimated using the relation Cp(T) = γ0T + β T3 where a Sommerfeld coefficient γ0 ≈ (6.0 ± 0.7) × 10–5 J mol–1 K–2 and the lattice contribution to heat capacity β ≈ 4.4 × 10⁻⁴ J mol–1 K–4 were obtained (Figure 3D). The γ0 value of SnSe is comparable to that of Bi (∼4–8 × 10⁻⁵ J mol–1 K–2),28 and an order of magnitude lower than that of copper (γCu = 6.95 × 10⁻⁴ J mol–1 K–2), implying a low DOS (EF) and a small Fermi surface. This small but robust Fermi surface in SnSe could arise from the presence of native defects, mainly Sn vacancies in this case, which are easy to form.29
2.4. Temperature-Dependent Band Structure and Electronic Transport
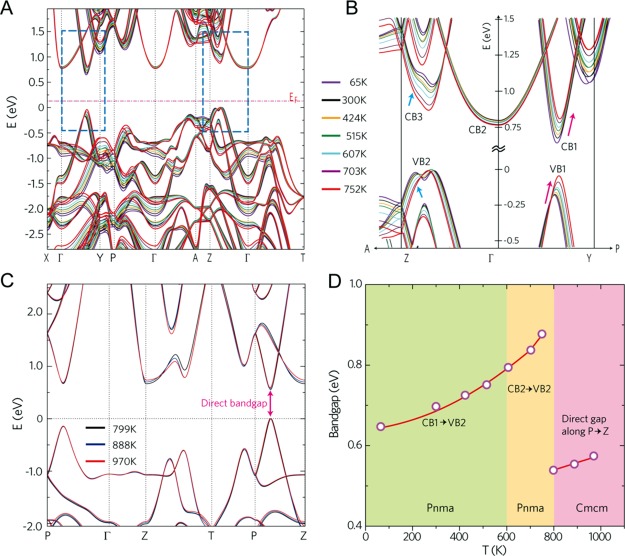
Figure 4A,C shows the SnSe band structure (DFT + GW0) that was calculated using our experimental lattice parameters (Figure 3B) at selected temperatures in the Pnma phase (T = 65, 300, 424, 515, 607, 703, and 752 K) and the Cmcm phase (T = 799, 888, and 970 K), respectively. In the Pnma phase, the highest VB peak appears in the Γ–Z direction (VB2), parallel to the c direction (shown on an expanded scale in Figure 4B). As the temperature decreases from 752 K, this peak splits into two (“pudding mold bands” which lead to a large Seebeck coefficient)30 with the left peak moving toward the EF with decreasing temperature. Incidentally, the unique pudding mold-shaped VB was reported through high-resolution ARPES measurements that revealed two ellipsoid hole pockets along the Γ–Z direction close to EF, in good agreement with the metallic transport of these samples.17 The second VB peak (VB1) (shown on an expanded scale in Figure 4B), which is parabolic and along the Γ–Y direction, moves toward EF with increasing temperature. It is worth noting that these two VB peaks shift in an opposite manner with temperature relative to EF, which influence the carrier concentration of SnSe. In contrast to VB, the conduction band minimum (CBM) in the Γ–Y direction (CB1) moves away from the EF with increasing temperature and becomes closer in energy to the broad CBM at Γ point (CB2), which causes a band convergence above 600 K that enhances the S and/or PF of SnSe.3 It is expected that these temperature-induced shifts of CBM and VBM will influence the electrical transport properties of SnSe. On the other hand, a direct energy band gap along the P–Z direction is found for SnSe in the Cmcm phase (Figure 4C). Generally, the energy band gap of a semiconductor decreases with increasing temperature according to the semiempirical Varshni relation,31 we find that the calculated band gap of SnSe is valley-dependent in both the Pnma and Cmcm phases and increases monotonically with increasing temperature (Figure 4D).
Figure 4.
Band structure of SnSe using DFT. (A) Below and (C) above the phase transition, (B) expanded view of the VBM and CBM indicated in the dotted squares in (A). (D) Estimated energy band gap above and below the phase transition temperature.
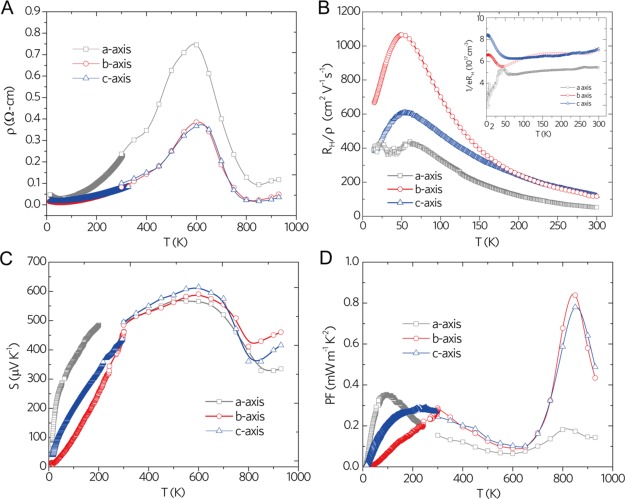
The temperature-dependent electrical resistivity (ρ = 1/σ) of SnSe single crystals along the three major crystallographic directions are shown in Figure 5A. The ρ values are similar in magnitude along the in-plane b and c directions but higher along the perpendicular a direction. Moreover, ρ exhibits an upturn with decreasing temperature below 50 K, which is most pronounced along the a direction that has also been observed by Wang et al.17 and attributed to weak localization. In the 50–600 K temperature range, ρ increases with increasing temperature which can be attributed to the contraction of the VB2 (Figure 4B) that reduces the Fermi surface. The contraction of VB2 also counterbalances the thermal excitation effect that makes the effective carrier concentration become almost temperature-independent for T > 50 K (inset in Figure 5B). Above 600 K, ρ decreases by more than an order of magnitude because of the quick upshift of the VB1 with increasing temperature that greatly enlarges the Fermi surface. In other words, ρ of Pnma phase is governed by the temperature-dependent shift and curvature variations of both VB1 and VB2 (Figure 4B).
Figure 5.
Electronic transport of SnSe. (A) Electrical resistivity (ρ) of SnSe as a function of temperature. (B) Carrier mobility (μ = RH/ρ), and 1/eRH shown in the inset figure as a function of temperature. (C) Seebeck coefficient (S) and (D) TE power factor (PF = S2/ρ) of SnSe as a function of temperature.
To gain more insights into the underlying mechanisms, we also measured the Hall coefficient RH along all three crystallographic directions in the 2–300 K range (inset of Figure 5B). In an agreement with previous study7 and our temperature-dependent band structure calculations (Figure 4), the Arrhenius thermal excitation behavior (which refers to thermal activation of carriers over a band gap) was not observed in the 2–300 K range. Moreover, the measured Hall coefficients exhibited anisotropy, which is consistent with the anisotropic and multiband nature of the band structure. Between 70 and 300 K, a weak temperature dependence was observed in 1/eRH along all three directions with a value of 1/eRH ≈ 6–7 × 1017 cm–3 along the b and c directions, and a 1/eRH ≈ 5–6 × 1017 cm–3 along the a direction. The temperature-dependent 1/eRH below 50 K exhibits two dissimilar trends with decreasing temperature along the three crystallographic directions. The decrease in 1/eRH value with decreasing temperature along the a direction is the reason for the slight resistivity upturn along the a direction discussed in Figure 5A. Such complex and anisotropic temperature-dependent behavior along the a direction can be attributed to the weak localization effect.17
The Hall mobility μ (=RH/ρ) as a function of temperature between 2 and 300 K is shown in Figure 5B. In general, μ exhibits a peak at 50 K and similar temperature dependence along all three crystallographic directions above 50 K, which is indicative of a dominant electron–phonon coupling. The μ values at 50 K (300 K) are 396 (52), 1065 (116), and 602 (118) cm2 V–1 s–1 along the a, b, and c directions, respectively. Moreover, strong anisotropy is observed in μ below 50 K, which crossed over to a noisy plateau at ∼400 cm2 V–1 s–1 along a direction and decreased steeply with a decreasing temperature along the b and c directions. As shown in Figure 5C, the Seebeck coefficient S of SnSe is positive throughout the entire temperature range, indicative of dominant hole conduction. Along the three crystallographic directions, the S increases with increasing temperature from ∼15 K until the maximum value of ∼540–600 μV K–1 is reached in the vicinity of 600 K. There is no discernible anomaly near 50 K, in contrast to the observed temperature dependence of ρ (cf. Figure 5A) and μ (cf. Figure 5B). We employed the Goldsmid–Sharp relation to estimate the energy band gap Eg = 2eSmaxTSmax,32 where Smax is the peak value of S and TSmax is the corresponding temperature. The estimated Eg values are found to be in the range 0.62–0.72 eV, consistent with the calculated band gap at 600 K (cf. Figure 4D). The temperature dependence of S is anisotropic, reflecting the anisotropy of the Fermi surface topology of SnSe (Figure 4A–C). Apparently, this anisotropy becomes stronger with decreasing temperature, which is consistent with the observed variations in 1/eRH (cf. the inset of Figure 5B). Furthermore, S is observed to increase gradually with increasing temperature in the Cmcm phase, contrary to the expectation that S should decrease above the phase transition temperature.19 There are several factors that could affect the thermopower and resistivity simultaneously in a multivalley material system such as SnSe, including effective mass of band valleys, inter-/intra-valley scattering and band gap that needs further investigation.
The temperature-dependent PF (=S2/ρ) of our single-crystalline SnSe along the three major crystallographic directions from ∼15–900 K is shown in Figure 5D. At ∼600 K, the PF shows a local minimum because of the high ρ. At T ≈ 850 K, the higher symmetry Cmcm phase exhibited a maximum PF ≈ 0.8 mW m–1 K–2 along the b and c directions, while a much lower PF ≈ 0.2 mW m–1 K–2 was obtained along the a direction. These PF values are comparable to the values (∼0.8–1.0 mW m–1 K–2) reported in ref (7) along the b and c directions, but not in agreement with the PF values reported in ref (14).
2.5. Thermal Transport and ZT of Fully Dense SnSe
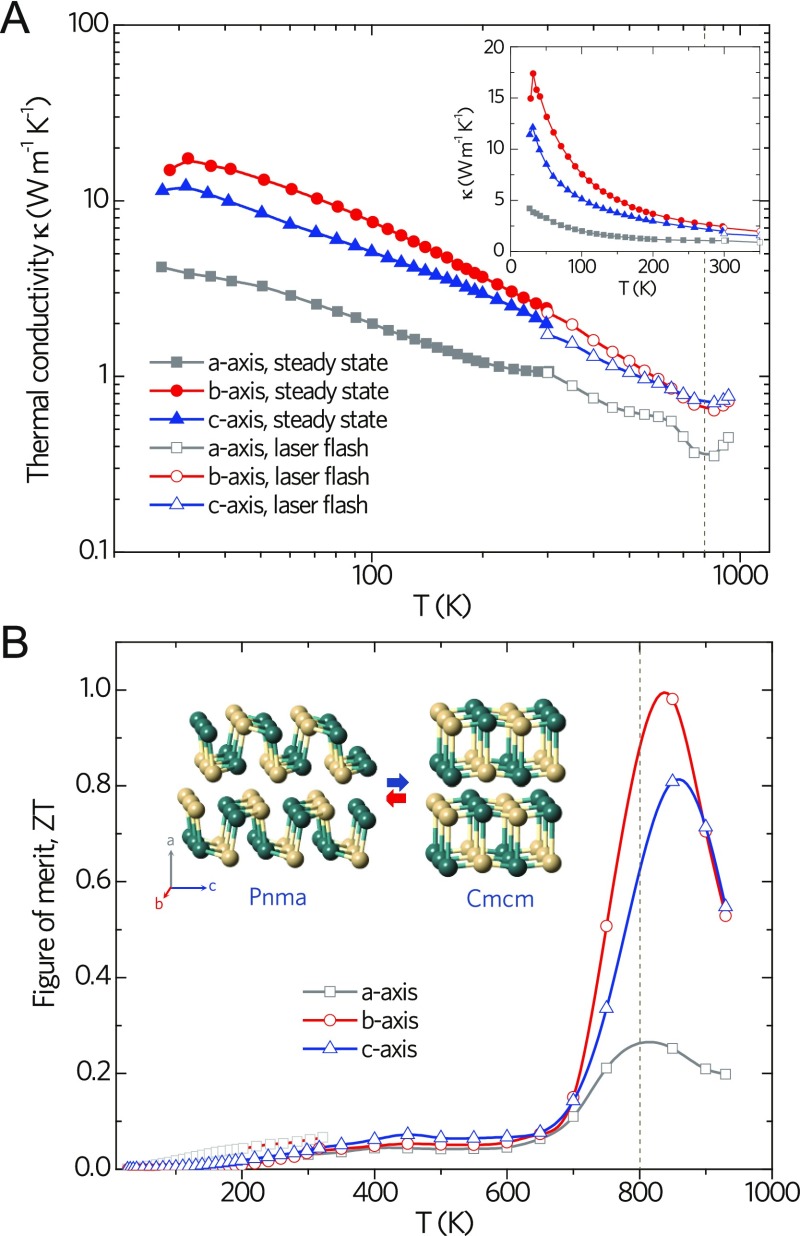
The total thermal conductivity κ of our single-crystalline SnSe in the temperature range from 25–930 K is shown in Figure 6A. The solid (open) symbols are values obtained using steady-state (transient laser flash) technique for rod (disc) shaped pieces cut along specific crystallographic directions. Owing to the predominantly high ρ ≈ 0.1–0.8 Ω cm in the 25–930 K temperature range (Figure 5A), it is evident that κ ≈ κL. As shown in the inset of Figure 6A, well-defined Umklapp peaks are observed at ∼30 K (i.e., ∼1/7 of ΘD) along the b and c directions but are absent along the a direction. The κL of the Pnma phase is inversely proportional to temperature above 30 K, indicating that the Umklapp process is dominant with increasing temperature. The absence of the Umklapp peak along the a direction is presumably due to the downshift of this peak to a lower temperature as the Brillouin zone is substantially shorter along the a (a*) direction. It is well known that the presence of defects will lower the Umklapp peak intensity and concomitantly broaden it. Ibrahim et al.14 and Wang et al.15 have reported a stronger Umklapp peak in their studies, implying that the Umklapp peak in this study may arise because of the presence of <0.35 at. % Sn(IV). Of particular note are the room-temperature values of κ along the b and c directions (2.16 and 1.62 W m–1 K–1, respectively), which are comparable to the corresponding values reported by Wasscher et al.33 (κ ≈ 1.9 W m–1 K–1 in the bc-plane) and Ibrahim et al.14 as well as the theoretical results by Carrete et al.34 Compared with the Pnma phase of SnSe, the κ of the Cmcm phase is ∼0.7–0.9 W m–1 K–1 along b and c directions and ∼0.3–0.4 W m–1 K–1 along a direction. The figure-of-merit, ZT of our single-crystalline SnSe in the temperature range 25–900 K is shown in Figure 6B. It is noteworthy that the ZT peaks are present at 850 K in the Cmcm phase, which is ∼50 K above Tc. Because of the uncertainty of determining Cp value at Tc, and subsequently κ, the plot in Figure 6B does not include ZT data points around Tc. Despite obtaining similar PF values to that reported in ref (7), we obtained peak ZT values of ∼1.0, ∼0.8, and ∼0.25 along the b, c, and a directions at 850 K, respectively. Clearly, the ZT values are a factor of two lower than that of ∼2.6 reported in ref (7), a discrepancy that has been discussed in our previous publication.8
Figure 6.
Thermal transport and figure-of-merit of SnSe. (A) Total thermal conductivity (κ) plotted on logarithmic and linear (inset figure) scales. The kink at 300 K along the a direction is a remnant of the radiation losses. (B) TE figure-of-merit of SnSe as a function of temperature. The solid and open symbols in the upper panel correspond to measurements using the steady-state and laser flash techniques, respectively.
3. Conclusion
Our detailed temperature-dependent structural, electrical, and thermal transport on high-quality single-crystalline SnSe indicate a low-carrier-concentration multiband feature below 600 K, above which a semiconducting behavior is exhibited. The small but robust Fermi surface in SnSe could arise from the presence of Sn vacancies, which are the dominant intrinsic defects in SnSe. Nonetheless, extensive Mössbauer spectroscopy verify the high quality of our SnSe crystals and found that the defect concentration is <0.35 at. % Sn(IV).
4. Experimental Section
4.1. Synthesis and Characterization
High-purity Sn chunks (99.999%) and Se shots (99.999%) were weighed in the stoichiometric ratio of SnSe, sealed in evacuated silica tubes, and heated at 1223 K for 48 h followed by furnace-cooling to room temperature. The obtained ingots were crushed and sealed in double silica tubes as it is well known that the volume expansion of the SnSe lattice (along b axis) near the phase transition temperature could break the inner silica tube, causing SnSe to oxidize. The SnSe single crystals were grown using the vertical Bridgman method with a growth rate of 1.5 mm h–1 at 1223 K. Finally, high-quality SnSe single crystals (Figure 1A, weight ∼50 g, diam ≈ 13 mm) were obtained with a packing density which is >99% of the theoretical density, as discussed in the next section. The absence of the SnO2 phase in our SnSe single crystals was confirmed by Raman and Mössbauer spectroscopy. Furthermore, the pole figure and orientation were determined by a PANalytical X’Pert PRO MRD high-resolution X-ray diffractometer. A Rigaku TTRAX 3 X-ray diffractometer (λ = 1.54056 Å, from 65–300 K) and the synchrotron X-ray beamline BL01C2 (λ = 0.619925 Å, from 300–1014 K, at the National Synchrotron Radiation Research Center, Taiwan) were employed in conjunction with the General Structure Analysis System (GSAS) program to characterize our SnSe single crystals.35 The neutron rocking curve measurements were conducted on BT-7 triple-axis spectrometers at the NIST Center for Neutron Research using pyrolytic graphite PG(002) monochromator crystals to select an incident wavelength of λ = 2.359 A°, with a PG filter to suppress higher-order wavelength contaminations. Single-detector measurements were made with a PG(002) energy analyzer.
The electrical resistivity ρ and Seebeck coefficient S were measured using the ULVAC ZEM-3 system in the temperature range of 300–900 K. The low temperature (10–300 K) resistivity and Seebeck coefficient were measured simultaneously using a custom-designed measurement system.36 The Hall coefficient RH and the isobaric heat capacity Cp were measured using a commercial Quantum Design Physical Properties Measurement System in the temperature range of 2–300 K while a 3He cryostat was used to measure Cp between 0.45 and 2 K. The Hall mobility μ was calculated using the relation, μ = RH/ρ in the context of the Drude model. The total thermal conductivity κ in the temperature range of 15–300 K was measured using a custom-designed steady-state technique.37 The thermal conductivity at low temperatures was corrected for radiation losses above 200 K, using the Stefan–Boltzmann power law.37 Above room temperature, the total thermal conductivity was estimated as κ = DTCvd, where the thermal diffusivity DT was measured by the laser flash method using Netzsch LFA457, Cp was measured using Netzsch Pegasus 404 high-temperature differential scanning calorimetry system, and the packing density d of the crystal was measured at room temperature by the Archimedes method and gas pycnometry (Micromeritics AccuPyc 1330). For a strongly anharmonic material such as SnSe, Cp > Cv at elevated temperatures but the discrepancy between Cp and Cv is offset to the first order by a decrease in the packing density because of thermal expansion. Hence, Cp ≈ Cv except at Tc. As described above, the low- and high-temperature thermal conductivity values are measured using different principles, sample geometries, and measurement environments. These techniques offer an opportunity to probe the presence of cracks in the SnSe single crystals. During the laser flash measurement, the cracks may leak the laser signal and yield an artificially high thermal diffusivity value, however, if the same cracks were present under a dynamic vacuum, no heat could conduct through the cracks during the low temperature steady-state measurements. Thus one would expect to see a mismatch between the results of low- and high-temperature measurements in the presence of cracks. As shown in Figure 6A, the low- and high-temperature measurements match exceedingly well; thus, the presence of cracks can be excluded in our SnSe single crystals. The surface topography of in situ cleaved single-crystalline SnSe was collected using an etched tungsten wire in a custom-designed 3He STM.38
Room-temperature 119Sn Mössbauer spectra were obtained in transmission geometry using a MS-96 constant acceleration drive (Palacky University, Olomouc) with a 10 mCi Ca119mSnO3 source. The spectrometer was calibrated using α-iron foil with a 1 mCi 57Co source in rhodium matrix. The SnSe sample was prepared by mechanically exfoliating the crystals on aluminized Mylar tape, wherein two layers were used for the SnSe samples. The radiation was parallel to the crystallographic a axis. The isomer shift is reported relative to SnO2 at ambient temperature. The total collected statistics for the sample was 24 × 106 counts per channel, after binning to a total of 256 channels, collected for 5 days, for SnSe. The signal-to-noise ratio was about the same for both samples as the latter samples had twice the thickness and absorption. An appropriate statistics estimator for a fit of one data set by two models with different number of parameters is given by the Akaike Information Criterion,39,40 which yields relative likelihood for the 1 component model of exp((AIC1 – AIC2)/2) < 0.001, where AIC = 2 × k + N ln(SSR/N).
Acknowledgments
The authors wish to acknowledge Prof. Terry Tritt (Clemson University) for providing access to low temperature measurement facilities in his laboratory, and Prof. Julian Goldsmid, Dr. Pooja Puneet, and Prakash Parajuli for valuable discussions. We also thank National Institute of Standards and Technology and Dr. Jeffrey W. Lynn for providing the neutron beam time that made the neutron rocking curve measurements possible. R.P.H. thanks Dipanshu Bansal and Jiawang Hong for numerical phonon data in refs (11) and (26).
Supporting Information Available
The Supporting Information is available free of charge on the ACS Publications website at DOI: 10.1021/acsomega.8b03323.
Authors Y.-F.L. and J.H. acknowledge the financial support of NSF DMR 1307740. Mössbauer spectroscopy by R.P.H. was supported by the U.S. Department of Energy, Office of Science, Basic Energy Sciences, Materials Sciences and Engineering Division. Y.-Y.C. would like to acknowledge the financial support of Academia Sinica no. AS-SS-106-01-1.
The authors declare no competing financial interest.
Supplementary Material
References
- Hicks L. D.; Dresselhaus M. S. Effect of Quantum-Well Structures on the Thermoelectric Figure of Merit. Phys. Rev. B: Condens. Matter Mater. Phys. 1993, 47, 12727–12731. 10.1103/physrevb.47.12727. [DOI] [PubMed] [Google Scholar]
- Snyder G. J.; Toberer E. S. Complex Thermoelectric Materials. Nat. Mater. 2008, 7, 105–114. 10.1038/nmat2090. [DOI] [PubMed] [Google Scholar]
- Pei Y.; Shi X.; Lalonde A.; Wang H.; Chen L.; Snyder G. J. Convergence of Electronic Bands for High Performance Bulk Thermoelectrics. Nature 2011, 473, 66–69. 10.1038/nature09996. [DOI] [PubMed] [Google Scholar]
- Liu Y.; Zhou M.; He J. Towards Higher Thermoelectric Performance of Bi2Te3 via Defect Engineering. Scr. Mater. 2016, 111, 39–43. 10.1016/j.scriptamat.2015.06.031. [DOI] [Google Scholar]
- Morelli D. T.; Jovovic V.; Heremans J. P. Intrinsically Minimal Thermal Conductivity in Cubic I-V-VI2 Semiconductors. Phys. Rev. Lett. 2008, 101, 035901. 10.1103/physrevlett.101.035901. [DOI] [PubMed] [Google Scholar]
- Cohn J. L.; Nolas G. S.; Fessatidis V.; Metcalf T. H.; Slack G. A. Glasslike Heat Conduction in High-Mobility Crystalline Semiconductors. Phys. Rev. Lett. 1999, 82, 779–782. 10.1103/physrevlett.82.779. [DOI] [Google Scholar]
- Zhao L.-D.; Lo S.-H.; Zhang Y.; Sun H.; Tan G.; Uher C.; Wolverton C.; Dravid V. P.; Kanatzidis M. G. Ultralow Thermal Conductivity and High Thermoelectric Figure of Merit in SnSe Crystals. Nature 2014, 508, 373–377. 10.1038/nature13184. [DOI] [PubMed] [Google Scholar]
- Wei P.-C.; Bhattacharya S.; He J.; Neeleshwar S.; Podila R.; Chen Y. Y.; Rao A. M. The Intrinsic Thermal Conductivity of SnSe. Nature 2016, 539, E1–E2. 10.1038/nature19832. [DOI] [PubMed] [Google Scholar]
- Chattopadhyay T.; Pannetier J.; Von Schnering H. G. Neutron Diffraction Study of the Structural Phase Transition in SnS and SnSe. J. Phys. Chem. Solids 1986, 47, 879–885. 10.1016/0022-3697(86)90059-4. [DOI] [Google Scholar]
- Li C. W.; Hong J.; May A. F.; Bansal D.; Chi S.; Hong T.; Ehlers G.; Delaire O. Orbitally Driven Giant Phonon Anharmonicity in SnSe. Nat. Phys. 2015, 11, 1063–1069. 10.1038/nphys3492. [DOI] [Google Scholar]
- Bansal D.; Hong J.; Li C. W.; May A. F.; Porter W.; Hu M. Y.; Abernathy D. L.; Delaire O. Phonon Anharmonicity and Negative Thermal Expansion in SnSe. Phys. Rev. B: Condens. Matter Mater. Phys. 2016, 94, 054307. 10.1103/physrevb.94.054307. [DOI] [Google Scholar]
- Sassi S.; Candolfi C.; Vaney J.-B.; Ohorodniichuk V.; Masschelein P.; Dauscher A.; Lenoir B. Assessment of the Thermoelectric Performance of Polycrystalline p-Type SnSe. Appl. Phys. Lett. 2014, 104, 212105. 10.1063/1.4880817. [DOI] [Google Scholar]
- Chen C.-L.; Wang H.; Chen Y.-Y.; Day T.; Snyder G. J. Thermoelectric Properties of p-Type Polycrystalline SnSe Doped with Ag. J. Mater. Chem. A 2014, 2, 11171–11176. 10.1039/c4ta01643b. [DOI] [Google Scholar]
- Ibrahim D.; Vaney J.-B.; Sassi S.; Candolfi C.; Ohorodniichuk V.; Levinsky P.; Semprimoschnig C.; Dauscher A.; Lenoir B. Reinvestigation of the Thermal Properties of Single-Crystalline SnSe. Appl. Phys. Lett. 2017, 110, 032103. 10.1063/1.4974348. [DOI] [Google Scholar]
- Wang S.; Hui S.; Peng K.; Bailey T. P.; Liu W.; Yonggao Y.; Xiaoyuan Z.; Tang X.; Uher C. Low Temperature Thermoelectric Properties of p-Type Doped Single-Crystalline SnSe. Appl. Phys. Lett. 2018, 112, 142102. 10.1063/1.5023125. [DOI] [Google Scholar]
- Nguyen V. Q.; Kim J.; Cho S. A Review of SnSe: Growth and Thermoelectric Properties. J. Korean Phys. Soc. 2018, 72, 841–857. 10.3938/jkps.72.841. [DOI] [Google Scholar]
- Wang Z.; Fan C.; Shen Z.; Hua C.; Hu Q.; Sheng F.; Lu Y.; Fang H.; Qiu Z.; Lu J.; et al. Defects Controlled Hole Doping and Multivalley Transport in SnSe Single Crystals. Nat. Commun. 2018, 9, 1–9. 10.1038/s41467-017-02566-1. [DOI] [PMC free article] [PubMed] [Google Scholar]
- Shi G.; Kioupakis E. Quasiparticle Band Structures and Thermoelectric Transport Properties of p-Type SnSe. J. Appl. Phys. 2015, 117, 065103. 10.1063/1.4907805. [DOI] [Google Scholar]
- Kutorasinski K.; Wiendlocha B.; Kaprzyk S.; Tobola J. Electronic Structure and Thermoelectric Properties of n- and p-Type SnSe from First Principles Calculations. Phys. Rev. B: Condens. Matter Mater. Phys. 2015, 91, 205201. 10.1103/physrevb.91.205201. [DOI] [Google Scholar]
- Guo R.; Wang X.; Kuang Y.; Huang B. First-Principles Study of Anisotropic Thermoelectric Transport Properties of IV-VI Semiconductor Compounds SnSe and SnS. Phys. Rev. B: Condens. Matter Mater. Phys. 2015, 92, 115202. 10.1103/physrevb.92.115202. [DOI] [Google Scholar]
- Duvjir G.; Min T.; Thi Ly T.; Kim T.; Duong A.-T.; Cho S.; Rhim S. H.; Lee J.; Kim J. Origin of p-Type Characteristics in a SnSe Single Crystal. Appl. Phys. Lett. 2017, 110, 262106. 10.1063/1.4991003. [DOI] [Google Scholar]
- Taniguchi M.; Johnson R. L.; Ghijsen J.; Cardona M. Core Excitons and Conduction-Band Structures in Orthorhombic GeS, GeSe, SnS, and SnSe Single Crystals. Phys. Rev. B: Condens. Matter Mater. Phys. 1990, 42, 3634–3643. 10.1103/physrevb.42.3634. [DOI] [PubMed] [Google Scholar]
- Baggio E. M.; Sonnino T. Isomer Shift and Electronegativity in Compounds of Tin and Group-VI Elements. J. Chem. Phys. 1970, 52, 3786. 10.1063/1.1673558. [DOI] [Google Scholar]
- Karyagin S. V. The Possible Reason for the Asymmetry of Doublet Components of Mossbauer’s Absorption Spectrum in Certain Powdery Tin Compounds. Dokl. Akad. Nauk SSSR 1963, 148, 1102–1105. [Google Scholar]
- Lippens P. E. Interpretation of the 119Sn Mössbauer isomer shifts in complex tin chalcogenides. Phys. Rev. B: Condens. Matter Mater. Phys. 1999, 60, 4576–4586. 10.1103/physrevb.60.4576. [DOI] [Google Scholar]
- Ding Y.; Xiao B.; Tang G.; Hong J. Transport Properties and High Thermopower of SnSe2: A Full Ab-Initio Investigation. J. Phys. Chem. C 2017, 121, 225–236. 10.1021/acs.jpcc.6b11467. [DOI] [Google Scholar]
- Buckingham M. J.; Fairbank W. M. Chapter III The Nature of the λ-Transition in Liquid Helium. Prog. Low Temp. Phys. 1961, 3, 80–112. 10.1016/s0079-6417(08)60134-1. [DOI] [Google Scholar]
- Phillips N. E. Low-Temperature Heat Capacity of Metals. CRC Crit. Rev. Solid State Sci. 1971, 2, 467–553. 10.1080/10408437108243546. [DOI] [Google Scholar]
- Dewandre A.; Hellman O.; Bhattacharya S.; Romero A. H.; Madsen G. K. H.; Verstraete M. J. Two-Step Phase Transition in SnSe and the Origins of Its High Power Factor from First Principles. Phys. Rev. Lett. 2016, 117, 276601. 10.1103/physrevlett.117.276601. [DOI] [PubMed] [Google Scholar]
- Kuroki K.; Arita R. “Pudding Mold” Band Drives Large Thermopower in Na XCoO2. J. Phys. Soc. Jpn. 2007, 76, 083707. 10.1143/jpsj.76.083707. [DOI] [Google Scholar]
- Varshni Y. P. Temperature Dependence of the Energy Gap in Semiconductors. Physica 1967, 34, 149–154. 10.1016/0031-8914(67)90062-6. [DOI] [Google Scholar]
- Goldsmid H. J.; Sharp J. W. Estimation of the Thermal Band Gap of a Semiconductor from Seebeck Measurements. J. Electron. Mater. 1999, 28, 869–872. 10.1007/s11664-999-0211-y. [DOI] [Google Scholar]
- Wasscher J. D.; Albers W.; Haas C. Simple Evaluation of the Maximum Thermoelectric Figure of Merit, with Application to Mixed Crystals SnS(1-x)Sex. Solid-State Electron. 1963, 6, 261–264. 10.1016/0038-1101(63)90083-2. [DOI] [Google Scholar]
- Carrete J.; Mingo N.; Curtarolo S. Low Thermal Conductivity and Triaxial Phononic Anisotropy of SnSe. Appl. Phys. Lett. 2014, 105, 101907. 10.1063/1.4895770. [DOI] [Google Scholar]
- Von Dreele R.; Larson A.. General Structure Analysis System (GSAS), Los Alamos National Laboratory Report LAUR, 2004; Vol. 748, pp 86–748.
- Pope A. L.; Littleton R. T.; Tritt T. M. Apparatus for the rapid measurement of electrical transport properties for both “needle-like” and bulk materials. Rev. Sci. Instrum. 2001, 72, 3129. 10.1063/1.1380390. [DOI] [Google Scholar]
- Pope A. L.; Zawilski B.; Tritt T. M. Description of Removable Sample Mount Apparatus for Rapid Thermal Conductivity Measurements. Cryogenics 2001, 41, 725–731. 10.1016/s0011-2275(01)00140-0. [DOI] [Google Scholar]
- Guan S.-Y.; Chen P.-J.; Chu M.-W.; Sankar R.; Chou F.; Jeng H.-T.; Chang C.-S.; Chuang T.-M. Superconducting Topological Surface States in the Noncentrosymmetric Bulk Superconductor PbTaSe2. Sci. Adv. 2016, 2, e1600894. 10.1126/sciadv.1600894. [DOI] [PMC free article] [PubMed] [Google Scholar]
- Akaike H. A new look at the statistical model identification. IEEE Trans. Autom. Control 1974, 19, 716–723. 10.1109/tac.1974.1100705. [DOI] [Google Scholar]
- Burnham K. P.; Anderson D. R. Multimodel Inference. Sociol. Methods and Res. 2004, 33, 261–304. 10.1177/0049124104268644. [DOI] [Google Scholar]
- Hohenberg P.; Kohn W. Inhomogeneous Electron Gas. Phys. Rev. 1964, 136, B864–B871. 10.1103/physrev.136.b864. [DOI] [Google Scholar]
- Kresse G.; Hafner J. Ab initiomolecular-dynamics simulation of the liquid-metal-amorphous-semiconductor transition in germanium. Phys. Rev. B: Condens. Matter Mater. Phys. 1994, 49, 14251–14269. 10.1103/physrevb.49.14251. [DOI] [PubMed] [Google Scholar]
- Kresse G.; Furthmüller J. Efficiency of Ab-Initio Total Energy Calculations for Metals and Semiconductors Using a Plane-Wave Basis Set. Comput. Mater. Sci. 1996, 6, 15–50. 10.1016/0927-0256(96)00008-0. [DOI] [PubMed] [Google Scholar]
- Blöchl P. E. Projector Augmented-Wave Method. Phys. Rev. B: Condens. Matter Mater. Phys. 1994, 50, 17953–17979. 10.1103/physrevb.50.17953. [DOI] [PubMed] [Google Scholar]
- Kresse G.; Joubert D. From ultrasoft pseudopotentials to the projector augmented-wave method. Phys. Rev. B: Condens. Matter Mater. Phys. 1999, 59, 1758. 10.1103/physrevb.59.1758. [DOI] [Google Scholar]
- Perdew J. P.; Burke K.; Ernzerhof M. Generalized Gradient Approximation Made Simple. Phys. Rev. Lett. 1996, 77, 3865–3868. 10.1103/physrevlett.77.3865. [DOI] [PubMed] [Google Scholar]
- Shishkin M.; Kresse G. Self-Consistent GW Calculations for Semiconductors and Insulators. Phys. Rev. B: Condens. Matter Mater. Phys. 2007, 75, 235102. 10.1103/physrevb.75.235102. [DOI] [Google Scholar]
- Godby R. W.; Schlüter M.; Sham L. J. Self-Energy Operators and Exchange-Correlation Potentials in Semiconductors. Phys. Rev. B: Condens. Matter Mater. Phys. 1988, 37, 10159–10175. 10.1103/physrevb.37.10159. [DOI] [PubMed] [Google Scholar]
- Shishkin M.; Kresse G. Implementation and Performance of the Frequency-Dependent GW Method within the PAW Framework. Phys. Rev. B: Condens. Matter Mater. Phys. 2006, 74, 35101. 10.1103/physrevb.74.035101. [DOI] [Google Scholar]
Associated Data
This section collects any data citations, data availability statements, or supplementary materials included in this article.


