Abstract
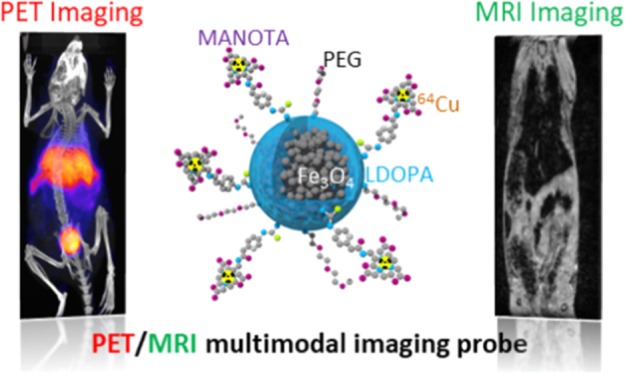
Superparamagnetic iron oxide nanoparticles were developed as positron emission tomography (PET) and magnetic resonance imaging (MRI) bimodal imaging agents. These nanoparticles (NPs), with a specific nanoflower morphology, were first synthesized and simultaneously functionalized with 3,4-dihydroxy-l-phenylalanine (LDOPA) under continuous hydrothermal conditions. The resulting NPs exhibited a low hydrodynamic size of 90 ± 2 nm. The functional groups of LDOPA (−NH2 and −COOH) were successfully used for the grafting of molecules of interest in a second step. The nanostructures were modified by poly(ethylene glycol) (PEG) and a new macrocyclic chelator MANOTA for further 64Cu radiolabeling for PET imaging. The functionalized NPs showed promising bimodal (PET and MRI) imaging capability with high r2 and r2* (T2 and T2* relaxivities) values and good stability. They were mainly uptaken from liver and kidneys. No cytotoxicity effect was observed. These NPs appear as a good candidate for bimodal tracers in PET/MRI.
1. Introduction
Magnetic iron oxide NPs have received huge attention in biomedical applications such as magnetic resonance imaging (MRI),1,2 hyperthermia,3 and drug delivery.4 In particular, superparamagnetic iron oxide nanoparticles (SPIONs) are widely used as in vivo transverse relaxation (T2 and T2*) contrast agents in molecular and cell imaging to differentiate diseased from healthy tissues.5
However, since each imaging modality possesses its own strengths and weaknesses, one single imaging technique is often not enough to evaluate the biological structure properties and information concerning a pathology or an injury with accuracy and in real time.6 More particularly, MRI has low sensitivity and is not appropriate for molecular imaging.5 To overcome these drawbacks, multimodal imaging approaches, combining MRI with a complementary imaging technique, such as positron emission tomography (PET), are very interesting. Indeed, such a strategy allows to apply an effective treatment as soon as possible. In one step, the mechanisms of pathologies are indicated. A rapid, specific, and appropriate treatment can be consequently applied on the patient.7
Magnetic iron oxide NPs are nowadays used as potential multimodal imaging probes7−10 such as PET/MRI,6 MRI/ultrasound (US),11 MRI/computed tomography (CT),12 or PET/near-infrared fluorescence/MRI.13 It can be highly beneficial to combine PET with MRI. PET is highly sensitive and particularly well suited for molecular imaging.5,7 The simultaneous use of MRI and PET imaging leads to high spatial resolution, high sensitivity, high technical maturity, and low radiation doses.6,9 Thus, a radiolabeled MRI probe such as radiolabeled SPIONs may show great potential as an innovative, powerful, and promising tool to enhance the noninvasive diagnosis and treatment of patients.
Iron oxide NPs have been studied and modified to develop multifunctional contrast agents with high biocompatibility and stability over a wide range of pH.2,13 They should satisfy several requirements such as a good long-term stability, a high efficiency for imaging or drug delivery, and nonspecific interactions between the NP surface and the biological media. Many strategies have been developed to improve these characteristics. They consist in the grafting of electrostatic and/or steric agents on the surface of the NPs.14−23 Some studies reported that catechol derivatives such as LDOPA,24 dopamine,25 and nitrodopamine26 have a strong affinity to metal oxides and can be used as a platform to graft other molecules such as poly(ethylene glycol) (PEG) and acyclic chelators, owing to their multiple functional groups (−NH2, −COOH, −OH).22,27−29 Macrocyclic bifunctional chelating agents can also be advantageously used because they form more stable complexes with radiometals used for PET imaging, thus preventing transchelation or transmetallation phenomenon.30 Different shapes and sizes of macrocycles are used to complex various metallic radioisotopes such as 64Cu2+, 67/68Ga3+, 111In3+, etc. For examples, the most widely used macrocyclic derivatives are those of the 1,4,7,10-tetraazacyclododecane-1,4,7,10-tetraacetic acid and the one of 1,4,7-triazacyclononane-1,4,7-triacetic acid known as DOTA and NOTA respectively. However, only a few PET/MRI bimodal imaging contrast agents based on iron oxide NPs have been developed.6,13,21,31−36 Patel et al. reported a PET/MRI imaging contrast agent using iron oxide NPs coated with DOTA to chelate Cu2+.6 Lee et al. developed a tumor-specific iron oxide probe for early clinical tumor detection using PET/MRI multimodal imaging.34 More recently, Rosales et al. used a different strategy by developing functionalized bimodal PET/MRI NPs including molecules containing dithiocarbamate groups (sulfur derivatives of carbamate functions) aiming at the chelation of 64Cu.31 This radioactive isotope is a very good candidate for PET imaging owing to its 12.7 h half-life, which allows to record images and until 24 h after injection.37−42
In our study, we aimed to develop for the first time a dual PET/MRI imaging nanoprobe based on SPIONs initially synthesized and modified by LDOPA under continuous hydrothermal conditions. In a second step, NPs were conjugated with PEG (MW = 2000 Da) and to a promising macrocyclic chelator 2,2,2-(2-{[2-(4-isothiocyanatophenyl)acetamido]methyl}-1,4,7-triazacyclononane-1,4,7-triyl)triacetic acid (p-NCS-Bz-MANOTA) to complex 64Cu2+.42 MANOTA appeared recently as a very good candidate for copper-64 radiolabeling of antibody fragments.43 The use of optimized chelators of 64Cu2+ is crucial because recent studies have shown that Cu(II)–DOTA or 1,8-N,N′-bis-(carboxymethyl)-1,4,8,11-tetraazacyclotetradecane complexes can undergo metal release in vivo and high accumulation in kidneys and liver.38−40,44,45 In vivo applications of iron oxide NPs synthesized using a continuous hydrothermal process, functionalized with p-NCS-Bz-MANOTA on their surface, have not been reported yet. The resulting bimodal agents showed a significant stability in suspension, no cytotoxicity (in vitro tests) on liver cells (HepG2 cells), and a high contrast on mouse imaging (PET and MRI), highlighting the high potential of these systems for PET/MRI future bimodal applications.
2. Results and Discussion
2.1. Chemical Characterization of the Functionalized NPs
2.1.1. Fe3O4–LDOPA NPs Synthesized by the Hydrothermal Continuous Process
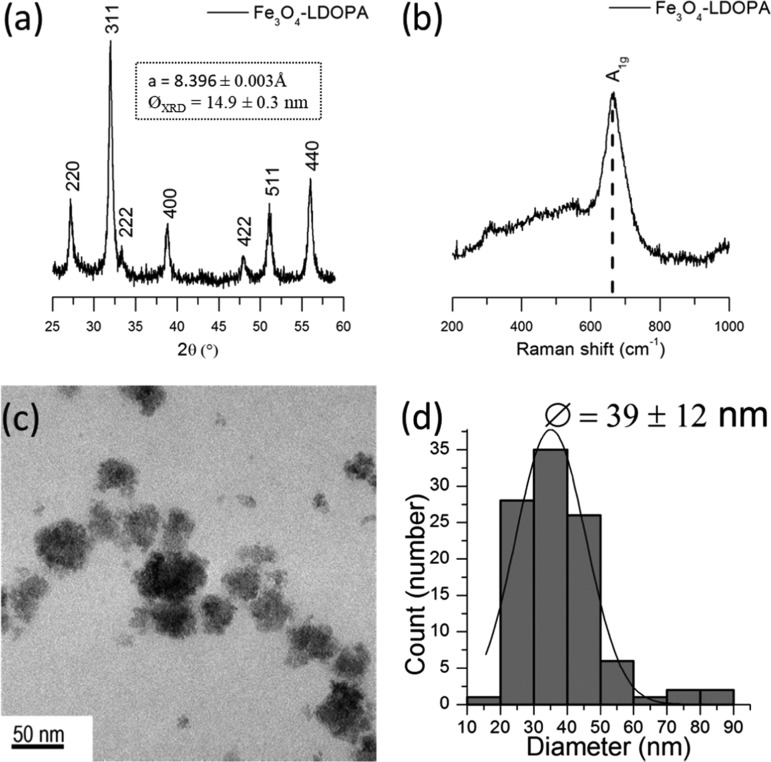
The Fe3O4–LDOPA NPs synthesized by continuous hydrothermal process have been investigated. The (220), (311), (222), (400), (422), (511), and (440) planes on X-ray diffraction (XRD) pattern46 (Figure 1a) and A1g transition47 observed in the Raman spectrum (Figure 1b) indicate the cubic inverse spinel structure of magnetite (Fe3O4, ICDD: 19-0629). Moreover, in the Raman spectra, maghemite peak at 720 cm–1, which corresponds to a partial oxidation of NPs, is not observed.48 The lattice parameter determined from the XRD results is a = 8.396 ± 0.003 Å and confirms that Fe3O4–LDOPA NPs obtained by this continuous process are nonoxidized. Fe3O4–LDOPA NPs exhibit a specific nanoflower structure (Figure 1c) as described in previous reports.49,50 Briefly, these nanoflowers (small aggregates) are composed of small crystallites (ØXRD = 14.9 ± 0.3 nm in Figure 1a) organized in a flower-shaped aggregate structure with a mean size of 39 ± 12 nm (Figure 1d).
Figure 1.
(a) XRD pattern, (b) Raman spectra, (c) transmission electron microscopy (TEM) image, and (d) TEM diameter distribution of Fe3O4–LDOPA NPs.
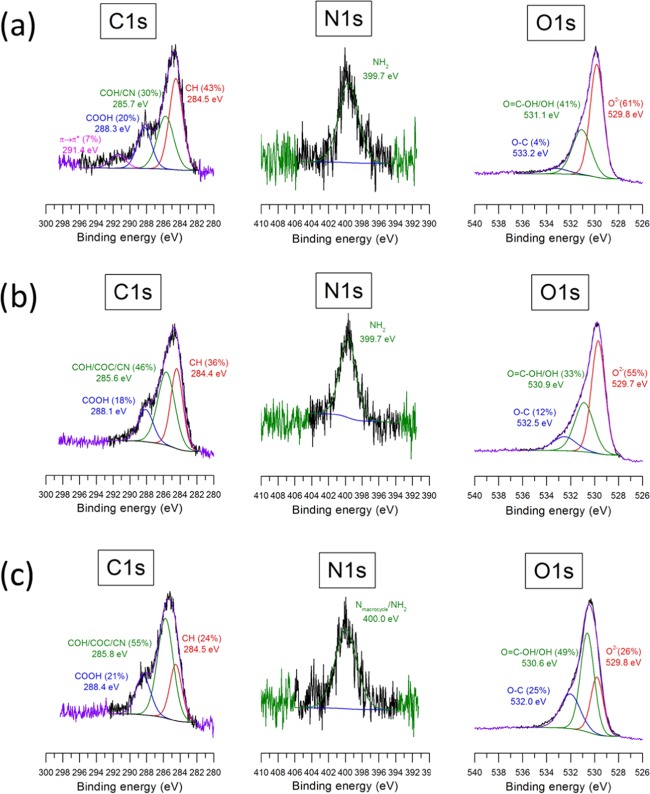
LDOPA ligands on the surface of NPs are detected by IR spectroscopy. The characteristic vibrations at 1485 cm–1 (ν(CC) of the benzene ring),51 1590 cm–1 (COO– groups),52 and 1345 cm–1 (ν(CC) and ν(CO))51 confirm the grafting of LDOPA on the surface of NPs (Figure 2). X-ray photoelectron spectroscopy (XPS) measurements confirm also the grafting of LDOPA on the surface of iron oxide NPs (Figure 3a). As previously reported,49 the characteristic peaks of LDOPA are observed on C 1s (π → π* contribution at 291.4 eV and COOH contribution at 288.3 eV) and on N 1s (NH2 group, 399.7 eV) levels.
Figure 2.
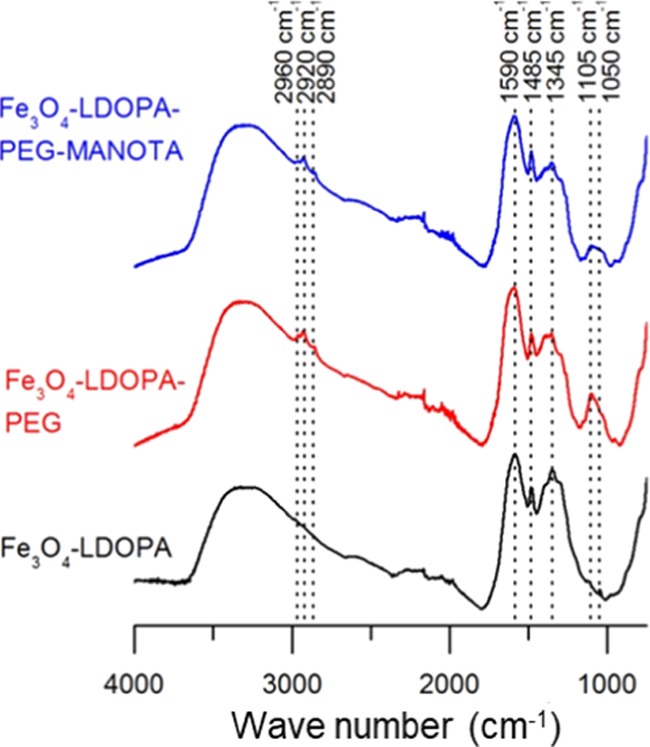
Fourier transform infrared spectra collected from 4000 to 750 cm–1 on Fe3O4–LDOPA, Fe3O4–LDOPA–PEG, and Fe3O4–LDOPA–PEG–MANOTA NPs.
Figure 3.
XPS spectra of curve-fitted C 1s, N 1s, and O 1s peaks recorded on (a) Fe3O4–LDOPA, (b) Fe3O4–LDOPA–PEG, and (c) Fe3O4–LDOPA–PEG–MANOTA NPs.
2.1.2. Functionalized Fe3O4–LDOPA–PEG and Fe3O4–LDOPA–PEG–MANOTA NPs
The different functionalizations were analyzed thanks to thermogravimetric analysis (TGA) to characterize the grafting ratio of PEG and MANOTA at the surface of SPIONs–LDOPA (Figure S1). Mass losses increased as additional organic moieties were added at each successive step of grafting leading to 2.49 LDOPA, 0.07 PEG2000, and 0.04 MANOTA nm–2 on the surface of SPIONs. The details of the equation are given in Figure S2. It should be noted that the specific surface area of SPIONs–LDOPA was (SBET = 147 ± 2 m2 g–1). It was considered that SBET remained the same for all following steps.
XPS measurements indicate an evolution of C 1s, O 1s, and N 1s contribution when samples are modified by PEG and MANOTA, as can been seen in Figure 3. The π → π* contribution of C 1s peak concerning the Fe3O4–LDOPA–PEG NPs disappeared (Figure 3b). It can be explained by the new layer of PEG around the nanoparticle.53 Moreover, the proportion corresponding to COH/COC/CN groups of C 1s level improves from 30% for the Fe3O4–LDOPA NPs to 46% for the Fe3O4–LDOPA–PEG NPs as the O–C contribution of O 1s level from 4% for Fe3O4–LDOPA NPs to 12% for Fe3O4–LDOPA–PEG NPs. These observations are attributed to the large number of COC groups in PEG (MW: 2000 Da). Furthermore, the O2– contribution (structure oxygen from NPs) of O 1s level and COOH contribution of C 1s level decrease for Fe3O4–LDOPA–PEG NPs compared to Fe3O4–LDOPA. Finally, a shift of binding energies concerning COOH and O–C contributions of Fe3O4–LDOPA–PEG NPs compared to Fe3O4–LDOPA NPs are observed. These shifts to low binding energy are equal to 0.2 and 0.7 eV (COOH and OC, respectively). The COOH shift indicates a modification of the electronic environment around this group. It is due to the covalent linkage between COOH of LDOPA and NH2 of MeO–PEG–NH2. The last shift comes from the large number of COC in PEG. The N 1s contribution is not modified for Fe3O4–LDOPA–PEG sample because the NH2 group of LDOPA is not again modified. These results confirm that a PEG organic shell covers the NPs surface.
Some changes in the Fe3O4–LDOPA–PEG–MANOTA sample are also observed (Figure 3c). The COH/COC/CN proportion increases from 46% (Fe3O4–LDOPA–PEG NPs) to 55% for (Fe3O4–LDOPA–PEG–MANOTA NPs). The COOH contribution also increases from 18% (Fe3O4–LDOPA–PEG NPs) to 21% (Fe3O4–LDOPA–PEG–MANOTA NPs). These observations come from the large number of COOH groups and CN bonds in MANOTA derivatives. The O–C and O=C–OH/OH proportions concerning the O 1s level increase as well. They increase from 33% (Fe3O4–LDOPA–PEG NPs) to 49% (Fe3O4–LDOPA–PEG–MANOTA NPs) and from 12% (Fe3O4–LDOPA–PEG NPs) to 25% (Fe3O4–LDOPA–PEG–MANOTA NPs). It is due to the COOH groups of MANOTA-NCS and confirms the presence of the chelator on the surface of NPs. Moreover, the O2– contribution decreases to 26% for Fe3O4–LDOPA–PEG–MANOTA NPs. The COOH contribution of the C 1s level is modified. A shift to high binding energies from 288.1 eV (Fe3O4–LDOPA–PEG NPs) to 288.4 eV (Fe3O4–LDOPA–PEG–MANOTA NPs) is observed. A shift to low binding energies of the O−C contribution is also highlighted in the O 1s level, showing a decrease from 532.5 eV for Fe3O4−LDOPA−PEG NPs to 532.0 eV for Fe3O4−LDOPA−PEG−MANOTA NPs This can be explained by the CO groups of MANOTA. Finally, we also observed a modification of the N 1s level: after the conjugation of p-NCS-Bz-MANOTA with the NH2 group of LDOPA, a slight shift to high binding energies is observed. This increase from 399.7 eV (Fe3O4–LDOPA–PEG NPs) to 400.0 eV (Fe3O4–LDOPA–PEG–MANOTA NPs) can be attributed to the CN contributions of MANOTA cycles, which have similar (cyclic) structure to other polyazamacrocycles for which similar behavior has already been observed in literature.54 XPS data confirm the grafting of p-NCS-Bz-MANOTA on the NPs surface (Fe3O4–LDOPA–PEG). These results show that NH2 and COOH groups of LDOPA (after the continuous hydrothermal synthesis of magnetite NPs) are free and available for grafting other molecules, like in this case PEG and MANOTA, both present on the surface of NPs.
In the IR spectra of Fe3O4–LDOPA–PEG and Fe3O4–LDOPA–PEG–MANOTA NPs, new vibration bands are observed compared to that of Fe3O4–LDOPA NPs (Figure 2). The vibrations at 2960, 2920, and 2890 cm–1 correspond to the asymmetric stretching of CH2, stretching of CH (CH, symmetric CH3), and symmetric stretching of CH2 groups from PEG, respectively.55 The bands at 1105 and 1050 cm–1 are assigned to ether asymmetric stretching.55,56 The CN, CO, and CC bonds, which compose MANOTA, have the same vibration bands as PEG. The vibration bands of LDOPA are also kept after the grafting of PEG and MANOTA on the surface of NPs. The IR spectroscopy also confirms the grafting of PEG and MANOTA on the NPs’ surface.
The ζ-potential measurements (Figure 4) also confirm the grafting of PEG and MANOTA. Fe3O4–LDOPA NPs indicate an isoelectric point (IEP) of 2.8 and a ζ-potential of −30 mV at physiological pH (pH = 7.4). A screening of the ζ-potential and a shift of the IEP are observed when the NPs are functionalized by PEG. The IEP and the ζ-potential at physiological pH of Fe3O4–LDOPA–PEG NPs are pH 6 and −8 mV, respectively. This screening is due to the presence of PEG on the NPs surface; the absence of charge on this polymer and the presence of covalent bond between the COO– terminal group of LDOPA and the NH2 terminal group of MeO–PEG–NH2 contribute to this effect. This new bond tends to modify and more precisely cancels the electronic charges on the COO– of LDOPA. The latter is corroborated by the new IEP and confirms this grafting. The IEP is shifted to 9.1 (Fe3O4–LDOPA–PEG–MANOTA NPs) due to the presence of MANOTA molecules. The ζ-potential range of Fe3O4–LDOPA–PEG–MANOTA is the same as that of Fe3O4–LDOPA–PEG. These results confirm the grafting of MANOTA on the NPs’ surface.
Figure 4.
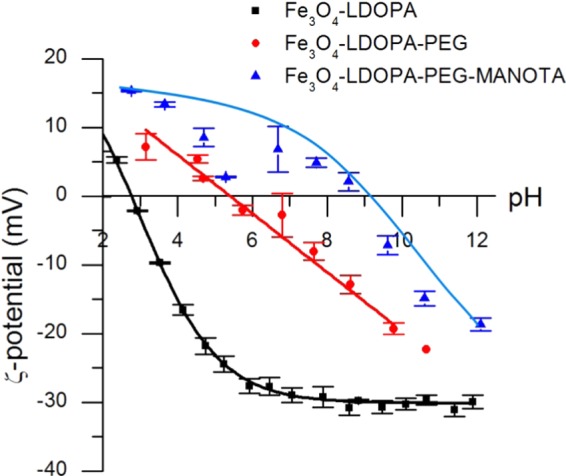
Zetametry of Fe3O4–LDOPA, Fe3O4–LDOPA–PEG, and Fe3O4–LDOPA–PEG–MANOTA NPs.
IR spectroscopy, XPS, and ζ-potential measurements prove that the NH2 groups and COO– of LDOPA of Fe3O4–LDOPA NPs, which are synthesized by a hydrothermal synthesis, are available and active for the grafting of PEG and p-NCS-Bz-MANOTA.
Dynamic light scattering (DLS) measurements reveal a shift of the hydrodynamic diameter of the NPs in Figure 5. More precisely, a slight increase of the hydrodynamic diameter is observed from 90 ± 2 nm (Fe3O4–LDOPA NPs) to 119 ± 6 nm (Fe3O4–LDOPA–PEG–MANOTA NPs). The hydrodynamic size does not increase significantly after the grafting of MANOTA. This observation suggests that there is no cross-linking between NPs from carboxyl groups of MANOTA. Grafted PEG molecules participate in the prevention of this phenomenon by a steric effect. The organic layer surrounding the metal oxide increases upon grafting of PEG and MANOTA on the surface of NPs: PEG contributes to a steric hindrance around the NPs. Consequently, this layer extends the hydrodynamic diameter. Moreover, the average hydrodynamic size is under 200 nm, which is efficient for nanoprobe delivery.57 Moreover, the colloidal stability of SPIONs–LDOPA–PEG2000 NPs has been evaluated in several media. The hydrodynamic diameters are as follows: NaCl 10–2 M (95 ± 2 nm), phosphate-buffered saline (PBS) 1× (115 ± 4 nm), minimal essential medium (MEM, 106 ± 1 nm), and albumin 60 mg mL–1, 24 h at 37 °C (120 ± 2 nm). We can see that the hydrodynamic size remains almost the same whatever the conditions.
Figure 5.
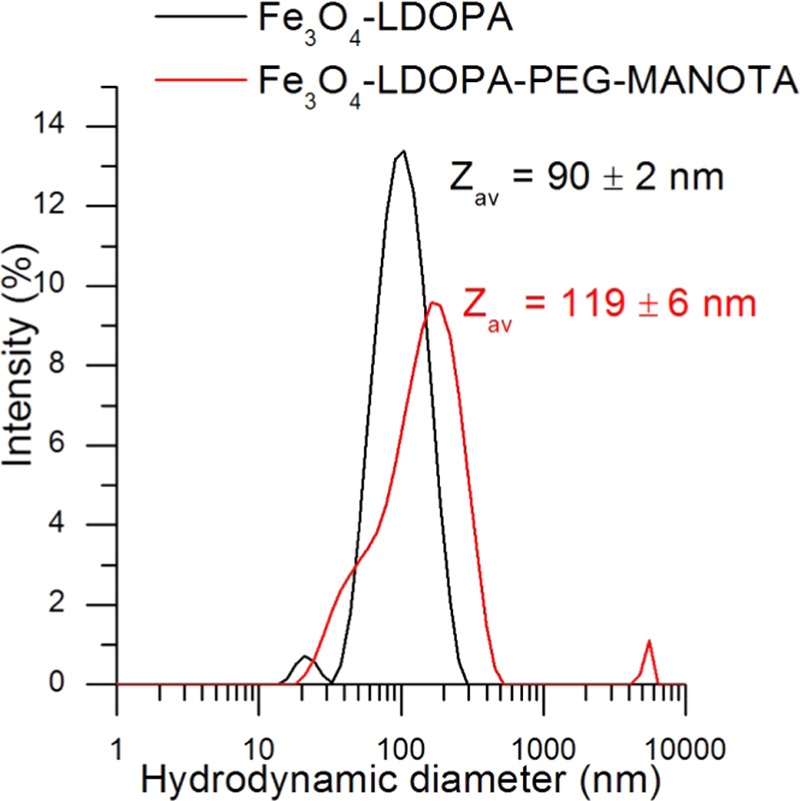
DLS measurements of Fe3O4–LDOPA and Fe3O4–LDOPA–PEG–MANOTA NPs in PBS (0.1 M).
2.2. In Vitro Cytotoxicity Test
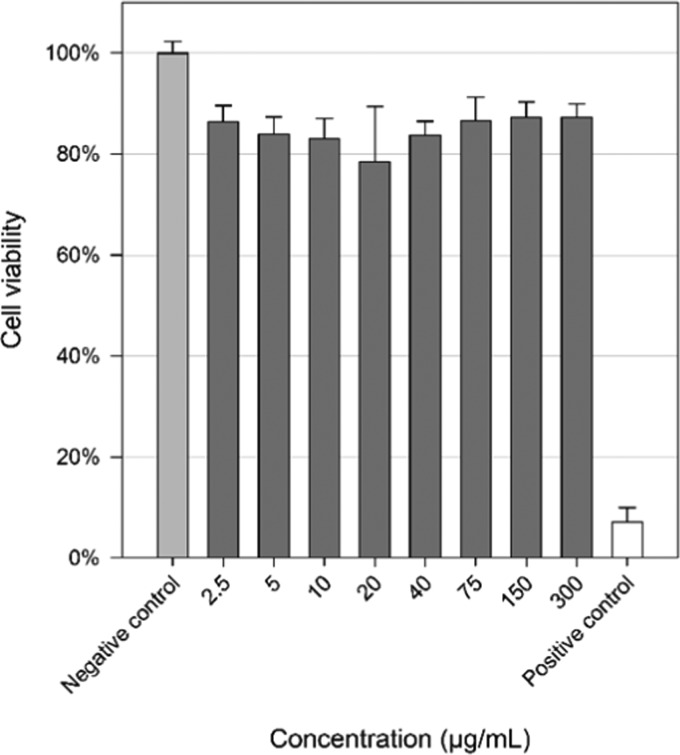
The cytotoxicity of Fe3O4–LDOPA–PEG–MANOTA NPs is evaluated on HepG2 liver cells (Figure 6), which are exposed to a wide range of NPs concentrations from 2.34 to 300 μgFe3O4 mL–1. Positive cells exposed to a toxic agent (sodium dodecyl sulfate 3%) and negative controls (without exposition) are realized. Whatever the NPs concentration, the cell viability is approximately 80–90%, which is not statistically different from the negative control. Indeed, we evaluate with this test a high concentration of NPs (until 300 μg mL–1) compared to those mentioned in the reported literature.58,59 No dose effect is observed in the present study. The mitochondrial enzymatic activity of HepG2 cells is maintained when they are exposed to the functionalized NPs during 24 h. Thanks to these results, an in vivo evaluation of Fe3O4–LDOPA–PEG–MANOTA NPs on animals (mice) was performed.
Figure 6.
Cytotoxicity of HepG2 cells in the resazurin assay after exposure to different concentrations (μg mL–1) of Fe3O4–LDOPA–PEG–MANOTA NPs for 24 h. Results are expressed as mean ± standard deviation (three independent experiments). Statistical difference was checked using a one-way analysis of variance (ANOVA) followed by a Dunnett test (p < 0.05).
2.3. In Vivo Evaluation
2.3.1. Radiolabeling and PET/CT Imaging
In vivo PET imaging application of Fe3O4–LDOPA–PEG–MANOTA NPs on an animal model (mice) was performed to test the stability of the 64Cu–MANOTA complex in a first set of experiments. Fe3O4–LDOPA–PEG–MANOTA was radiolabeled with 64Cu with satisfying specific activity (3 MBq μmolFe–1). Radiolabeling yield was only 60% before purification, which may be explained by complexation of iron ions present in solution, leading to a competition between iron and copper chelation.
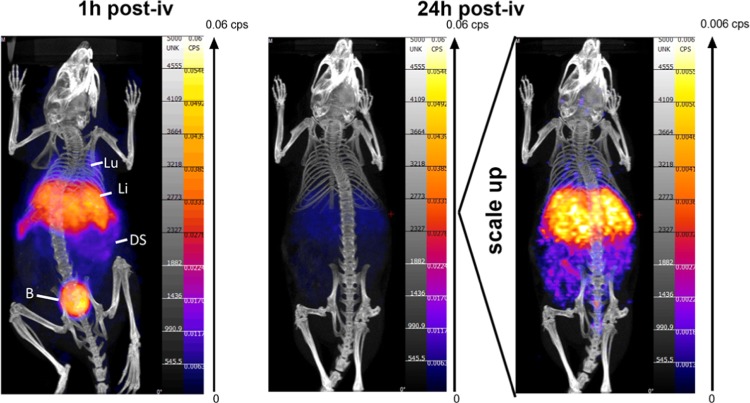
An amount of 0.8–1.2 μmolFe per mouse with an initial activity (at t0) of 2.5–3.7 MBq per mouse (64Cu) is injected. Then, images are acquired 1 and 24 h after injection (Figure 7). After 1 h, a large uptake of Fe3O4–LDOPA–PEG–MANOTA–64Cu NPs is observed in the liver, spleen, and bladder. In addition, a small activity is observed in lungs and digestive system. After 24 h, most of the radioactivity disappeared. Nevertheless, a scale up of the image after 24 h allows to show the low remaining activity in the liver with a weak signal in the spleen and digestive system. Fe3O4–LDOPA–PEG–MANOTA–64Cu NPs are progressively eliminated from the body after 24 h.
Figure 7.
Whole-body PET imaging of Fe3O4–LDOPA–PEG–MANOTA–64Cu NPs on mouse 1 and 24 h after injection with a scale up at 24 h. Labels: B = bladder, DS = digestive system, Li = liver, and Lu = lungs.
A biodistribution study of Fe3O4–LDOPA–PEG–MANOTA–64Cu NPs was performed to determine the potential of these NPs as a bimodal PET/MRI in vivo probe. First, several blood samples were analyzed (Figure 8). After 1 h, the activity of Fe3O4–LDOPA–PEG–MANOTA–64Cu NPs in the bloodstream decreases quickly from ∼8 to ∼2%. As demonstrated in Figure 8, the blood clearance of SPIONs was fast. This phenomenon is due to the particle charges (+6 mV) and their relatively large size (119 ± 6 nm). Another reason would be their surface coating. Longer circulation half-life has been noted on 64Cu-labeled magnetite NPs60 (37% of the injected dose remained in blood after 1 h), maybe due to the PEGylated phospholipids coating of these nanoparticles or to smaller hydrodynamic sizes (20.3 ± 1.9 nm).
Figure 8.
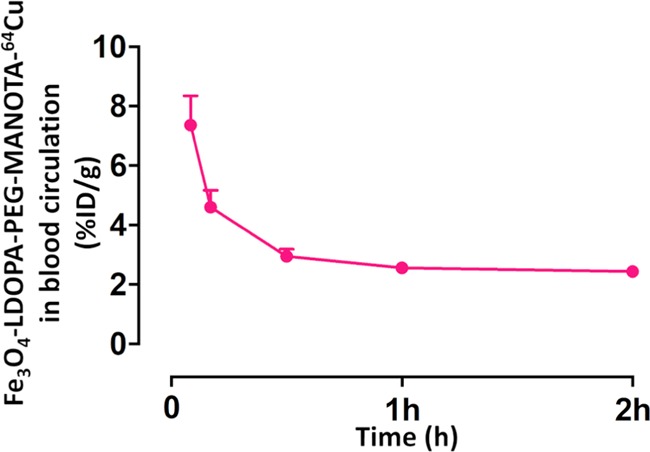
Evaluation of the injected dose (Fe3O4–LDOPA–PEG–MANOTA–64Cu) per gram (tissue) in blood circulation on three mice during 2 h following intravenous injection.
Then, we observe that the radioactivity is mainly localized in the liver (9% ID g–1), spleen (6% ID g–1), lungs (6% ID g–1), and kidneys (5% ID g–1) with a low activity in the heart (3% ID g–1) after 48 h (Figure 9). These results confirm the PET images (Figure 7). A previous study reveals that a hydrodynamic size of 85 nm also induces a rapid clearance.36 Moreover, it has been previously reported that positively charged nanoparticles can lead to nonspecific internalization rate and short blood circulation half-life.61 Nevertheless, after 48 h, a small activity in blood (1% ID g–1) and heart (2% ID g–1) is still detected (Figure 9). This low activity in bloodstream (heart and lungs, both of which are heavily vascularized tissues) shows that NPs followed the pattern of blood retention.60 Our biodistribution study is in accordance with a previous study with different 64Cu-labeled superparamagnetic iron oxide NPs for PET/MRI imaging (NOTA macrocycle).33 These observations seem to prove that MANOTA does not desorb from the surface of NPs. By adding the activities obtained by the γ-counting of all organs and carcasses to the data, we determine the remaining activity in the animal at the time of euthanasia. Fifty percent of the injected dose is eliminated after 48 h. These results show that we can deliver high doses in liver and spleen. These bimodal contrast agents can be very interesting for some liver pathologies that lack precision of current imaging procedures, such as infections62 or cystic lesions,63 for which multimodal imaging may improve early diagnosis and takeover. Moreover, we show and confirm that MANOTA has a high efficiency to complex 64Cu with good stability as recently reported.43 Indeed, we have also analyzed, via magnetic susceptibility method (Figure S4), the urine of the injected animals and found some signal demonstrating the presence of SPIONs in the bladder and urine. It is possible that due to the polydispersity of our nanoparticles, the smallest ones could have been excreted in urine, explaining the presence of radioactivity in this organ without 64Cu decomplexation from particle surface during circulation. Thus, we proved that when radioactivity was observed in urine, the presence of SPIONs was also proven, demonstrating that these nanohybrids were excreted intact.
Figure 9.
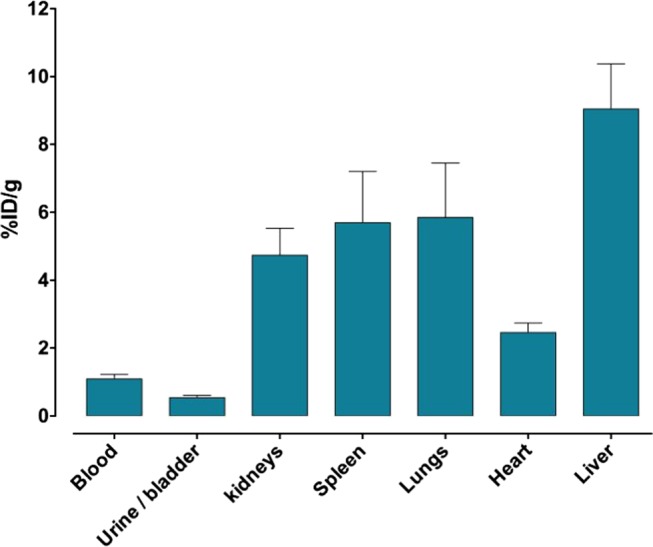
Evaluation of the biodistribution of Fe3O4–LDOPA–PEG–MANOTA–64Cu NPs 48 h after intravenous injection in mice. Values represent the mean ± standard deviation of the percentage of the injected dose per gram of tissue in different organs (n = 4).
Consequently, the Cu64-radiolabeled Fe3O4–LDOPA–PEG–MANOTA NPs are detectable by PET imaging, with a rapid elimination from the body and main metabolism in liver. The fast clearance as well as the imaging capabilities confirm that a novel NP-based PET imaging probe was successfully developed. MANOTA, a recently developed macrocycle, was grafted for the first time and with a high efficiency on the surface of prefunctionalized NPs (Fe3O4–LDOPA) synthesized thanks to a continuous hydrothermal process. No previous study reports the grafting and the study of this macrocycle (MANOTA) on magnetite NPs for an in vivo application. For this reason, we decided to further investigate our compounds, and we could carried out a second in vivo set of experiments combining MRI and PET imaging to test the bimodal potential of Fe3O4–LDOPA–PEG–MANOTA NPs.
2.3.2. In-Line PET/MRI Imaging
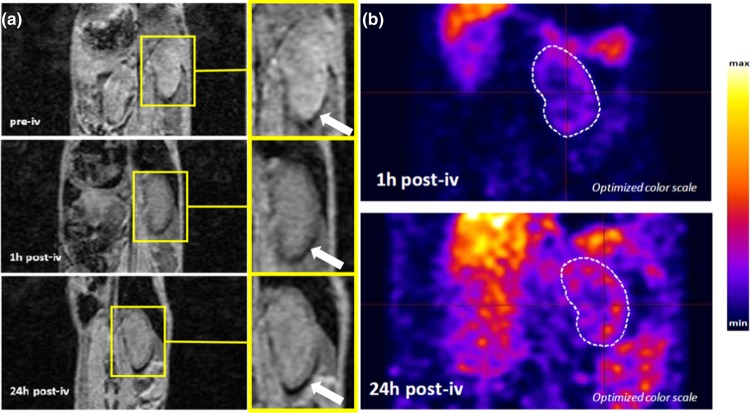
The Fe3O4–LDOPA–PEG–MANOTA NPs show a high transverse relaxivity (r2 = 360 ± 10 mMFe–1 s–1), which confirms that these NPs are an excellent probe for T2 and T2*-weighted MRI. We conducted thereby a PET/MRI imaging study, using a new and innovative apparatus, which allows to perform MRI and PET sequentially within the same imaging session without the transfer of mice between each imaging technique. MR signal variation was evaluated in the cortex of the kidneys and the liver for this experience. Three-dimensional (3D) T2*-weighted MRI images were performed before, 1 and 24 h after injection of the particle suspension and PET imaging was performed after 1 and 24 h. MRI images show a clear negative contrast effect in the renal cortex (outer structure of kidneys) 1 and 24 h after injection compared with images before injection (Figure 10a). The observed signal variations in the kidneys could be distinguished on MRI images as a gradual darkening of the renal cortex signal (Figures 10a). PET imaging (Figure 10b) also shows activity in liver after 1 and 24 h. These observations combined with the previous study confirm that Fe3O4–LDOPA–PEG–MANOTA–64Cu NPs have bimodal imaging properties with high transverse relaxation and radioactive property. Moreover, PET studies combined with MRI show that 64Cu is not dissociated from its complex with MANOTA macrocycle grafted on the surface of NPs, which has already been observed for 64Cu–DOTA and TETA complexes.60,64 Indeed, 64Cu, detected thanks to PET, was localized in the same organs than SPIONs, detected thanks to MRI. Biodistribution data and PET/MRI images show that Fe3O4–LDOPA–PEG–MANOTA–64Cu NPs are efficient for liver, kidneys, and spleen evaluation.
Figure 10.
(a) Three-dimensional (3D) T2*-weighted MR images and (b) PET imaging of renal cortex at different time of injection: before injection (pre-iv) for MRI, after 1 h (1 h post-iv), and 24 h (24 h post-iv) after injection of Fe3O4–LDOPA–PEG–MANOTA–64Cu NPs in a mouse.
3. Conclusions
In this study, for the first time, we succeeded in grafting PEG and MANOTA chelator on prefunctionalized iron oxide NPs (Fe3O4–LDOPA) synthesized under continuous hydrothermal conditions (150 °C and 25 MPa) for bimodal PET/MRI imaging. The characterization of the functionalized NPs (XPS, IR, ζ-potential, and DLS analyses) confirmed that it is possible to graft PEG and MANOTA on COOH and NH2 groups of LDOPA, respectively. The hydrodynamic size of the NPs under 200 nm is relevant for use as an in vivo contrast agent. The functional groups of LDOPA remain available after the continuous hydrothermal synthesis. Bimodal imaging PET/MRI experiments are encouraging, as these NPs are detectable in both PET and MRI with a high contrast. They highlight an activity in the liver, spleen, lungs, and kidneys with a gradual elimination from the body. NPs showed a high contrast between tissues without NPs and tissues with functionalized NPs. These results are promising and point out the potential benefits of MANOTA-labeled iron oxide nanoparticles as a good candidate for a bimodal PET/MRI tracer. Additionally, a specific targeting may be envisaged with the grafting of proteins on the surface of NPs to develop a diagnostic imaging agent.
4. Materials and Methods
4.1. Chemicals
Iron(III) sulfate (97%), ammonium iron(II) sulfate hexahydrate (99%), sodium hydroxide (99%), LDOPA (98%), N-hydroxysuccinimide (98%) N,N-diisopropylethylamine (DIEA) (99.5%), and N-(3-dimethylaminopropyl)-N′-ethylcarbodiimide hydrochloride were purchased from Sigma-Aldrich. Demineralized water (conductivity, σ = 2.2 μS cm–1) was used for the hydrothermal synthesis. Phosphate buffered saline (PBS) 1× solution was purchased from Fisher Bioreagents. Extra dry dimethyl sulfoxide (DMSO > 99.7%) was purchased from Acros. MeO–PEG–NH2 (molecular weight, MW = 2000 Da) was purchased from Iris Biotech GmbH. 2,2,2-(2-{[2-(4-Isothiocyanatophenyl)acetamido]methyl}-1,4,7-triazacyclononane-1,4,7-triyl)triacetic acid (p-NCS-Bz-MANOTA) was synthesized as previously described.4264Cu copper chloride (64CuCl2, 1 in 0.1 N HCl) was purchased from Arronax (Saint-Herblain, France). The radiolabeling yield and the absence of free 64Cu in the labeled constructs were determined using instant thin layer chromatography impregnated with silica gel (ITLC-SG) strips (Agilent, Santa-Clara, CA).
4.2. Characterization
4.2.1. Powder X-ray Diffraction (XRD) Characterization
XRD pattern was collected using a Siemens D5000 diffractometer with Cu Kβ radiation (λ = 1.39222 Å). Scans were acquired over a 2θ range of 20–59° with a step size of 0.03° and a scan speed of 150 s per angle. Diffract-AT software was used for the data analysis (curve fitting). Correction of instrumental broadening was carried out using a standard reference material (Quartz). The mean crystallite size of the samples was calculated using Halder and Wagner method by XRD line-broadening technique.65 The lattice parameter of the powder was deduced from the XRD line positions using a least-squares refinement method (in-house software taking into account the effect of sample gap).
4.2.2. Transmission Electron Microscopy (TEM) Observations
TEM measurements were performed using a JEOL JEM-2100F microscope operating at 200 kV (point-to-point resolution of 0.19 nm). A diluted suspension of NPs in deionized water was evaporated on a carbon-coated copper grid. The average size of crystallites was calculated by counting 100 individual nanoparticles. The size distribution curves were calculated using a Gaussian fit.
4.2.3. Surface Area Measurements
Specific surface area measurement was performed with a Micromeritics Tristar II apparatus and calculated with the Brunauer–Emmett–Teller (BET) method (SBET) from N2 gas adsorption. The samples were first outgassed in situ (20 mTorr; 100 °C; 16 h).
4.2.4. ζ-Potential Measurements and Dynamic Light Scattering (DLS) Measurements
ζ-Potential and DLS measurements were carried out with Malvern Zetasizer Nano ZS supplied with DTS Nano V7.12 software. For each ζ-potential measurement, powders were dispersed in 12 mL of NaCl aqueous solution (10–2 M). pH titrations were performed using HCl (0.1 M), NaOH (0.1 M), or NaOH (0.01 M) aqueous solutions. The DLS measurements of suspensions were performed at 25 ± 0.1 °C in NaCl (10–2 M). The samples were filtered (0.45 μm filter) to remove possible pollutants or large agglomerates. The DLS curves were derived from intensity calculations.
4.2.5. Infrared (IR) Spectroscopy Measurements
IR spectroscopy measurements were performed on ATR mode using Thermofisher Iz10. The IR spectra were collected in the wavenumber range of 4000–750 cm–1 with a resolution of 4 cm–1.
4.2.6. X-ray Photoelectron Spectroscopy (XPS) Measurements
XPS measurements were carried out using a PHI 5000 Versaprobe instrument with an Al Kα monochromatic radiation (EKα(Al) = 1486.7 eV with a spot size 200 μm in diameter). The powders were pressed on an indium sheet. Data were analyzed with CasaXPS processing and MultiPak software. Neutralization method was employed to minimize the charging effects and the carbon C 1s peak at 284.5 eV was used as the reference. As LDOPA, PEG, and MANOTA are insulators, neutralization process is required. A Shirley background was subtracted and Gauss (70%)–Lorentz (30%) profiles were used. Full width at half-maximum was fixed between 1.5 and 2.4 eV except for the fitted C 1s (π–π*) peak (2.3 eV). The MultiPak software was employed for the quantitative analysis.
4.2.7. Thermogravimetric Analysis (TGA) Measurements
The powders were analyzed using Discovery TGA-TA Instruments with a nitrogen flow rate of 25 mL min–1. A temperature ramp of 5 °C min–1 from 25 to 800 °C was employed.
4.2.8. Relaxivity Measurements
The particle transverse relaxivity (r2 in mMFe–1 s–1) was calculated according to the following method.66 Water proton transverse relaxation time (T2) measurements at 3 T were carried out at 298 ± 1 K with a Siemens Magnetom Trio TIM using a commercially available birdcage head coil. Relaxation time measurements were performed on test tubes containing SPIONs in acrylamide gel at different concentrations (0, 1, 3, 5, 7, and 10 μgFe mL–1). For T2 determination, a multi-echo spin-echo pulse sequence was used, with a repletion time (TR) of 5000 ms, a matrix of 256 × 204, a FOV of 100 × 80 mm2, and a slice thickness of 5 mm. Images were acquired at 32 echoes, from a TE of 8 ms to 256 ms with a 8 ms interval. Image analyses were performed using ImageJ (image analysis software developed by NIH). The signal-decay curve was fitted using a nonlinear function with an equation of S(TE) = A e(−TE/T2), and the relaxivity, r2 (in mMFe–1 s–1), was determined by fitting the curve of relaxation rate (1/T2) versus the iron concentration in μgFe mL–1.
4.2.9. Magnetic Susceptibility Measurements (MSM)
Magnetic susceptibility measurements were performed on a Bartington MS3 magneto-susceptometer at 300 K. A MS2G monofrequency sensor was used for around 1 mL cells operated at 1.3 kHz. Before every measurement, a control cell with the same media or material without any SPION was measured and subtracted as background.67 A calibration curve realized with LDOPA–SPIONs was used to determine the quantity of nanoparticles in different media/organs.
4.2.10. In Vivo PET-CT and PET-MR Imaging
All animal studies were conducted in accordance with the legislation on the use of laboratory animals (directive 2010/63/EU) and approved by accredited Ethical committee (C2ea Grand Campus no. 105). Female CD-1 mice (20–25 g, Charles River, France) were used.
In the first set of experiments, PET-CT imaging was performed using BioPET-CT preclinical imaging system (Bioscan). Whole-body CT scan was acquired using the following parameters: 150 μA, 45 kV, 360 projections, and 8 shots/projection. Whole-body 45–60 min static PET image was obtained using 250–700 keV energy window.
In the second set of experiments, a sequential MRS-PET system (MR solutions, U.K.) was used. This system associates a 3T cryogen free magnet MRS 3000 with a clip-on SiPM PET ring. PET (250–700 keV) and MRI acquisitions (scout images followed by a gradient echo sequence—FLASH-3D: TE 5 ms; TR 40 ms; 0.5 mm slice thickness—acquired in the coronal plane) were performed sequentially. Animal respiration was monitored with abdominal pressure sensor and dedicated software (PC Sam, SAII, Stony Brook).
Finally, the PET-CT and PET-MR fusion images were obtained using VivoQuant (Invicro, Boston). Each scan was then visually interpreted.
For biodistribution evaluation, the mice were euthanized, organs were collected and weighed, and radioactivity was measured with a scintillation γ-counter (Cobra 4180, PerkinElmer, Waltham, MA).
4.3. Methods
4.3.1. Fe3O4–LDOPA NPs Synthesis
The Fe3O4–LDOPA NPs were synthesized using a hydrothermal continuous process previously reported.49 Briefly, at 20 °C, a solution of ferrous and ferric ions (8 and 16 mM, respectively) with a 1:2 molar ratio in aqueous solution (High Pressure Pump 1, HPP 1), 0.33 M of NaOH solution (HPP 2), and preheated demineralized water (HPP 3) was introduced in the counter-current reactor. LDOPA, 24 mM, was added to the metallic salt precursors. The suspension was then quickly cooled to stop the growth of NPs in two steps by the addition of water (HPP 4) at 20 °C and using a cooling bath. The experiment was conducted at 150 °C and 25 MPa in the whole apparatus with a total flow rate of 80 mL min–1 (4 × 20 mL min–1). The product was washed by dialysis (Cellu·Sep tubular membranes of 3500 Da) and ultrafiltered (Amicon UltraCell 30 kDa) until the dielectric constant value of demineralized water was obtained (2.2 μS cm–1). Dry powder was obtained by lyophilization for subsequent analysis. A small amount was saved in suspension for DLS and TEM measurements.
4.3.2. Conjugation of Fe3O4–LDOPA NPs with PEG
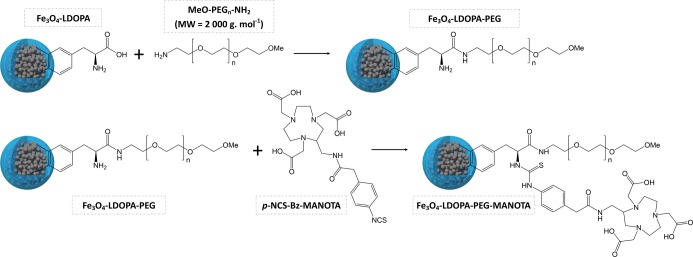
Fe3O4–LDOPA NPs, 17.5 mg, were suspended in 5 mL of DMSO. The suspension was placed in a sonic bath for 3 min (30 W) and then using an ultrasonic probe for 10 s (80% of a 400 W Branson Ultrasonic device). EDC, 76.85 mg, and then NHS, 113.92 mg, were added to the suspension and placed in a sonic bath for 10 s (30 W). An orbital shaker was then applied for 15 min. The product was mixed with 100 mg of MeO–PEG–NH2 (MW: 2000 Da) and 700 μL of DIEA. Finally, the suspension was placed under an orbital shaker for 3 h. The suspension (Fe3O4–LDOPA–PEG) was purified by ultrafiltration (Amicon UltraCell 30 kDa). A schematic view of the conjugation chemistry between the Fe3O4–LDOPA NPs with PEG is presented in Figure 11.
Figure 11.
Schematic view of the conjugation chemistry between Fe3O4–LDOPA NPs with PEG and p-NCS-Bz-MANOTA.
4.3.3. Conjugation of Fe3O4–LDOPA–PEG NPs with p-NCS-Bz-MANOTA
Fe3O4–LDOPA–PEG NPs, 10.1 mg, were suspended in 5 mL of DMSO. The suspension was placed in a sonic bath for 3 min and then under an ultrasonic tip for 10 s (80% of a 400 W Branson Ultrasonic device). Seven hundred microliters of DIEA were added. p-NCS-Bz-MANOTA, 7.9 mg, were added to the suspension, which was placed under an orbital shaker for 3 h. The final suspension (Fe3O4–LDOPA–PEG–MANOTA) was purified by ultrafiltration (Amicon UltraCel 30 kDa). A schematic view of the conjugation chemistry between Fe3O4–LDOPA NPs with PEG and p-NCS-Bz-MANOTA is presented in Figure 11.
4.4. Radiolabeling of Fe3O4–LDOPA–PEG–MANOTA NPs by 64Cu
64CuCl2 (94 μL), 116 MBq, was mixed with an equal volume of 1 M CH3CO2NH4 buffer, resulting in a final pH of 5.6. 333 μL of Fe3O4–LDOPA–PEG–MANOTA (20 μmol Fe, 52 μL) were then added and the mixture was stirred for 45 min at 37 °C. After incubation, 35 μL of 50 mM ethylenediaminetetraacetic acid (EDTA) in 0.1 M AcONH4 was added to chelate the possibly free copper-64. The resulting 64Cu–EDTA was then removed by ultrafiltration with 30 kDa Amicon Ultra, and the product was diluted in PBS, pH 7.4 prior to injection. ITLC was performed to determine the radiolabeling yield and to assess the absence of free 64Cu. ITLC-SG strip was eluted with sodium citrate 0.1 M, pH 5 and the strip was then analyzed using an AR-2000 radiochromatograph (Eckert & Ziegler, Berlin, Germany) (Rf = 0 for radiolabeled nanoparticles, whereas Rf = 1 for small 64Cu-chelates (i.e., 64Cu–EDTA or 64Cu–AcO)).
4.5. In Vitro Cytotoxicity Study
4.5.1. Cell Culture
The human hepatocellular carcinoma cell line HepG2 was obtained from ECACC (European collection of authenticated cell cultures). Routine monitoring has shown the HepG2 cells to be mycoplasma free (MycoAlert PLUS detection kit from Lonza). The cells were grown in a monolayer culture in minimal essential medium (MEM) supplemented with 1% stable glutamine (PAA), 1% nonessential amino acids (PAA), and 10% fetal bovine serum (v/v) (FBS from PAA) in a humidified atmosphere at 37 °C containing 5% CO2. Continuous cultures were maintained by subculturing flasks every 7 days at 2.106 cells/75 cm2 by trypsination.
4.5.2. Test Plate Preparation
After washing with sterile phosphate buffer saline (PBS), the cells were detached by trypsinization (0.05% trypsin/EDTA from Gibco). Twenty-four hours before exposure, HepG2 cells were seeded into 96-well plates (Dutscher, France) in 200 μL of complete culture medium at a final concentration of 1.104 cells per well for resazurin assay.
4.5.3. Treatment of HepG2 Cells
The HepG2 cells were grown at 37 °C for 24 h and then exposed to varying concentrations of Fe3O4–LDOPA–PEG–MANOTA NPs between 2.34 and 300 μg mL–1. The cytotoxicity was checked at 24 h.
4.5.4. Resazurin Assay
The cell viability was assessed using resazurin assay. This dye is taken up in cells by passive diffusion and reduced in mitochondria. Continued growth maintains a reduced environment and causes the redox indicator to change from oxidized form (Resazurin: non-fluorescent, blue) to reduced form (Resorufin: fluorescent, red). HepG2 cells were seeded into 96-well plate (Dutscher, France) in 200 μL of complete culture medium with 10% FBS at a final concentration of 1.104 cells per well. Twenty-four hours after seeding, the medium was removed and the cells were exposed to Fe3O4–LDOPA–PEG–MANOTA NPs in complete medium with 0.5% of FBS. The plates were then returned to incubator for 24 h. Medium was removed and replaced with 100 μL resazurin per well and dissolved in MEM 1× without phenol red, yielding a final concentration of 100 μg mL–1. Plates were then placed in the incubator for 3 h and the fluorescence was recorded on a plate reader (Chameleon IV, ScienceTech) (excitation 544 nm, emission 590 nm). The value of the wells containing only MEM and nanoparticles were subtracted from the raw data to take into account the natural fluorescence of Fe3O4–LDOPA–PEG–MANOTA. Viability was expressed as %, calculated from fluorescence value emitted by treated cells compared to control (medium or vehicle only), and fixed at 100%. Mean and standard deviations were generated from three independent experiments. The comparison of means was made between different concentrations tested and negative control. Various statistical tests were performed with the GraphPadPrism software. Intergroup comparisons were performed using analysis of variance (ANOVA) followed by Dunnett’s test (p < 0.05).
4.6. In Vivo Studies
In the first set of experiments, four mice were intravenously injected with 2.5–3 MBq of Fe3O4–LDOPA–PEG–MANOTA–64Cu NPs under isoflurane anesthesia. One mouse was imaged by PET-CT at 1 and 24 h after injection. Three other mice were used for blood sampling (one drop harvested at the lateral tail vein, i.e., 20 μL samples) at 5 min, 10 min, 30 min, 1 h, 2 h, and 4 h postinjection times for γ-counting and evaluation of circulating Fe3O4–LDOPA–PEG–MANOTA–64Cu NPs levels. At 48 h postinjection time, the four mice were euthanized and organs collected for γ-counting and biodistribution quantification.
In the second set of experiments, after MRI baseline imaging, three mice were intravenously injected with 5–8 MBq of Fe3O4–LDOPA–PEG–MANOTA–64Cu NPs under isoflurane anesthesia. The three mice were imaged by PET-MRI at 1 and 24 h postinjection. At 48 h postinjection, the three mice were euthanized and organs collected for γ-counting and biodistribution quantification.
Acknowledgments
The authors would like to thank Dr. Lucien Saviot for his help in Raman spectroscopy investigations, Dr. Olivier Heintz for XPS analysis, and Dr. Rémi Chassagnon for TEM images.
Supporting Information Available
The Supporting Information is available free of charge on the ACS Publications website at DOI: 10.1021/acsomega.8b03283.
TGA recorded on Fe3O4–LDOPA, Fe3O4–LDOPA–PEG, and Fe3O4–LDOPA–PEG–MANOTA NPs; theoretical calculation for functionalized-SPIONs rate of grafting; calibration curve of magnetic susceptibility measurements as a function of iron concentration; measurements carried out with SPIONs–LDOPA in water; biodistribution of SPIONs in several organs 1 and 24 h after iv injection; measurements performed using magnetic susceptibility method (PDF)
Author Present Address
# (G.T.) NS3E-ISL-CNRS (Nanomatériaux pour les Systèmes Sous Sollicitations Extrèmes) UMR 3208 French–German Research Institute of Saint-Louis, 68300 Saint-Louis, France.
This work was performed within Pharm’Image, a regional center of excellence in Pharmacoimaging. Support was provided by the French Government through the French National Research Agency (ANR) under the program “Investissements d’Avenir” (ANR-10-EQPX-05-01/IMAPPI Equipex) and the CNRS, the “Université de Bourgogne” and the “Conseil Régional de Bourgogne” through the 3 MIM integrated project (“Marquage de Molécules par les Métaux pour l’Imagerie Médicale”). This work is also part of the project “Pharmacoimagerie et agents théranostiques”, funded by the “Université de Bourgogne” and the “Conseil Régional de Bourgogne” through the “Plan d’Actions Régional pour l’Innovation (PARI)” and the European Union through the PO FEDER-FSE Bourgogne 2014/2020 programs.
The authors declare no competing financial interest.
Supplementary Material
References
- Wang Y. X.; Hussain S. M.; Krestin G. P. Superparamagnetic Iron Oxide Contrast Agents: Physicochemical Characteristics and Applications in MR Imaging. Eur. Radiol. 2001, 11, 2319–2331. 10.1007/s003300100908. [DOI] [PubMed] [Google Scholar]
- Zhang L.; Dong W.-F.; Sun H.-B. Multifunctional Superparamagnetic Iron Oxide Nanoparticles: Design, Synthesis and Biomedical Photonic Applications. Nanoscale 2013, 5, 7664–7684. 10.1039/c3nr01616a. [DOI] [PubMed] [Google Scholar]
- Nigam S.; Barick K. C.; Bahadur D. Development of Citrate-Stabilized Fe3O4 Nanoparticles: Conjugation and Release of Doxorubicin for Therapeutic Applications. J. Magn. Magn. Mater. 2011, 323, 237–243. 10.1016/j.jmmm.2010.09.009. [DOI] [Google Scholar]
- Gao J.; Gu H.; Xu B. Multifunctional Magnetic Nanoparticles: Design, Synthesis, and Biomedical Applications. Acc. Chem. Res. 2009, 42, 1097–1107. 10.1021/ar9000026. [DOI] [PubMed] [Google Scholar]
- Shah N. J.; Oros-Peusquens A.-M.; Arrubla J.; Zhang K.; Warbrick T.; Mauler J.; Vahedipour K.; Romanzetti S.; Felder J.; Celik A.; et al. Advances in Multimodal Neuroimaging: Hybrid MR-PET and MR-PET-EEG at 3 T and 9.4 T. J. Magn. Reson. 2013, 229, 101–115. 10.1016/j.jmr.2012.11.027. [DOI] [PubMed] [Google Scholar]
- Patel D.; Kell A.; Simard B.; Xiang B.; Lin H. Y.; Tian G. The Cell Labeling Efficacy, Cytotoxicity and Relaxivity of Copper-Activated MRI/PET Imaging Contrast Agents. Biomaterials 2011, 32, 1167–1176. 10.1016/j.biomaterials.2010.10.013. [DOI] [PubMed] [Google Scholar]
- Lee D.-E.; Koo H.; Sun I.-C.; Ryu J. H.; Kim K.; Kwon I. C. Multifunctional Nanoparticles for Multimodal Imaging and Theragnosis. Chem. Soc. Rev. 2012, 41, 2656–2672. 10.1039/C2CS15261D. [DOI] [PubMed] [Google Scholar]
- de Rosales R. T. M. Potential Clinical Applications of Bimodal PET-MRI or SPECT-MRI Agents. J. Labelled Compd. Radiopharm. 2014, 57, 298–303. 10.1002/jlcr.3154. [DOI] [PMC free article] [PubMed] [Google Scholar]
- Thomas R.; Park I.-K.; Jeong Y. Y. Magnetic Iron Oxide Nanoparticles for Multimodal Imaging and Therapy of Cancer. Int. J. Mol. Sci. 2013, 14, 15910–15930. 10.3390/ijms140815910. [DOI] [PMC free article] [PubMed] [Google Scholar]
- Huang W.-Y.; Davis J. J. Multimodality and Nanoparticles in Medical Imaging. Dalton Trans. 2011, 40, 6087–6103. 10.1039/c0dt01656j. [DOI] [PMC free article] [PubMed] [Google Scholar]
- Yang F.; Li Y.; Chen Z.; Zhang Y.; Wu J.; Gu N. Superparamagnetic Iron Oxide Nanoparticle-Embedded Encapsulated Microbubbles as Dual Contrast Agents of Magnetic Resonance and Ultrasound Imaging. Biomaterials 2009, 30, 3882–3890. 10.1016/j.biomaterials.2009.03.051. [DOI] [PubMed] [Google Scholar]
- Carril M.; Fernández I.; Rodríguez J.; García I.; Penadés S. Gold-Coated Iron Oxide Glyconanoparticles for MRI, CT, and US Multimodal Imaging. Part. Part. Syst. Charact. 2014, 31, 81–87. 10.1002/ppsc.201300239. [DOI] [Google Scholar]
- Xie J.; Chen K.; Huang J.; Lee S.; Wang J.; Gao J.; Li X.; Chen X. PET/NIRF/MRI Triple Functional Iron Oxide Nanoparticles. Biomaterials 2010, 31, 3016–3022. 10.1016/j.biomaterials.2010.01.010. [DOI] [PMC free article] [PubMed] [Google Scholar]
- Cheraghipour E.; Tamaddon A. M.; Javadpour S.; Bruce I. J. PEG Conjugated Citrate-Capped Magnetite Nanoparticles for Biomedical Applications. J. Magn. Magn. Mater. 2013, 328, 91–95. 10.1016/j.jmmm.2012.09.042. [DOI] [Google Scholar]
- Liu Y.; Li Y.; Li X.-M.; He T. Kinetics of (3-Aminopropyl)Triethoxylsilane (APTES) Silanization of Superparamagnetic Iron Oxide Nanoparticles. Langmuir 2013, 29, 15275–15282. 10.1021/la403269u. [DOI] [PubMed] [Google Scholar]
- Maurizi L.; Papa A.-L.; Dumont L.; Bouyer F.; Walker P.; Vandroux D.; Millot N. Influence of Surface Charge and Polymer Coating on Internalization and Biodistribution of Polyethylene Glycol-Modified Iron Oxide Nanoparticles. J. Biomed. Nanotechnol. 2015, 11, 126–136. 10.1166/jbn.2015.1996. [DOI] [PubMed] [Google Scholar]
- Chung H. J.; Lee H.; Bae K. H.; Lee Y.; Park J.; Cho S.-W.; Hwang J. Y.; Park H.; Langer R.; Anderson D.; et al. Facile Synthetic Route for Surface-Functionalized Magnetic Nanoparticles: Cell Labeling and Magnetic Resonance Imaging Studies. ACS Nano 2011, 5, 4329–4336. 10.1021/nn201198f. [DOI] [PMC free article] [PubMed] [Google Scholar]
- Na H. B.; Palui G.; Rosenberg J. T.; Ji X.; Grant S. C.; Mattoussi H. Multidentate Catechol-Based Polyethylene Glycol Oligomers Provide Enhanced Stability and Biocompatibility to Iron Oxide Nanoparticles. ACS Nano 2012, 6, 389–399. 10.1021/nn203735b. [DOI] [PubMed] [Google Scholar]
- Lee H.; Yu M. K.; Park S.; Moon S.; Min J. J.; Jeong Y. Y.; Kang H.-W.; Jon S. Thermally Cross-Linked Superparamagnetic Iron Oxide Nanoparticles: Synthesis and Application as a Dual Imaging Probe for Cancer in Vivo. J. Am. Chem. Soc. 2007, 129, 12739–12745. 10.1021/ja072210i. [DOI] [PubMed] [Google Scholar]
- Panja S.; Saha B.; Ghosh S. K.; Chattopadhyay S. Synthesis of Novel Four Armed PE-PCL Grafted Superparamagnetic and Biocompatible Nanoparticles. Langmuir 2013, 29, 12530–12540. 10.1021/la401811c. [DOI] [PubMed] [Google Scholar]
- Sandiford L.; Phinikaridou A.; Protti A.; Meszaros L. K.; Cui X.; Yan Y.; Frodsham G.; Williamson P. A.; Gaddum N.; Botnar R. M.; et al. Bisphosphonate-Anchored PEGylation and Radiolabeling of Superparamagnetic Iron Oxide: Long-Circulating Nanoparticles for in Vivo Multimodal (T1 MRI-SPECT) Imaging. ACS Nano 2013, 7, 500–512. 10.1021/nn3046055. [DOI] [PMC free article] [PubMed] [Google Scholar]
- Bae K. H.; Kim Y. B.; Lee Y.; Hwang J.; Park H.; Park T. G. Bioinspired Synthesis and Characterization of Gadolinium-Labeled Magnetite Nanoparticles for Dual Contrast T1- and T2-Weighted Magnetic Resonance Imaging. Bioconjugate Chem. 2010, 21, 505–512. 10.1021/bc900424u. [DOI] [PubMed] [Google Scholar]
- Bae K. H.; Park M.; Do M. J.; Lee N.; Ryu J. H.; Kim G. W.; Kim C.; Park T. G.; Hyeon T. Chitosan Oligosaccharide-Stabilized Ferrimagnetic Iron Oxide Nanocubes for Magnetically Modulated Cancer Hyperthermia. ACS Nano 2012, 6, 5266–5273. 10.1021/nn301046w. [DOI] [PubMed] [Google Scholar]
- Lee N.; Hummer D. R.; Sverjensky D. A.; Rajh T.; Hazen R. M.; Steele A.; Cody G. D. Speciation of L-DOPA on Nanorutile as a Function of pH and Surface Coverage Using Surface-Enhanced Raman Spectroscopy (SERS). Langmuir 2012, 28, 17322–17330. 10.1021/la303607a. [DOI] [PubMed] [Google Scholar]
- Amstad E.; Gillich T.; Bilecka I.; Textor M.; Reimhult E. Ultrastable Iron Oxide Nanoparticle Colloidal Suspensions Using Dispersants with Catechol-Derived Anchor Groups. Nano Lett. 2009, 9, 4042–4048. 10.1021/nl902212q. [DOI] [PubMed] [Google Scholar]
- Zirbs R.; Lassenberger A.; Vonderhaid I.; Kurzhals S.; Reimhult E. Melt-Grafting for the Synthesis of Core-Shell Nanoparticles with Ultra-High Dispersant Density. Nanoscale 2015, 7, 11216–11225. 10.1039/C5NR02313K. [DOI] [PubMed] [Google Scholar]
- Xie J.; Xu C.; Kohler N.; Hou Y.; Sun S. Controlled PEGylation of Monodisperse Fe3O4 Nanoparticles for Reduced Non-Specific Uptake by Macrophage Cells. Adv. Mater. 2007, 19, 3163–3166. 10.1002/adma.200701975. [DOI] [Google Scholar]
- Xie J.; Xu C. J.; Xu Z. H.; Hou Y. L.; Young K. L. L.; Wang S. X.; Pourmand N.; Sun S. H. Linking Hydrophilic Macromolecules to Monodisperse Magnetite (Fe3O4) Nanoparticles via Trichloro-s-Triazine (Vol 18, Pg 5401, 2006). Chem. Mater. 2007, 19, 1202. 10.1021/cm079997w. [DOI] [PMC free article] [PubMed] [Google Scholar]
- Yuen A. K. L.; Hutton G. A.; Masters A. F.; Maschmeyer T. The Interplay of Catechol Ligands with Nanoparticulate Iron Oxides. Dalton Trans. 2012, 41, 2545–2559. 10.1039/c2dt11864e. [DOI] [PubMed] [Google Scholar]
- Price E. W.; Orvig C. Matching Chelators to Radiometals for Radiopharmaceuticals. Chem. Soc. Rev. 2014, 43, 260–290. 10.1039/C3CS60304K. [DOI] [PubMed] [Google Scholar]
- Torres Martin de Rosales R.; Tavaré R.; Paul R. L.; Jauregui-Osoro M.; Protti A.; Glaria A.; Varma G.; Szanda I.; Blower P. J. Synthesis of 64CuII–Bis(Dithiocarbamatebisphosphonate) and Its Conjugation with Superparamagnetic Iron Oxide Nanoparticles: In Vivo Evaluation as Dual-Modality PET–MRI Agent. Angew. Chem., Int. Ed. 2011, 50, 5509–5513. 10.1002/anie.201007894. [DOI] [PMC free article] [PubMed] [Google Scholar]
- Torres Martin de Rosales R.; Tavaré R.; Glaria A.; Varma G.; Protti A.; Blower P. J. 99mTc-Bisphosphonate-Iron Oxide Nanoparticle Conjugates for Dual-Modality Biomedical Imaging. Bioconjugate Chem. 2011, 22, 455–465. 10.1021/bc100483k. [DOI] [PMC free article] [PubMed] [Google Scholar]
- Yang X.; Hong H.; Grailer J. J.; Rowland I. J.; Javadi A.; Hurley S. A.; Xiao Y.; Yang Y.; Zhang Y.; Nickles R. J.; et al. CRGD-Functionalized, DOX-Conjugated, and 64Cu-Labeled Superparamagnetic Iron Oxide Nanoparticles for Targeted Anticancer Drug Delivery and PET/MR Imaging. Biomaterials 2011, 32, 4151–4160. 10.1016/j.biomaterials.2011.02.006. [DOI] [PMC free article] [PubMed] [Google Scholar]
- Lee H.-Y.; Li Z.; Chen K.; Hsu A. R.; Xu C.; Xie J.; Sun S.; Chen X. PET/MRI Dual-Modality Tumor Imaging Using Arginine-Glycine-Aspartic (RGD)-Conjugated Radiolabeled Iron Oxide Nanoparticles. J. Nucl. Med. 2008, 49, 1371–1379. 10.2967/jnumed.108.051243. [DOI] [PubMed] [Google Scholar]
- Pham T. N.; Lengkeek N. A.; Greguric I.; Kim B. J.; Pellegrini P. A.; Bickley S. A.; Tanudji M. R.; Jones S. K.; Hawkett B. S.; Pham B. T. Tunable and Noncytotoxic PET/SPECT-MRI Multimodality Imaging Probes Using Colloidally Stable Ligand-Free Superparamagnetic Iron Oxide Nanoparticles. Int. J. Nanomed. 2017, 12, 899–909. 10.2147/IJN.S127171. [DOI] [PMC free article] [PubMed] [Google Scholar]
- Nosrati S.; Shanehsazzadeh S.; Yousefnia H.; Gholami A.; Grüttner C.; Jalilian A. R.; Hosseini R. H.; Lahooti A. Biodistribution Evaluation of 166Ho–DTPA–SPION in Normal Rats. J. Radioanal. Nucl. Chem. 2016, 307, 1559–1566. 10.1007/s10967-015-4251-x. [DOI] [Google Scholar]
- Wang H.; Li D.; Liu S.; Liu R.; Yuan H.; Krasnoperov V.; Shan H.; Conti P. S.; Gill P. S.; Li Z. Small-Animal PET Imaging of Pancreatic Cancer Xenografts Using a 64Cu-Labeled Monoclonal Antibody, MAb159. J. Nucl. Med. 2015, 56, 908–913. 10.2967/jnumed.115.155812. [DOI] [PMC free article] [PubMed] [Google Scholar]
- Boswell C. A.; Sun X.; Niu W.; Weisman G. R.; Wong E. H.; Rheingold A. L.; Anderson C. J. Comparative in Vivo Stability of Copper-64-Labeled Cross-Bridged and Conventional Tetraazamacrocyclic Complexes. J. Med. Chem. 2004, 47, 1465–1474. 10.1021/jm030383m. [DOI] [PubMed] [Google Scholar]
- Chen K.; Sun X.; Niu G.; Ma Y.; Yap L.-P.; Hui X.; Wu K.; Fan D.; Conti P. S.; Chen X. Evaluation of 64Cu Labeled GX1: A Phage Display Peptide Probe for PET Imaging of Tumor Vasculature. Mol. Imaging Biol. 2012, 14, 96–105. 10.1007/s11307-011-0479-1. [DOI] [PMC free article] [PubMed] [Google Scholar]
- Dumont R. A.; Deininger F.; Haubner R.; Maecke H. R.; Weber W. A.; Fani M. Novel (64)Cu- and (68)Ga-Labeled RGD Conjugates Show Improved PET Imaging of ανβ3 Integrin Expression and Facile Radiosynthesis. J. Nucl. Med. 2011, 52, 1276–1284. 10.2967/jnumed.111.087700. [DOI] [PubMed] [Google Scholar]
- Oxboel J.; Schjoeth-Eskesen C.; El-Ali H. H.; Madsen J.; Kjaer A. 64Cu-NODAGA-c(RGDyK) Is a Promising New Angiogenesis PET Tracer: Correlation between Tumor Uptake and Integrin ανβ3 Expression in Human Neuroendocrine Tumor Xenografts. Int. J. Mol. Imaging 2012, 2012, 1–11. 10.1155/2012/379807. [DOI] [PMC free article] [PubMed] [Google Scholar]
- Désogère P.; Rousselin Y.; Poty S.; Bernhard C.; Goze C.; Boschetti F.; Denat F. Efficient Synthesis of 1,4,7-Triazacyclononane and 1,4,7-Triazacyclononane-Based Bifunctional Chelators for Bioconjugation. Eur. J. Org. Chem. 2014, 2014, 7831–7838. 10.1002/ejoc.201402708. [DOI] [Google Scholar]
- Moreau M.; Poty S.; Vrigneaud J.-M.; Walker P.; Guillemin M.; Raguin O.; Oudot A.; Bernhard C.; Goze C.; Boschetti F.; et al. MANOTA: A Promising Bifunctional Chelating Agent for Copper-64 ImmunoPET. Dalton Trans. 2017, 46, 14659–14668. 10.1039/C7DT01772C. [DOI] [PubMed] [Google Scholar]
- Roosenburg S.; Laverman P.; Joosten L.; Cooper M. S.; Kolenc-Peitl P. K.; Foster J. M.; Hudson C.; Leyton J.; Burnet J.; Oyen W. J. G.; et al. PET and SPECT Imaging of a Radiolabeled Minigastrin Analogue Conjugated with DOTA, NOTA, and NODAGA and Labeled with 64Cu, 68Ga, and 111In. Mol. Pharm. 2014, 11, 3930–3937. 10.1021/mp500283k. [DOI] [PubMed] [Google Scholar]
- Hausner S. H.; Kukis D. L.; Gagnon M. K. J.; Stanecki C. E.; Ferdani R.; Marshall J. F.; Anderson C. J.; Sutcliffe J. L. Evaluation of [64Cu]Cu-DOTA and [64Cu]Cu-CB-TE2A Chelates for Targeted Positron Emission Tomography with an ανβ6-Specific Peptide. Mol. Imaging 2009, 8, 111–121. 10.2310/7290.2009.00015. [DOI] [PMC free article] [PubMed] [Google Scholar]
- Millot N.; Begin-Colin S.; Perriat P.; Le Caër G. Structure, Cation Distribution, and Properties of Nanocrystalline Titanomagnetites Obtained by Mechanosynthesis: Comparison with Soft Chemistry. J. Solid State Chem. 1998, 139, 66–78. 10.1006/jssc.1998.7808. [DOI] [Google Scholar]
- Maurizi L.; Bouyer F.; Paris J.; Demoisson F.; Saviot L.; Millot N. One Step Continuous Hydrothermal Synthesis of Very Fine Stabilized Superparamagnetic Nanoparticles of Magnetite. Chem. Commun. 2011, 47, 11706–11708. 10.1039/c1cc15470b. [DOI] [PubMed] [Google Scholar]
- Shebanova O. N.; Lazor P. Raman Spectroscopic Study of Magnetite (FeFe2O4): A New Assignment for the Vibrational Spectrum. J. Solid State Chem. 2003, 174, 424–430. 10.1016/S0022-4596(03)00294-9. [DOI] [Google Scholar]
- Thomas G.; Demoisson F.; Heintz O.; Geoffroy N.; Saviot L.; Millot N. Functionalized Fe3O4 Nanoparticles: Influence of Ligand Addition Sequence and pH during Their Continuous Hydrothermal Synthesis. RSC Adv. 2015, 5, 78614–78624. 10.1039/C5RA17452J. [DOI] [Google Scholar]
- Thomas G.; Demoisson F.; Chassagnon R.; Popova E.; Millot N. One-Step Continuous Synthesis of Functionalized Magnetite Nanoflowers. Nanotechnology 2016, 27, 135604 10.1088/0957-4484/27/13/135604. [DOI] [PubMed] [Google Scholar]
- Gulley-Stahl H.; Hogan P. A.; Schmidt W. L.; Wall S. J.; Buhrlage A.; Bullen H. A. Surface Complexation of Catechol to Metal Oxides: An ATR-FTIR, Adsorption, and Dissolution Study. Environ. Sci. Technol. 2010, 44, 4116–4121. 10.1021/es902040u. [DOI] [PubMed] [Google Scholar]
- Socrates G.Infrared and Raman Characteristic Group Frequencies: Tables and Charts, 3rd ed.; Wiley: Chichester, 2010. [Google Scholar]
- Perriat P.; Fries E.; Millot N.; Domenichini B. XPS and EELS Investigations of Chemical Homogeneity in Nanometer Scaled Ti-Ferrites Obtained by Soft Chemistry. Solid State Ionics 1999, 117, 175–184. 10.1016/S0167-2738(98)00262-8. [DOI] [Google Scholar]
- Jasmin J.-P.; Ouhenia-Ouadahi K.; Miserque F.; Dumas E.; Cannizzo C.; Chaussé A. Straightforward Grafting Approach for Cyclam-Functionalized Screen-Printed Electrodes for Selective Cu(II) Determination. Electrochim. Acta 2016, 200, 115–122. 10.1016/j.electacta.2016.03.141. [DOI] [Google Scholar]
- Wang D. K.; Varanasi S.; Fredericks P. M.; Hill D. J. T.; Symons A. L.; Whittaker A. K.; Rasoul F. FT-IR Characterization and Hydrolysis of PLA-PEG-PLA Based Copolyester Hydrogels with Short PLA Segments and a Cytocompatibility Study. J. Polym. Sci., Part A: Polym. Chem. 2013, 51, 5163–5176. 10.1002/pola.26930. [DOI] [Google Scholar]
- Coates J.Interpretation of Infrared Spectra, A Practical Approach. In Encyclopedia of Analytical Chemistry; American Cancer Society, 2006. [Google Scholar]
- Kobayashi H.; Watanabe R.; Choyke P. L. Improving Conventional Enhanced Permeability and Retention (EPR) Effects; What Is the Appropriate Target?. Theranostics 2013, 4, 81–89. 10.7150/thno.7193. [DOI] [PMC free article] [PubMed] [Google Scholar]
- Bahadar H.; Maqbool F.; Niaz K.; Abdollahi M. Toxicity of Nanoparticles and an Overview of Current Experimental Models. Iran. Biomed. J. 2016, 20, 1–11. 10.7508/ibj.2016.01.001. [DOI] [PMC free article] [PubMed] [Google Scholar]
- Sruthi S.; Maurizi L.; Nury T.; Sallem F.; Boudon J.; Riedinger J. M.; Millot N.; Bouyer F.; Lizard G. Cellular Interactions of Functionalized Superparamagnetic Iron Oxide Nanoparticles on Oligodendrocytes without Detrimental Side Effects: Cell Death Induction, Oxidative Stress and Inflammation. Colloids Surf., B 2018, 170, 454–462. 10.1016/j.colsurfb.2018.06.041. [DOI] [PubMed] [Google Scholar]
- Glaus C.; Rossin R.; Welch M. J.; Bao G. In Vivo Evaluation of 64Cu-Labeled Magnetic Nanoparticles as a Dual-Modality PET/MR Imaging Agent. Bioconjugate Chem. 2010, 21, 715–722. 10.1021/bc900511j. [DOI] [PMC free article] [PubMed] [Google Scholar]
- Alexis F.; Pridgen E.; Molnar L. K.; Farokhzad O. C. Factors Affecting the Clearance and Biodistribution of Polymeric Nanoparticles. Mol. Pharm. 2008, 5, 505–515. 10.1021/mp800051m. [DOI] [PMC free article] [PubMed] [Google Scholar]
- Ho A. K.; Girgis S.; Low G. Uncommon Liver Lesions with Multimodality Imaging and Pathology Correlation. Clin. Radiol. 2018, 73, 191–204. 10.1016/j.crad.2017.07.016. [DOI] [PubMed] [Google Scholar]
- Bächler P.; Baladron M. J.; Menias C.; Beddings I.; Loch R.; Zalaquett E.; Vargas M.; Connolly S.; Bhalla S.; Huete Á. Multimodality Imaging of Liver Infections: Differential Diagnosis and Potential Pitfalls. RadioGraphics 2016, 36, 1001–1023. 10.1148/rg.2016150196. [DOI] [PubMed] [Google Scholar]
- Bass L. A.; Wang M.; Welch M. J.; Anderson C. J. In Vivo Transchelation of Copper-64 from TETA-Octreotide to Superoxide Dismutase in Rat Liver. Bioconjugate Chem. 2000, 11, 527–532. 10.1021/bc990167l. [DOI] [PubMed] [Google Scholar]
- Langford J. I.National Institute of Standards and Technology Special Publication 846, 1992; p 145.
- Papa A.-L.; Maurizi L.; Vandroux D.; Walker P.; Millot N. Synthesis of Titanate Nanotubes Directly Coated with USPIO in Hydrothermal Conditions: A New Detectable Nanocarrier. J. Phys. Chem. C 2011, 115, 19012–19017. 10.1021/jp2056893. [DOI] [Google Scholar]
- Maurizi L.; Sakulkhu U.; Gramoun A.; Vallee J.-P.; Hofmann H. A Fast and Reproducible Method to Quantify Magnetic Nanoparticle Biodistribution. Analyst 2014, 139, 1184–1191. 10.1039/C3AN02153J. [DOI] [PubMed] [Google Scholar]
Associated Data
This section collects any data citations, data availability statements, or supplementary materials included in this article.


