Abstract
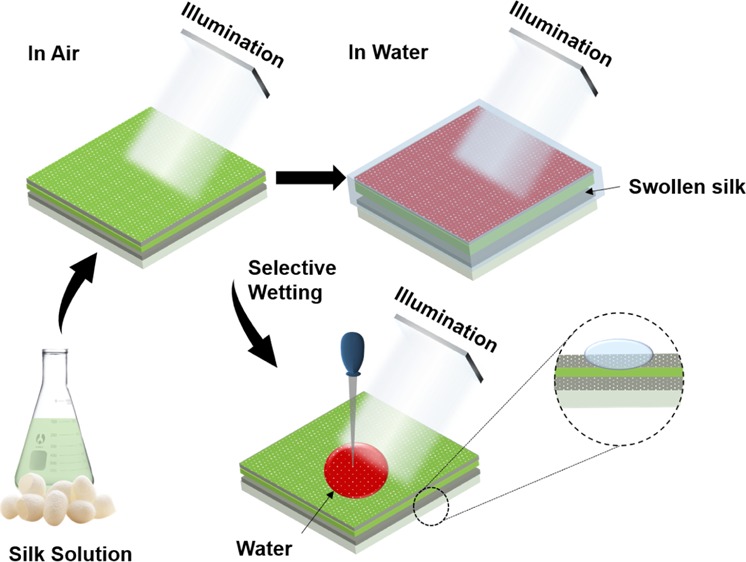
Planar and lithography-free metal–insulator–metal (MIM) resonators based on the Fabry–Pérot etalon are attractive for biochemical sensing applications because of their acceptable optical performance and cost-effectiveness. However, injecting analytes into the insulating layer where the optical field is localized (high light–matter interaction) is difficult. Here, planar and lithography-free MIM resonators interacting with their environment are reported. In the MIM, molecules of a liquid can infiltrate the inherent nanopores in the deposited silver nanomembrane and be absorbed into the silk protein hydrogel membrane. The silk layer is swollen when water molecules are absorbed, inducing a large shift in the resonance wavelength. Thus, in this study, the proposed MIM resonator was applied as a highly sensitive water sensor, and a water content as low as 0.008% in organic solvents could be determined by reading the shift in the transmission peak. This limit can be lowered further by using a high-resolution spectrometer and a thicker silk layer. In addition, the area of interaction can be artificially selected by applying an elastomer stamp and a patterned photoresist window.
Introduction
Fabry–Pérot (FP) optical cavities are widely used in optoelectronic devices such as filters, coating, and spectrometers.1−3 The FP cavity can be easily formed by using two highly reflective metallic films sandwiching a lossless dielectric layer having at least a quarter-wavelength thickness; this construction is a so-called metal–insulator–metal (MIM) resonator.4,5 Although the ultrathin metallic layers are optically slightly lossy, strong light localization can be induced inside the dielectric layer, and this results in efficient color filtering and absorption.6−8 Recently, the study of planar and lithography-free MIM resonators has been revived because of their advantages, including cost-effective fabrication and optical performance comparable to those of other complicated optical resonators.6,9,10 The advantages of planar and lithography-free MIM resonators make them particularly suitable for chemical and biological sensing applications.4,5,11,12 However, in a conventional MIM resonator, it is hard for analytes to exert an influence on the optical mode because the resonators are composed of rigid materials, and there is no way for the analytes to be absorbed into the dielectric layer where the optical field is strongly localized.6 Therefore, the use of a soft dielectric layer that can absorb the analytes, as well as mirror layers with channels for analyte penetration, is necessary.
Mechanical stability, optical transparency, and biocompatibility are traits of silk protein that make it an attractive material for use in bio- and nano-optical devices.13−17 The good optical properties of silk protein make it more desirable than conventional dielectric materials for engineering biocompatible optical devices.18,19 Thus, many silk-based optical structures have been actively used to obtain reflectors, lasers, and color filters.4,17,20,21 In addition, composites of noble metals and silk nanostructures impart biocompatibility and a strong optical response.4,22−24 Facile intermolecular cross-linking by water vapor or organic solvent treatment creates nanochannels in the hydrogel, and these nanochannels facilitate the detection and quantification of the analytes in aqueous solutions.4,22−24 Furthermore, the hydratable silk hydrogel allows the interaction of the photonic device with various body fluids in vivo, making these devices ideal candidates for epidermal and human-implantable applications.25 The properties of silk make it suitable as the dielectric layer in MIM-based sensors for translating the chemical signal to the optical resonance depending on the operating environment.5
The detection of traces of water in organic solvents is critical in the pharmaceutical, biological, and chemical industries, especially in organic synthesis, because water traces can impede the production of chemicals and drugs and, in organic solvents, can directly lead to the failure of organic reactions.26−28 Widely used water detection methods include Karl Fischer titration29 and chromatography,30 but these are expensive and require specialized instruments, as well as being time-consuming. In contrast, optical devices are adaptable water sensors for use in biological and chemical environments because of their high sensitivity and the possibility for wireless measurement.31−34 Many spectrometric sensors using fluorescence, reflectance, and attenuation have been demonstrated using photonic crystals,35 metal–organic frameworks,36 fluorescence probes,37 infrared absorbing dyes,38 fiber-optic Bragg gratings,39 and fiber lasers.40 However, these optical techniques are either complicated to use or not compatible with the biological environment. As far as chemical sensing in the biological environment is concerned, the dimensions and biocompatible traits of the optical device are crucial factors.
Here, we report an ultrathin, planar, and lithography-free MIM color filter that can interact with the aqueous environment through the inherent nanopores in the ultrathin metallic layer. The MIM color filter was fabricated by sandwiching a silk hydrogel layer between two planar 30 nm-thick silver (Ag) nanomembranes. The resonance wavelength can be adjusted by varying the thickness of the intermediate silk layer. In an aqueous environment, water molecules infiltrate the Ag layer and swell the silk hydrogel layer, resulting in a huge red shift in the resonance wavelength. The thickness of the top Ag nanomembrane is highly related to the infiltration time of the solvent molecules and the quality (Q) factor of the FP cavity. We applied our interactive MIM resonator for the detection of minute amounts of water in organic solvents, such as acetone and isopropyl alcohol (IPA). The minimum water concentration that induced the 0.36 nm shift (the resolution limit of the spectrometer) was 0.04% in acetone and 0.008% in IPA, comparable to the most sensitive water sensors. The experimental results also show that the sensitivity of the proposed water sensor can be significantly improved when a high-resolution spectrometer and a thicker silk layer are applied. Because liquids penetrate the metallic layer of the planar MIM structure, we can choose any spot on the sensor to induce the color change, and color changes by selective wetting were observed using a wet or solvent-filled polydimethylsiloxane (PDMS) stamp. In addition, the patterned MIM resonator was obtained by selective cross-linking. The MIM with a planar and ultrathin silk hydrogel and Ag layers is an intuitive, cost-effective, and highly sensitive biochemical sensor that can interact with its environment.
Results and Discussion
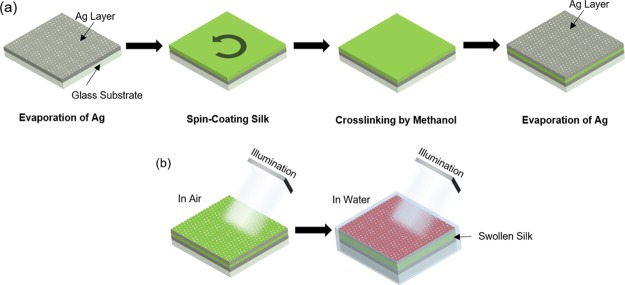
MIM resonators were fabricated on a glass substrate with an interfacial layer of silk protein between two 30 nm-thick Ag layers (Figure 1a). To induce cross-linking between the silk molecules, the silk layer was treated with methanol. The cross-linked silk film became a hydrogel and could swell when water molecules were absorbed.41 The Ag layers were deposited by an electron beam evaporation system, and it is well-known that there are inherent nanopores in deposited noble metal layers having thicknesses of less than 50 nm.42 Therefore, when the MIM resonator was immersed in an aqueous solution, water and other small molecules could be absorbed into the silk layer through the thin Ag layer. This caused the refractive index (RI) of the hydrogel to be reduced and the thickness to be increased. Although the reduced RI resulted in the blue shift of the resonant wavelength, the red shift caused by the increased distance between two Ag mirrors dominated the change of the resonance, resulting in a huge red shift (Figures 1b and S1).
Figure 1.
Fabrication and working principle. (a) Schematic images showing the fabrication of the MIM resonator with nanoporous Ag layers. (b) Images of the MIM structure in air (dried) and water with the swollen silk spacer under white light irradiation.
By controlling the thickness of the silk layer, the MIM resonator could be utilized as a color filter. Finite-difference time domain (FDTD) simulations were used to find the thickness of the silk layer (tsilk) for the color filtering. The chosen thicknesses of the silk layer to exhibit color filtering in the blue, green, and red regions were 90, 120, and 150 nm, respectively. With the increase of tsilk, the resonance wavelength was red-shifted. Figure 2a shows the simulated and measured transmission spectra of the designed and fabricated MIM resonators in air. The experimental results showed spectral peaks at 470.1 (blue), 552.4 (green), and 637.3 nm (red) in the transmission spectra. The small incongruity between the measured and calculated spectra resulted from fabrication tolerances. In water, the intermediate silk layers absorbed water molecules and showed resonance wavelengths red-shifted to 670.9, 764.1, and 865.9 nm (Figure 2b). Our previous study indicated that the RI of the silk hydrogel was 1.43,17 and the FDTD simulations revealed that the tsilk values of the swollen silk hydrogel layers were expanded to around 165, 185, and 250 nm from 90, 120, and 150 nm, respectively. Additionally, for the 250 nm-thick MIM (in water), the second-order resonance mode came within the detection range of the spectrometer. The Q factor, which is defined as Q = λpeak/Δλfwhm, was ca. 16, where Δλfwhm is the full width at half-maximum (fwhm) of the resonance and λpeak is the resonance wavelength. The acceptable Q factor and the red shift over 200 nm in the wavelength indicate that the demonstrated MIM is useful for a remarkable sensor for use in an aqueous medium.
Figure 2.
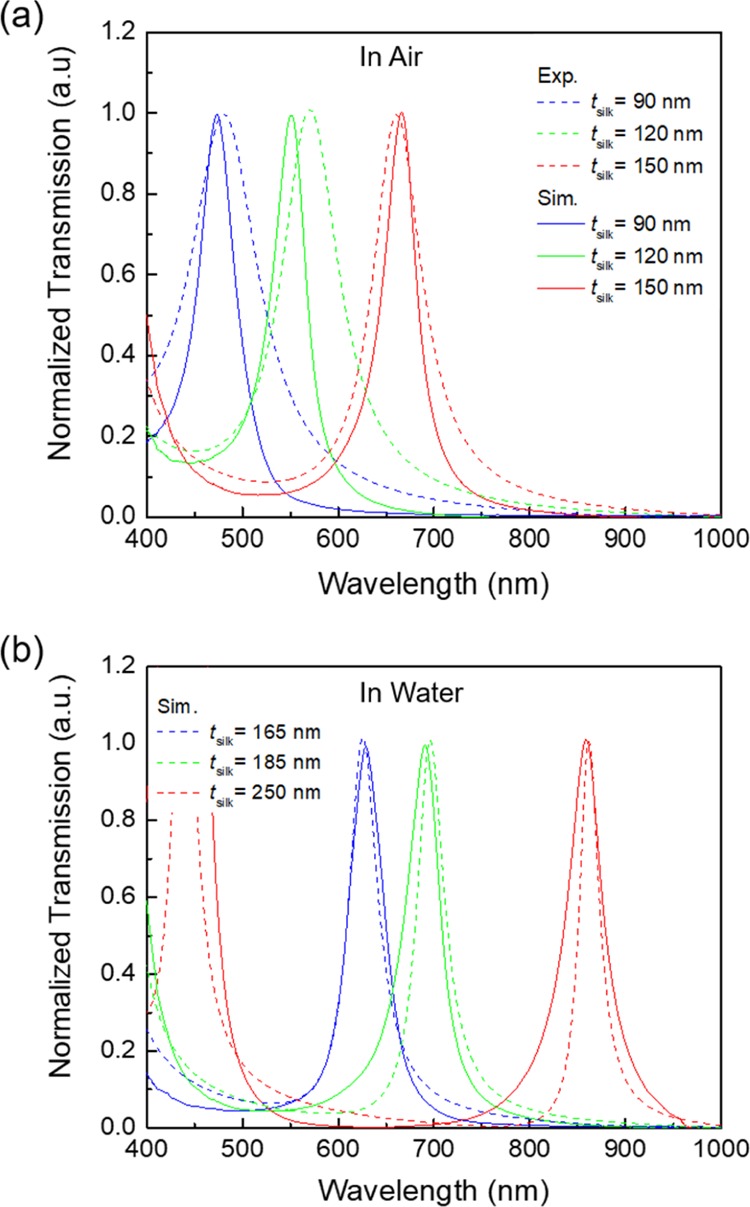
Optical response of the MIM color filters. (a) Simulated transmission spectra (dashed lines) and experimental spectra (solid lines) of the blue, green, and red color filters with tsilk = 90, 120, and 150 nm, respectively. (b) Experimental and simulated transmission spectra of the MIM color filters in water. Using simulation, the estimated thicknesses of the swollen silk films were determined to be 165, 185, and 250 nm for the blue, green, and red color filters, respectively.
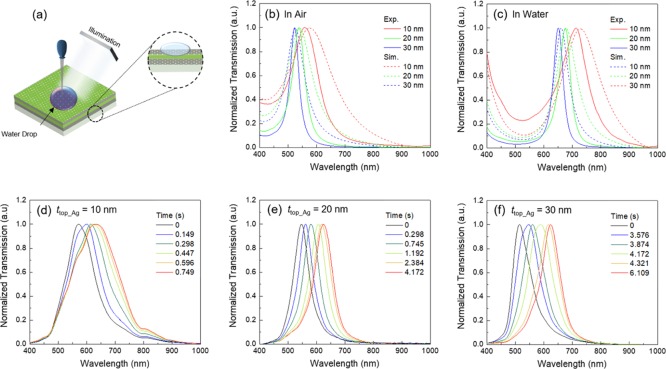
The thin polycrystalline Ag layer deposited by the vacuum evaporation method contains nanopores which allow the liquid molecules and ions to penetrate it. As a consequence of heavy deposition, the size and the numbers of nanopores are reduced, finally disappearing.42 To investigate the effect of the Ag layer thickness on the water infiltration, MIM color filters with top Ag layers with different thicknesses (ttop_Ag = 10, 20, and 30 nm) were fabricated. In these experiments, the thicknesses of the bottom Ag layer and the intermediate silk layer were fixed. A droplet of water was carefully placed on the top Ag layer to avoid penetration via the edges of the MIM structure (Figure 3a). With increasing thickness of the top Ag layer, the transmission peaks became blue-shifted, and the Q factors increased because of the increase in the reflection by the top Ag layer (Figure 3b,c) in both experiment and simulation.
Figure 3.
Optical response of the MIM with varying Ag top layer thickness (10, 20, and 30 nm). (a) Schematic of the water penetration through the nanoporous top Ag layer. (b) Experimental (solid) and simulated (dashed) transmission peaks of the color filters with varying Ag top layer thickness in air and water (c). Time-dependent characteristics of water diffusion into the MIM with different top Ag layer thicknesses: (d) 10, (e) 20, and (f) 30 nm.
The diffusion rate of water through nanopores is directly linked to the number and size of pores; thus, the diffusion increases with decreasing ttop_Ag. This can be estimated by tracing the shift in the transmission spectra. A droplet of water with 100 μm radius was carefully placed on a spot and was absorbed. The swollen volume (V) of the silk layer was 2.1 × 10⁻¹⁵ m3. The saturation times to reach to the fully swollen status were 0.749 (ttop_Ag = 10 nm), 4.172 (ttop_Ag = 20 nm), and 6.109 s (ttop_Ag = 30 nm) (Figure 3d–f), which increased with increasing ttop_Ag. Using the experimental data, we could estimate the water permeability of the Ag nanomembrane deposited on the silk layer using Darcy’s law,43 as shown in eq 1.
| 1 |
Here, K denotes the permeability of the Ag nanomembrane, and ΔP is the pressure difference across the membrane depending on the gravitational force (mg) of the 1 M water per cross-sectional area (A) of flow. ΔL is the thickness of the nanomembrane, and η is the viscosity of 1 M water. The mass of the water (m) is obtained by multiplying the density (ρ) by volume (V), and g is the gravitational acceleration. F is the flow rate across the Ag nanomembrane, measured by dividing the swelled volume of silk by the diffusion time. We obtained permeabilities of 2.3 × 10⁻⁶ m2 (ttop_Ag = 10 nm), 8.2 × 10⁻⁷ m2 (ttop_Ag = 20 nm), and 8.4 × 10⁻⁷ m2 (ttop_Ag = 30 nm). Thus, the increasing thickness of the Ag layer results in the decreasing permeability of the nanomembrane.
In addition, the effect of the nanopores on the FP resonance was investigated using FDTD simulations. For all thicknesses of the top Ag layer (10, 20, and 30 nm), a single nanopore with different diameters or a varying number of 10 nm-diameter nanopores was added to the top Ag layer in the simulated unit cell (Figures S2 and S3). The simulations reveal that the nanopores had no influence on the FP resonance. Additional resonances can arise when the size of the nanopore is comparable to the dimensions of the FP cavity (Figure S4). Therefore, the ultrathin and polycrystalline Ag layer acts as a nanochannel for the liquid molecules, as well as acting as a reflective mirror to form the FP cavity at the same time.
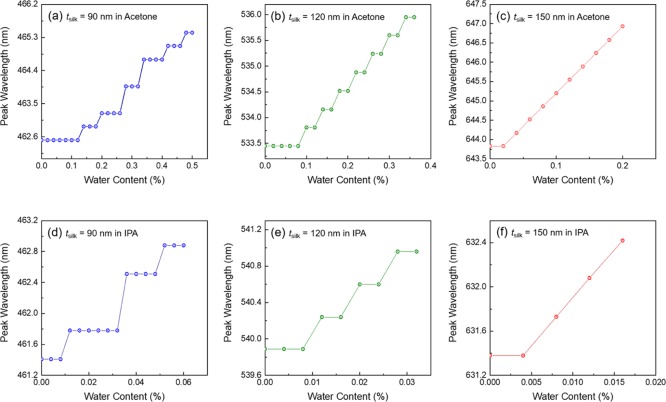
In our previous study, we proved that the swelling ratio of the silk hydrogel layer was related to the water content of organic solvents.17 Because the Ag layer of our MIM resonator acts as a nanochannel connecting the silk layer and the environment, the MIM device is attractive as a highly sensitive water sensor. MIM resonators with three tsilk values [90 (blue), 120 (green), and 150 nm (red color filter)] were immersed in 50 mL of acetone or IPA solutions, and a small amount of water was added to the organic solvent. As shown in Figure 4, the resonance wavelengths were red-shifted with increasing water content because the silk layer was expanded by the absorbed water. For the blue and green color filters, the resonance wavelength shows a steplike shift because the minimum resolution of the spectrometer is 0.36 nm. This indicates that the sensitivity of the MIM-based water sensor can be improved by using a high-resolution spectrometer. The minimum water contents required to induce the 0.36 nm shift were 70 μL (0.14%), 50 μL (0.10%), and 20 μL (0.04%) for the blue, green, and red color filters in acetone, respectively (Figure 4a–c). Interestingly, in IPA, the minimum water content was reduced to 6 μL (0.012%) for the blue and green color filters and 4 μL (0.008%) for the red color filter (Figure 4d–f). This means that the same MIM color filter becomes a more sensitive water sensor in IPA. Previously, we observed that some organic solvents attract water molecules in solvent mixtures, and the strength of the attraction depends on the polarity of the solvent.4 IPA is a weaker attractor than acetone, so water molecules can expand the silk layer more easily in IPA. Additionally, as the thickness of the silk layer increases, the water sensor becomes more sensitive because the wavelength shift by swelling is increasing with increasing tsilk when we consider that the swelling ratio is similar for all tsilk. Our device has a better limit of detection (LOD) than those of fluorescence-based sensors (0.20 and 0.09% LOD in acetone and IPA).37 Although more sensitive water sensors have been demonstrated using an infrared absorbing dye (0.0001% LOD in IPA)38 and a Cd-based metal–organic framework (0.0078% LOD in IPA),36 our device is still attractive because the LOD can be improved by using a high-resolution spectrometer and thicker silk layer, and there is no need to use an additional pigment, which could contaminate the organic solvent.
Figure 4.
Detection of water content in 50 mL acetone and IPA solutions. Transmission spectra for the blue, green, and red color filters for different concentrations of water in acetone (a–c) and IPA (d–f).
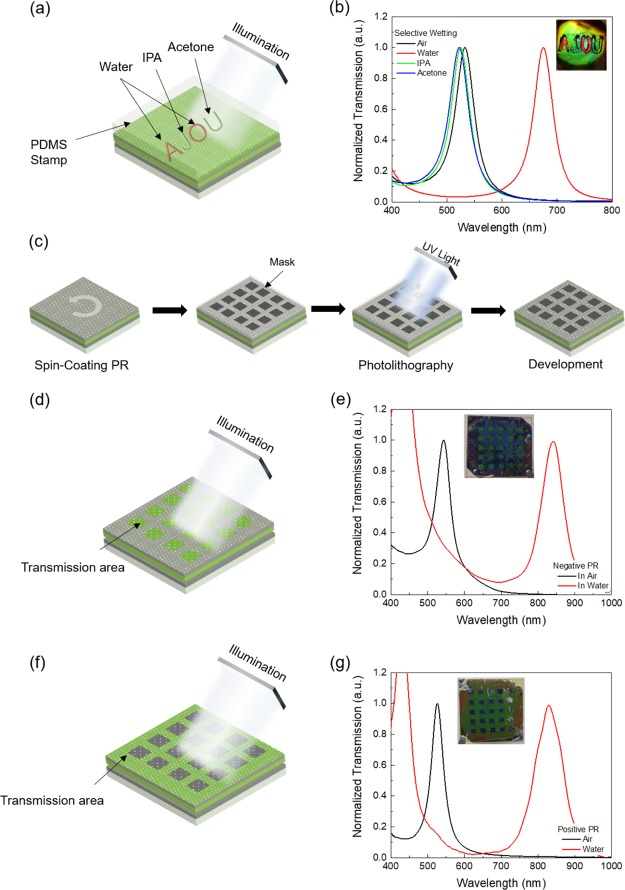
An advantage of our interactive MIM-based sensor is that any spot on the vast Ag plain can be chosen for sensing. Figure 5a shows a schematic of the selective wetting of the MIM-based sensor. A PDMS stamp with letters was fabricated and placed on the top Ag layer after wetting each letter with water, IPA, or acetone, thus allowing the solvents to infiltrate the attached areas only. Under white light illumination, a change in color was only observed for the water-wet letter, whereas no significant change in color was observed for the IPA-wet and acetone-wet areas. The measured transmission spectra confirmed these observations (Figure 5b). Very small blue shifts could be observed for the IPA and acetone because of the reduced RI of the insulator layer by the absorbed solvents. This shows that any solvent can pass through the nanopores and that diffusion through the lateral direction by capillary effect is negligible (Figure S5).
Figure 5.
Selective wetting of the MIM surface. (a) Selective wetting using PDMS A and O (water), J (IPA), and U (acetone) letter-shaped templates. (b) Transmission spectra through the embossed PDMS features with water, IPA, acetone, and air. (c) Schematics for the photolithography procedure on the MIM for selective wetting. The patterns produced on the MIM by (d) negative and (f) positive PR. Transmission spectra in air and water through the square (e) and nonsquare (g) areas formed by negative and positive PRs.
The solvent infiltrating property makes it possible to generate a patterned MIM resonator by selective cross-linking. First, the MIM with the amorphous silk layer was fabricated and, then, a photoresist (PR) was spin-coated on the MIM. The mask was illuminated with UV light through a mask with square patterns, and the PR was developed to remove the exposed (positive-tone PR) or unexposed (negative-tone PR) PR area (Figure 5c,d,f). Subsequently, the PR-coated MIM was exposed to methanol to induce the cross-linking of the silk layer through the opened region. Finally, we put the MIM in an ultrasonic water bath for 30 s. In this process, the non-cross-linked region was removed because the amorphous silk was selectively dissolved in water. For the negative PR and positive PR, the square-patterned color filters were successfully generated and showed the transmission peaks in air and water (Figure 5e,g).
Conclusions
We have demonstrated an interactive, planar, lithography-free, and cost-effective MIM color filter using a silk hydrogel sandwiched between two Ag nanomembranes. The inherent nanopores in the Ag nanomembranes allowed liquid molecules to infiltrate and be absorbed by the silk layer where the optical field is highly localized. The silk hydrogel is swollen by water molecules, resulting in a huge shift in the FP resonance wavelength. FDTD simulations were carried out to design and estimate the resonance behaviors in different environments. We applied the MIM color filters for the highly sensitive water sensor. Traces of water in acetone and IPA could be determined by reading the wavelength shift of the FP mode. Additionally, selective wetting was carried out by means of a PDMS stamp and a PR window to channel solvents to the desired area. Thus, applying silk protein to a MIM resonator provides a new way to make the planar resonator that is in contact with its environment, which will be useful for biochemical sensor applications.
Methods
Preparation of Silk Aqueous Solution
Bombyx mori cocoons were boiled in a 0.02 M Na2CO3 solution for 45 min to remove the sericin protein. Subsequently, the obtained silk fibroin was washed with distilled (DI) water and air-dried for 24 h. Then, silk fibroin was dissolved in a 9.3 M LiBr solution at 60 °C for 4 h to yield 20 wt % silk solution. The silk/LiBr solution was further dialyzed at room temperature for 48 h by means of a dialysis membrane (CelluSep T1, MWCO 3.5k, Membrane Filtration Products) to obtain a 6 wt % silk solution. Furthermore, the silk solution was purified by centrifugation twice at 9000 rpm at −1 °C, followed by filtration with a 0.45 μm-pore syringe filter.
Fabrication of MIM Resonators
The MIM color filters were generated on a quartz substrate. The top (10, 20, and 30 nm) and bottom (30 nm) Ag layers were deposited by electron beam evaporator (SEE-7, ULTECH). The silk solution was diluted with DI water to 4.5 wt %. The silk fibroin solution was spin-coated using a spin coater (ACE-200, Dong Ah Trade Corp) to obtain silk films having thicknesses of 90, 120, and 150 nm on the bottom Ag layer by controlling the spinning speed to 4200, 3700, and 3200 rpm, respectively. To make the silk hydrogel, the samples were immersed in methanol and dried in air. Afterward, the top Ag layer was deposited on the hydrated insulating silk layer.
PR Window Using Photolithography
Hexamethyldisilazane was spin-coated at the 2000 rpm on the MIM resonator for the better adhesion of the PR. Then, hard-baking was carried out at 100 °C for 120 s. Furthermore, 2 μm-thick positive PR (AZ GXR-601, AZ Electronic Materials) and negative PR (DNR-L300, Dongjin Semichem Co., Ltd.) films were spin-coated at 4500 rpm. The samples were soft-baked at 100 °C for 90 s. A photomask with the square pattern was placed and aligned on the MIM, which was further exposed to UV light, followed by treatment with AZ 300MF developer to remove the exposed or unexposed PR area.
Selective Wetting by PDMS Molds
Liquid PDMS was prepared by continuous mixing of SYLGARD elastomer base and curing agent (cross-linker) of 10:1 wt % for 5 min. The prepared mixture was poured onto the mold and kept at 60 °C for 24 h, which allowed the cross-linking of the PDMS. The replica mold (stamp) was obtained by peeling off the PDMS film. Water, acetone, and IPA were added to the embossed feature of the PDMS stamp using a pipette and placed on the MIM to allow the solvent molecules to pass through the selectively wet area.
Simulations
The simulated unit cell was set in a three-dimensional layout and boundary conditions were imposed in the lateral directions. A simulation unit cell of 1000 nm was selected along the x-axis. A plane-wave source in the range of 300–1000 nm with 2000 frequency points was placed on the top of the MIM device along the +z direction. The power monitor was placed below the bottom Ag layer to record transmission. The complex RI of Ag was obtained from the data of Palik.44 The RI of silk protein in air was 1.54, whereas that in water was 1.43. The mesh size for the metallic structure was 10 nm in the x, y, and z directions.
Acknowledgments
The authors acknowledge support from the National Research Foundation (NRF) of Korea (no. 2017R1A2B4010807), the GRRC program of Gyeonggi province (GRRC-AJOU-2016-B01, Photonics-Medical Convergence Technology Research Center), and the Korea Institute of Energy Technology Evaluation and Planning (no. 20164030201380, Human Resources Program in Energy Technology).
Supporting Information Available
The Supporting Information is available free of charge on the ACS Publications website at DOI: 10.1021/acsomega.9b00838.
FDTD-simulated transmission spectra of the MIM with different diameters of nanopores, effect of the number of the nanopores, effect of a larger nanopore diameter on the resonance spectra, and investigation of the capillary effect (PDF)
Author Contributions
All authors have approved the final version of the manuscript.
The authors declare no competing financial interest.
Supplementary Material
References
- Indebetouw G.; Case S. K. Fabry-Perot filters used for optical preprocessing. Appl. Opt. 1981, 20, 1715–1718. 10.1364/ao.20.001715. [DOI] [PubMed] [Google Scholar]
- Wilksch P. A. Instrument function of the Fabry-Perot spectrometer. Appl. Opt. 1985, 24, 1502–1511. 10.1364/ao.24.001502. [DOI] [PubMed] [Google Scholar]
- Diest K.; Dionne J. A.; Spain M.; Atwater H. A. Tunable Color Filters Based on Metal–Insulator–Metal Resonators. Nano Lett. 2009, 9, 2579–2583. 10.1021/nl900755b. [DOI] [PubMed] [Google Scholar]
- Kwon H.; Kim S. Chemically Tunable, Biocompatible, and Cost-Effective Metal-Insulator-Metal Resonators Using Silk Protein and Ultrathin Silver Films. ACS Photonics 2015, 2, 1675–1680. 10.1021/acsphotonics.5b00470. [DOI] [Google Scholar]
- Umar M.; Min K.; Jo M.; Kim S. Ultra-thin, conformal, and hydratable color-absorbers using silk protein hydrogel. Opt. Mater. 2018, 80, 241–246. 10.1016/j.optmat.2018.04.054. [DOI] [Google Scholar]
- Li Z.; Butun S.; Aydin K. Large-area, lithography-free super absorbers and color filters at visible frequencies using ultrathin metallic films. ACS Photonics 2015, 2, 183–188. 10.1021/ph500410u. [DOI] [Google Scholar]
- Valagiannopoulos C. A.; Tukiainen A.; Aho T.; Niemi T.; Guina M.; Tretyakov S.; Simovski C. Perfect magnetic mirror and simple perfect absorber in the visible spectrum. Phys. Rev. B: Condens. Matter Mater. Phys. 2015, 91, 115305. 10.1103/physrevb.91.115305. [DOI] [Google Scholar]
- Yan M. Metal-insulator-metal light absorber: a continuous structure. J. Opt. 2013, 15, 025006. 10.1088/2040-8978/15/2/025006. [DOI] [Google Scholar]
- Kono N.; Kakihara K.; Saitoh K.; Koshiba M. Nonreciprocal microresonators for the miniaturization of optical waveguide isolators. Optic Express 2007, 15, 7737–7751. 10.1364/oe.15.007737. [DOI] [PubMed] [Google Scholar]
- Wang Z.; Fan S. Optical circulators in two-dimensional magneto-optical photonic crystals. Opt. Lett. 2005, 30, 1989–1991. 10.1364/ol.30.001989. [DOI] [PubMed] [Google Scholar]
- Molina J.; Espinosa G.; Torres A.; Sanz M.; Guerrero E.; Perez B.; Fernandez J.; McKenna J.; Hoque M.; Chen W.. MIM-Based ISFET Sensors with CLOSED/OPEN Sense Plates for pH Detection, 2012 IEEE 3rd Latin American Symposium on Circuits and Systems (LASCAS); IEEE, 2012; pp 1–4.
- Arif S.; Umar M.; Kim S. Tuning Photoluminescence of Biological Light Emitters via Silk Protein Based Resonators. Curr. Opt. Photonics 2019, 3, 40–45. 10.3807/COPP.2019.3.1.040. [DOI] [Google Scholar]
- Omenetto F. G.; Kaplan D. L. A new route for silk. Nat. Photonics 2008, 2, 641–643. 10.1038/nphoton.2008.207. [DOI] [Google Scholar]
- Min K.; Umar M.; Ryu S.; Lee S.; Kim S. Silk protein as a new optically transparent adhesion layer for an ultra-smooth sub-10 nm gold layer. Nanotechnology 2017, 28, 115201. 10.1088/1361-6528/aa5aaa. [DOI] [PubMed] [Google Scholar]
- Min K.; Umar M.; Seo H.; Yim J. H.; Kam D. G.; Jeon H.; Lee S.; Kim S. Biocompatible, optically transparent, patterned, and flexible electrodes and radio-frequency antennas prepared from silk protein and silver nanowire networks. RSC Adv. 2017, 7, 574–580. 10.1039/c6ra25580a. [DOI] [Google Scholar]
- Parker S. T.; Domachuk P.; Amsden J.; Bressner J.; Lewis J. A.; Kaplan D. L.; Omenetto F. G. Biocompatible silk printed optical waveguides. Adv. Mater. 2009, 21, 2411–2415. 10.1002/adma.200801580. [DOI] [Google Scholar]
- Min K.; Kim S.; Kim S. Deformable and conformal silk hydrogel inverse opal. Proc. Natl. Acad. Sci. U.S.A. 2017, 114, 6185–6190. 10.1073/pnas.1701092114. [DOI] [PMC free article] [PubMed] [Google Scholar]
- Kujala S.; Mannila A.; Karvonen L.; Kieu K.; Sun Z. Natural silk as a photonics component: A study on its light guiding and nonlinear optical properties. Sci. Rep. 2016, 6, 22358. 10.1038/srep22358. [DOI] [PMC free article] [PubMed] [Google Scholar]
- Choi Y.; Jeon H.; Kim S. A fully biocompatible single-mode distributed feedback laser. Lab Chip 2015, 15, 642–645. 10.1039/c4lc01171f. [DOI] [PubMed] [Google Scholar]
- Jung H.; Min K.; Jeon H.; Kim S. Physically Transient Distributed Feedback Laser Using Optically Activated Silk Bio-Ink. Adv. Opt. Mater. 2016, 4, 1738–1743. 10.1002/adom.201600369. [DOI] [Google Scholar]
- Tao H.; Amsden J. J.; Strikwerda A. C.; Fan K.; Kaplan D. L.; Zhang X.; Averitt R. D.; Omenetto F. G. Metamaterial silk composites at terahertz frequencies. Adv. Mater. 2010, 22, 3527–3531. 10.1002/adma.201000412. [DOI] [PubMed] [Google Scholar]
- Lee M.; Jeon H.; Kim S. A highly tunable and fully biocompatible silk nanoplasmonic optical sensor. Nano Lett. 2015, 15, 3358–3363. 10.1021/acs.nanolett.5b00680. [DOI] [PubMed] [Google Scholar]
- Hu X.; Kaplan D.; Cebe P. Determining beta-sheet crystallinity in fibrous proteins by thermal analysis and infrared spectroscopy. Macromolecules 2006, 39, 6161–6170. 10.1021/ma0610109. [DOI] [Google Scholar]
- Park J.; Choi Y.; Lee M.; Jeon H.; Kim S. Novel and simple route to fabricate fully biocompatible plasmonic mushroom arrays adhered on silk biopolymer. Nanoscale 2015, 7, 426–431. 10.1039/c4nr05172f. [DOI] [PubMed] [Google Scholar]
- Gotoh K.; Izumi H.; Kanamoto T.; Tamada Y.; Nakashima H. Sulfated Fibroin, a Novel Sulfated Peptide Derived from Silk, Inhibits Human Immunodeficiency Virus Replication in Vitro. Biosci., Biotechnol., Biochem. 2000, 64, 1664–1670. 10.1271/bbb.64.1664. [DOI] [PubMed] [Google Scholar]
- Chen L.; Ye J.-W.; Wang H.-P.; Pan M.; Yin S.-Y.; Wei Z.-W.; Zhang L.-Y.; Wu K.; Fan Y.-N.; Su C.-Y. Ultrafast water sensing and thermal imaging by a metal-organic framework with switchable luminescence. Nat. Commun. 2017, 8, 15985. 10.1038/ncomms15985. [DOI] [PMC free article] [PubMed] [Google Scholar]
- Meyer L. V.; Schönfeld F.; Zurawski A.; Mai M.; Feldmann C.; Müller-Buschbaum K. A blue luminescent MOF as a rapid turn-off/turn-on detector for H2O, O2 and CH2Cl2, MeCN: 3∞[Ce(Im)3ImH]·ImH. Dalton Trans. 2015, 44, 4070–4079. 10.1039/c4dt03578j. [DOI] [PubMed] [Google Scholar]
- Pinheiro C.; Lima J. C.; Parola A. J. Using hydrogen bonding-specific interactions to detect water in aprotic solvents at concentrations below 50ppm. Sens. Actuators, B 2006, 114, 978–983. 10.1016/j.snb.2005.08.013. [DOI] [Google Scholar]
- Liang Y. Y. Automation of Karl Fischer water titration by flow injection sampling. Anal. Chem. 1990, 62, 2504–2506. 10.1021/ac00221a018. [DOI] [Google Scholar]
- Oguchi R.; Yamaguchi K.; Shibamoto T. Determination of water content in common organic solvents by a gas chromatograph equipped with a megabore fused-silica column and a thermal conductivity detector. J. Chromatogr. Sci. 1988, 26, 588–590. 10.1093/chromsci/26.11.588. [DOI] [Google Scholar]
- Elghanian R.; Storhoff J. J.; Mucic R. C.; Letsinger R. L.; Mirkin C. A. Selective colorimetric detection of polynucleotides based on the distance-dependent optical properties of gold nanoparticles. Science 1997, 277, 1078–1081. 10.1126/science.277.5329.1078. [DOI] [PubMed] [Google Scholar]
- Anker J. N.; Hall W. P.; Lyandres O.; Shah N. C.; Zhao J.; Van Duyne R. P.. Biosensing with plasmonic nanosensors. Nanoscience and Technology: A Collection of Reviews from Nature Journals; World Scientific, 2010; pp 308–319. [Google Scholar]
- Brolo A. G. Plasmonics for future biosensors. Nat. Photonics 2012, 6, 709. 10.1038/nphoton.2012.266. [DOI] [Google Scholar]
- Xu T.; Wu Y.-K.; Luo X.; Guo L. J. Plasmonic nanoresonators for high-resolution colour filtering and spectral imaging. Nat. Commun. 2010, 1, 59. 10.1038/ncomms1058. [DOI] [PubMed] [Google Scholar]
- Fenzl C.; Hirsch T.; Wolfbeis O. Photonic crystal based sensor for organic solvents and for solvent-water mixtures. Sensors 2012, 12, 16954–16963. 10.3390/s121216954. [DOI] [PMC free article] [PubMed] [Google Scholar]
- Cheng F.; Fu R.; Wen Y.; Yang Y.-Y.; Zeng C.; Zhang Y.; Hu S.; Wu X. A new Cd based metal-organic framework for quick and convenient detection of trace water in isopropanol and 1,4-dioxane. J. Mater. Chem. C 2018, 6, 12341–12346. 10.1039/c8tc04483j. [DOI] [Google Scholar]
- Tan J.; Wang X.; Zhang Q.; Zhou H.; Yang J.; Wu J.; Tian Y.; Zhang X. Chalcone based ion-pair recognition towards nitrates and the application for the colorimetric and fluorescence turn-on determination of water content in organic solvents. Sens. Actuators, B 2018, 260, 727–735. 10.1016/j.snb.2017.12.186. [DOI] [Google Scholar]
- Li M.; Pacey G. E. Spectrophotometric determination of trace water in organic solvents with a near infrared absorbing dye. Talanta 1997, 44, 1949–1958. 10.1016/s0039-9140(96)02111-x. [DOI] [PubMed] [Google Scholar]
- Andrews N. L. P.; MacLean A. G.; Saunders J. E.; Barnes J. A.; Loock H.-P.; Saad M.; Jia C.; Ramaswamy K.; Chen L. R. Quantification of different water species in acetone using a NIR-triple-wavelength fiber laser. Opt. Express 2014, 22, 19337–19347. 10.1364/oe.22.019337. [DOI] [PubMed] [Google Scholar]
- Zhou X.; Liu X.; Jeffries J. B.; Hanson R. K. Development of a sensor for temperature and water concentration in combustion gases using a single tunable diode laser. Meas. Sci. Technol. 2003, 14, 1459. 10.1088/0957-0233/14/8/335. [DOI] [Google Scholar]
- Tsukada M.; Gotoh Y.; Nagura M.; Minoura N.; Kasai N.; Freddi G. Structural changes of silk fibroin membranes induced by immersion in methanol aqueous solutions. J. Polym. Sci., Part B: Polym. Phys. 1994, 32, 961–968. 10.1002/polb.1994.090320519. [DOI] [Google Scholar]
- Oh C.-M.; Park K. H.; Choi J.-H.; Hwang S.; Noh H.; Yu Y. M.; Jang J.-W. Polycrystalline Au Nanomembrane as a Tool for Two-Tone Micro/Nanolithography. Chem. Mater. 2017, 29, 3863–3872. 10.1021/acs.chemmater.6b04268. [DOI] [Google Scholar]
- Whitaker S. Flow in porous media I: A theoretical derivation of Darcy’s law. Transp. Porous Media 1986, 1, 3–25. 10.1007/bf01036523. [DOI] [Google Scholar]
- Ghosh G.Handbook of Optical Constants of Solids: Handbook of Thermo-Optic Coefficients of Optical Materials with Applications; Academic Press, 1998. [Google Scholar]
Associated Data
This section collects any data citations, data availability statements, or supplementary materials included in this article.


