Abstract
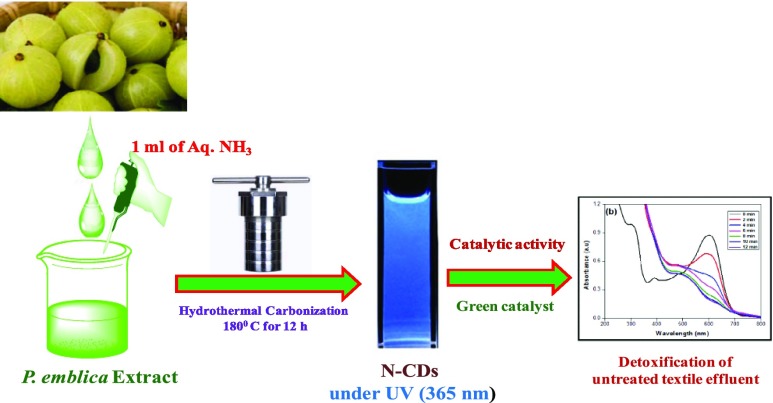
A facile method for reduction of textile effluents (TEff) using fluorescent nitrogen-doped carbon dots (N-CDs) has been developed and reported here. The synthesis of N-CDs was done by a hydrothermal carbonization method using the aqueous extract of Phyllanthus emblica (P. emblica) fruit as a carbon source and aq NH3 as a nitrogen dopant. Various analytical techniques have been employed for the characterization of N-CDs. The size of the synthesized N-CDs was found to be 4.08 nm, which was confirmed by high-resolution transmission electron microscopy analysis. The graphitic character of the N-CDs was studied by using selected area energy diffraction pattern and Raman spectroscopy studies. Under the excitation of 320 nm, an intense blue fluorescence was emitted by N-CDs of around 400 nm. From the obtained results of energy-dispersive spectrometry, EDAX, and Fourier transform infrared studies, it was confirmed that nitrogen was doped over the N-CD surface. Finally, the catalytic ability of NaBH4 was found to be enhanced remarkably by the synthesized CDs in the detoxification of TEff.
1. Introduction
In earlier days, semiconductor quantum dots have invited the attention of scientists because of their remarkable luminescent and electronic properties. Because the preparation of semiconductor quantum dots usually involves heavy metals, which are very harmful to both human beings and environment even at low levels, their applications in the field of biomedicine are very much limited.1 This has prompted the researchers to search for biocompatible quantum dots in preference to semiconductor quantum dots. In general, carbon dots (CDs) are highly fluorescent novel carbon nanomaterials having a diameter between 1 and 10 nm , which mainly consists of sp2-hybridized carbon atoms.2−4 These fluorescent CDs have been generally utilized in various applications because of their fundamental merits such as low toxicity, good biosafety, high water solubility, high chemical inactiveness, and easy functionalization.5,6 Owing to the superior properties of CDs, they have greater applications in various fields over the conventional semiconductor quantum dots.7
The doping of N, P, and S on CDs has been found to significantly improve the fundamental properties of CDs such as optical and electronic, fluorescent behavior, surface modification, and chemical activity because of the extra electrons present in the heteroatom.8,9 CDs have been widely used in multidisciplinary research fields such as catalysis, drug delivery, optoelectronics, bioimaging, gene delivery, biosensing, metal ion sensing, energy storage devices, and photovoltaics.2−15 Though there has been rapid progress in the field of CDs, their synthesis is quite difficult because of complicated reaction conditions, harmful starting materials, and steps involved in surface passivation.16
Nowadays, natural and renewable green sources are used as precursors for the synthesis of CDs because they are inexpensive, clean, nontoxic, and easily accessible.17 For the synthesis of CDs, some of the reported natural carbon precursors are soya beans, orange juice, gas soot, grass, watermelon peel, pomelo peel, ginger, and honey.18 The CDs prepared from these sources are fluorescent in nature. The particle size, choice of dopant, effect of the passivating agent, pH, time, temperature, and nature of the solvent, etc., play a vital role in influencing the fluorescent behavior of the CDs. The fluorescence ability and catalytic behavior of the CDs has been significantly improved when electron-rich heteroatoms such as nitrogen, boron, and sulfur are doped over the surface of the CDs.19 Moreover, the synthesized CDs can be utilized as effective fluorescent probes for sensing, catalysis, and biological applications.20
It is well-known that textile industries release huge quantities of textile effluents (TEff) containing a variety of dyes and chemicals that harm both human and ecosystems when effluents get mixed into rivers and other water bodies.21,22 In recent years, treatment of TEff and other environmental pollutants has become a major challenge worldwide. At present, to overcome this problem, appropriate strategies are being advocated involving the use of chemicals as reducing agents.23 In the present work, the catalytic ability of the biogenic nitrogen-doped CDs (N-CDs) is utilized for the detoxification of TEff.
Indian gooseberry or amla is botanically identified as Phyllanthus emblica, and it belongs to the Phyllanthaceae family of flowering plants. The amla fruit is quite fibrous and has sour and bitter taste. The phytochemical constituents of the fruit include two hydrolysable tannins Emblicanin A and B, phyllemblin, corilagin, furosin, geraniin, quercetin, phyllantine and phyllantidine, amino acids, and carbohydrates. The juice of the fruit contains high concentration of vitamin C.24 Further, it contains a high quantity of valuable nutrients such as iron phosphorus, sodium, calcium, proteins, vitamin B complex, carbohydrates, cholesterol, and carotene.25 In India, amla is commonly used as a diuretic, laxative, liver tonic, refrigerant, restorative, an antipyretic, hair tonic, an ulcer preventive, and for the treatment of common cold, alone or in combination with other plants.26
In the present study, P. emblica is used as a source of carbon, and for the nitrogen doping, aq NH3 has been used for the synthesis of N-CDs by an easy one-pot hydrothermal carbonization method without adding any surface passivating agent. In order to improve the photophysical property of CDs, aq NH3 was introduced as a nitrogen source in the acidic medium. The resultant N-CDs were carefully examined with the help of various analytical techniques such as UV–visible and fluorescence spectroscopy, high-resolution transmission electron microscopy (HR-TEM), energy-dispersive spectrometry (EDS), energy dispersive X-ray analysis (EDAX), selected area energy dispersion (SAED), Fourier transform infrared (FT-IR), X-ray diffraction (XRD), and Raman spectroscopy. UV–visible spectroscopy was used to monitor the catalytic ability of the hydrothermally obtained N-CDs in the detoxification of TEff using NaBH4.
2. Results and Discussion
The green hydrothermal carbonization of P. emblica extract has resulted in the color transformation from pale green to blackish brown, which indicated the formation of N-CDs.
2.1. Optical Properties of N-CDs
UV–vis spectroscopy is the most valuable technique for analyzing the optical characters of CDs, and it is reciprocal to fluorescence spectroscopy.27Figure 1a shows the UV–vis spectra of the P. emblica fruit extract and obtained N-CDs in aqueous medium. The extract of P. emblica fruit showed the absorption maxima at 275 nm in the UV region, and the N-CDs exhibit two major absorption maxima at 271 and 317 nm, corresponding to the π–π* transition of C=C (sp2) bonds and the n−π* transition of the nitrogen or carbonyl group, respectively.27 The excitation spectrum of N-CDs (Figure 1b) showed a photoluminescence (PL) excitation peak at 317 nm, which corroborates to the absorption spectrum (Figure 1a). The prepared N-CDs were transparent in daylight and exhibited blue luminescence under UV illumination at 365 nm (Figure 1a inset).
Figure 1.
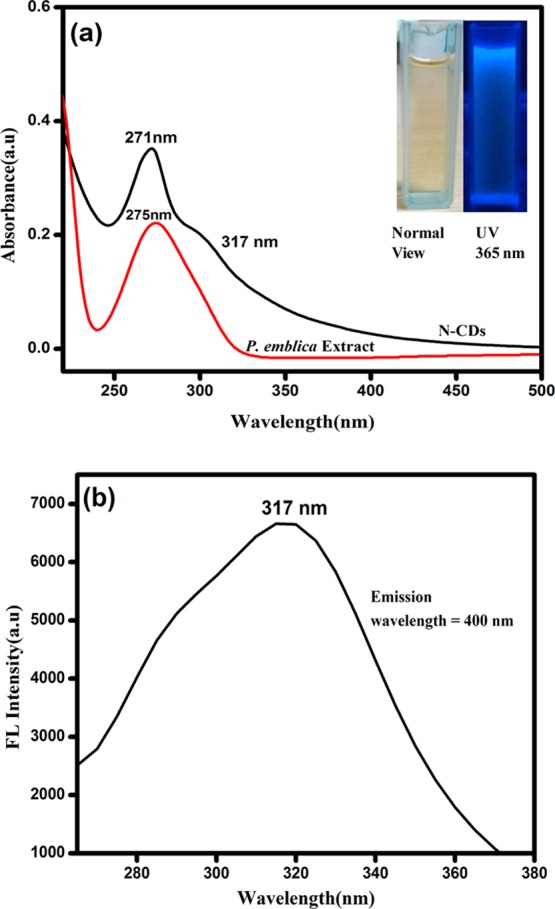
(a) Absorption spectra of the P. emblica extract and N-CDs and (b) corresponding PL excitation spectrum of N-CDs.
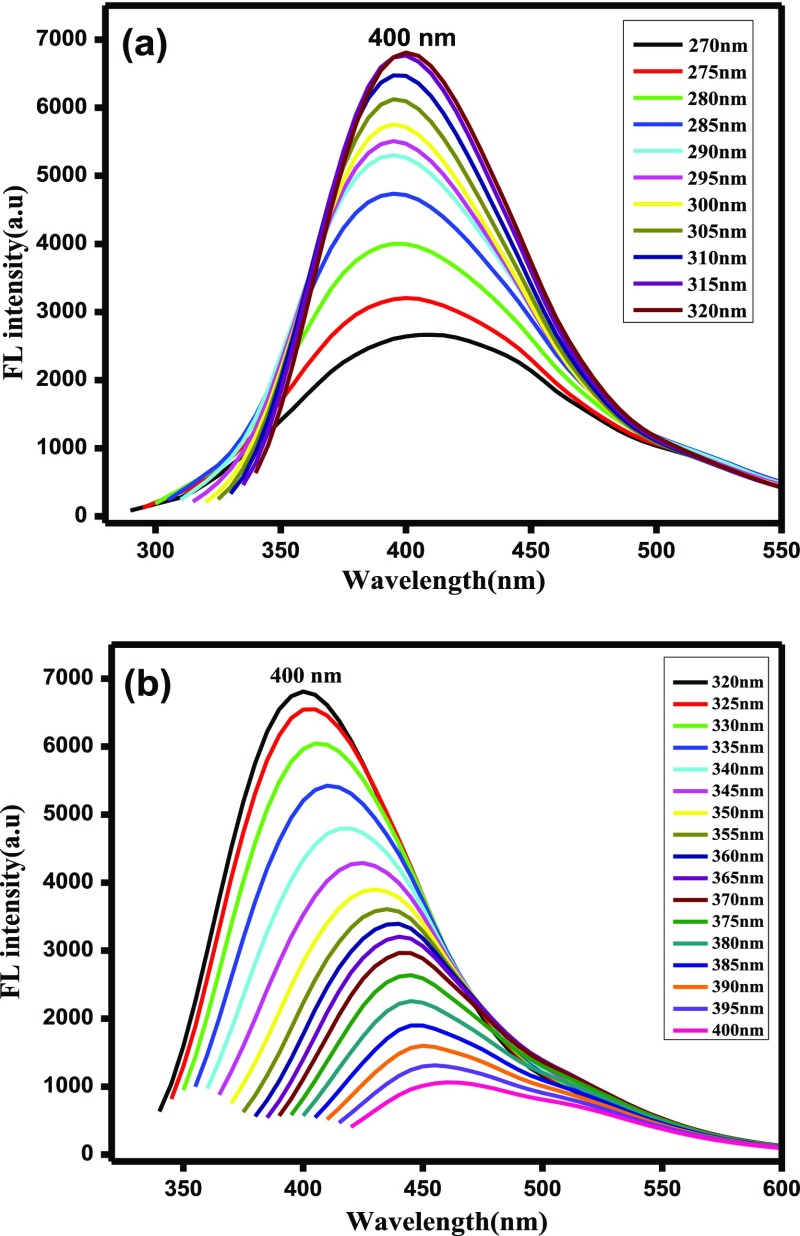
Figure 2 displays the PL emission spectra of the prepared N-CDs at various excitation wavelengths. The PL emission intensity of the N-CDs depends strongly on excitation wavelengths. On the variation of the excitation wavelength from 270 to 320 nm (Figure 2a), the PL intensity gradually increased owing to the π to π* transitions of graphitic carbon cores of the N-CDs. In Figure 2b, there was a gradual decrease in the emission peak intensity when the excitation wavelength was varied from 320 to 400 nm and the PL emission peaks showed a bathochromic shift. The maximum intensity was observed at 400 nm under the excitation of 320 nm. Thus, the PL emission spectra of the prepared N-CDs appeared because of the radiative recombination of nitrogen moieties (or) carbonyl functional groups present on the N-CD surface.28 The quantum yield was calculated by a relative fluorescence method, which was found to be 0.34 for undoped CDs and 0.41 for N-CDs. The zeta potential was found to be −0.27 for N-CDs and −3.23 for undoped CDs.
Figure 2.
PL emission spectra of N-CDs at various excitation wavelengths (a) from 270 to 320 nm; and (b) from 320 to 400 nm.
2.2. Surface Morphology
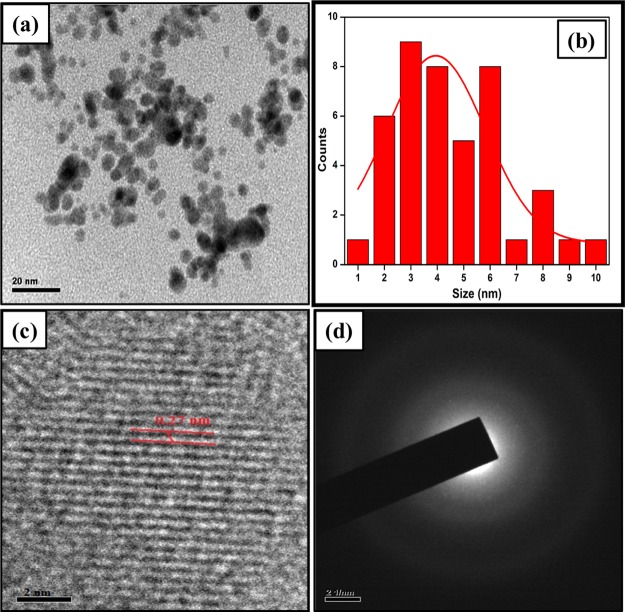
Figure 3a shows the HR-TEM images of the N-CDs at the scale range of 20 nm. The green synthesized N-CDs were found to be spread evenly on the copper grid and were spherical in nature. The average diameter of N-CDs was 4.08 nm with size ranging from 1 to 10 nm (Figure 3b). The HR-TEM image in Figure 3c visibly displays the lattice fringes, which evidently confirmed the graphitic nature of the N-CD.29 The calculated d-spacing value was approximately 0.27 nm, which revealed the C(100) plane in graphitic carbon.30 The diffused disk pattern in the SAED of N-CDs (Figure 3d) confirmed the amorphous nature of carbon.31
Figure 3.
HR-TEM image of N-CDs (a) at the 20 nm scale; (b) particle size graph; (c) HR-TEM image of N-CDs at the 2 nm scale; and (d) SAED outline for N-CDs.
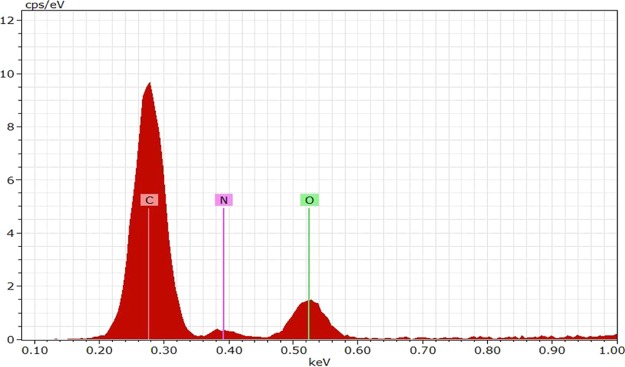
The EDS technique provides supportive information to the HR-TEM analysis and furnishes exact details on the elements present in the N-CDs.32 The EDAX spectrum from the scanning electron microscopy analysis served as evidence for the elements present in the N-CDs. The EDS (Figure 4) and EDAX (Figure 5) spectra of the synthesized N-CDs mostly contain C (73.45%), N (8.65%), and O (17.90%).33
Figure 4.
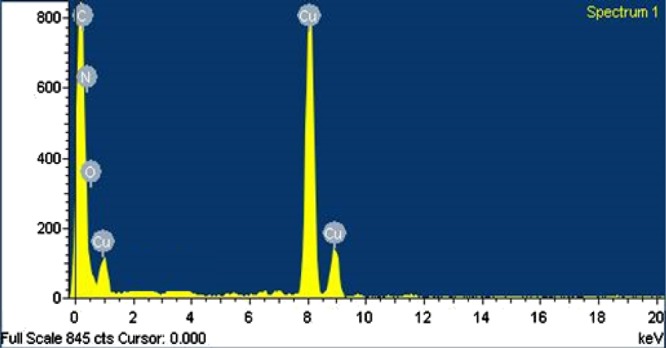
Energy-dispersive spectrum of N-CDs.
Figure 5.
EDAX spectrum of N-CDs.
2.3. Structural Analysis
Figure 6 displays the FT-IR spectra of the P. emblica fruit extract and synthesized N-CDs. It can be observed that the P. emblica extract shows broad absorption bands at 3414, 2856, 1707, and 1341 cm–1 that correspond to the stretching frequency of −OH, −C–H, −C=O, and −C–O–C functional groups, respectively. The IR spectrum of N-CDs had absorption bands at 3426, 2928, 1629, and 1047 cm–1, which could be assigned to the stretching frequency of −OH/–NH, −CH, −C=C (sp2), and −C–N (N doping) functional groups, respectively.34,35 These results confirmed that the synthesized N-CDs consists of acid, hydroxyl, amine, amide, and carbonyl moieties.
Figure 6.
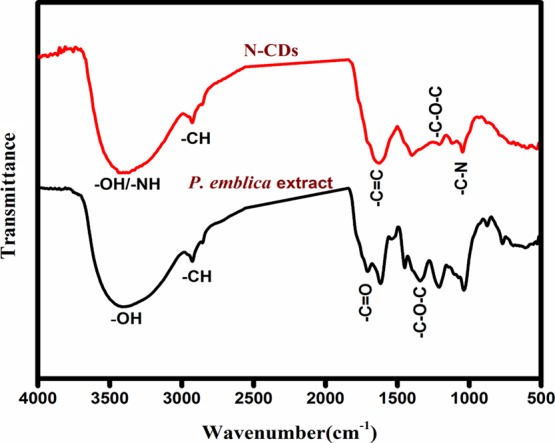
FT-IR spectra of N-CDs and P. emblica fruit extract.
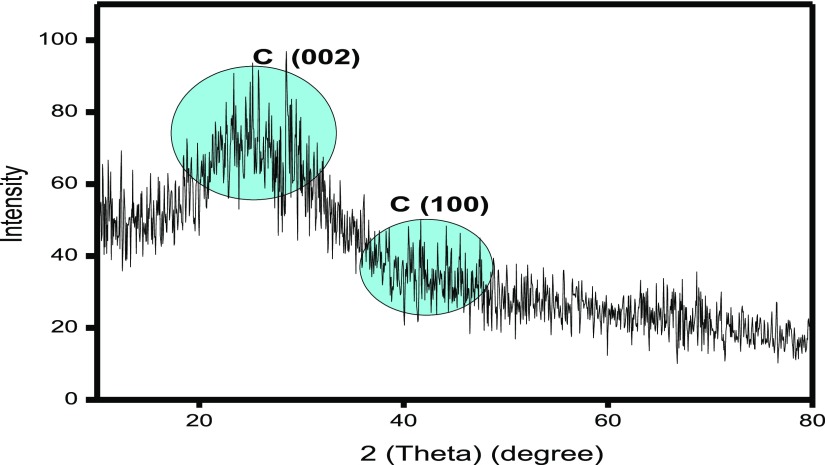
Figure 7 provides the XRD pattern for the synthesized N-CDs. The intense broad peak appeared at 2θ = 28.5° and a weak peak appeared at 2θ = 40.6°, which were assigned to the (002) plane and (100) plane of graphitic carbon, respectively.36 Bragg’s equation (eq 1) was used to calculate the interlayer distance (d-spacing) value for the synthesized N-CDs.
| 1 |
where λ is the wavelength of incident X-ray (λ = 1.54 Å), n is a positive integer, and θ is the position of the plane. Because of the tiny-sized N-CDs, the XRD peak was broadened. The calculated interlayer distance (d-spacing) value of synthesized N-CDs was 0.319 and 0.277 nm, which corresponds to the C(002) and C(100) peaks, respectively.
Figure 7.
XRD pattern of N-CDs.
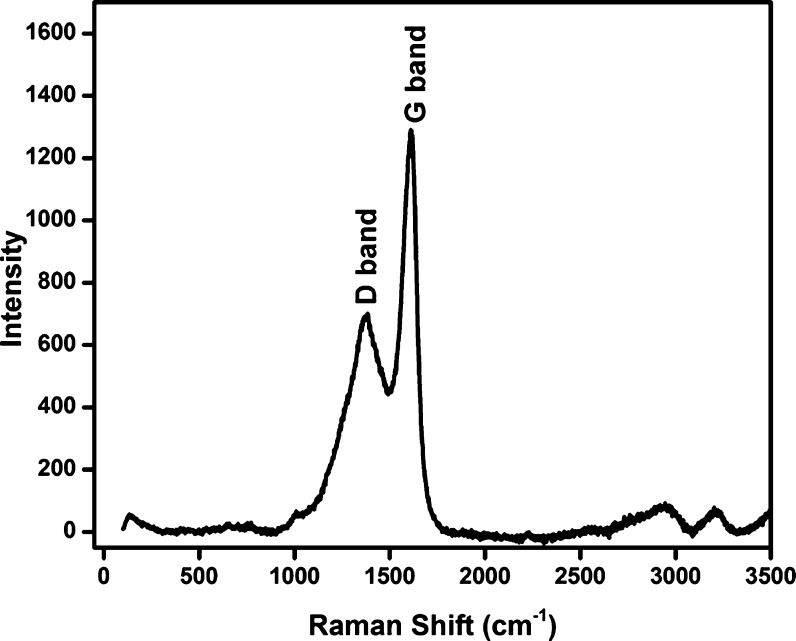
Raman spectroscopy is one of the most important techniques for characterizing carbon-based materials. Figure 8 displays the Raman spectrum for the green synthesized N-CDs. This spectrum showed two dissimilar bands at 1384 and 1610 cm–1, which indicate the presence of the D band and G bands in the synthesized N-CDs, which correspond to the sp3 defects and sp2 carbon, respectively.32 The Raman spectroscopic results noticeably confirmed the minimum surface defects with moderate graphitic structure.37
Figure 8.
Raman spectrum for synthesized N-CDs.
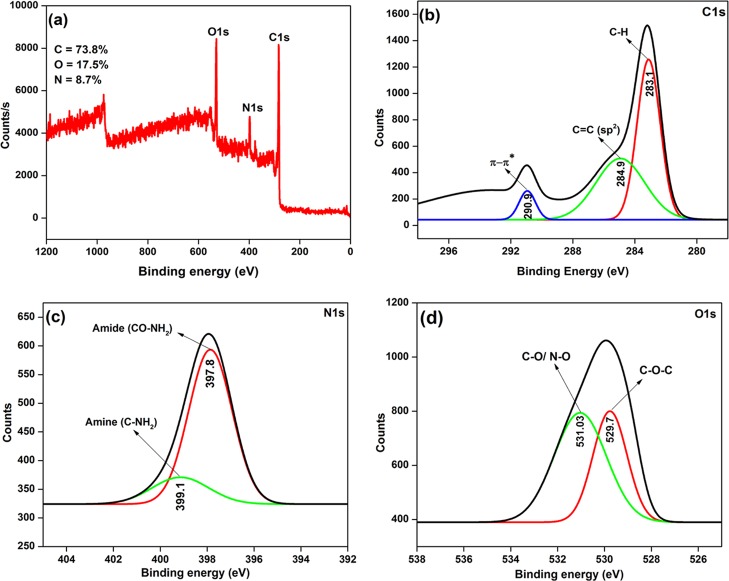
X-ray photoelectron spectroscopy (XPS) is the most useful tool, and it provides elemental identity and also the exact quantity of the elements present in the CDs. Figure 9 displays the overall XPS spectrum of the synthesized N-CDs and its deconvoluted XPS spectra for C (1s), N (1s), and O (1s) elements. In Figure 9a, the elemental carbon, nitrogen, and oxygen peaks appeared at 282.8, 397.8, and 529.4 eV, respectively. Figure 9b displays the deconvolution spectrum of C 1s, which shows three peaks at 283.1, 284.9, and 290.9 eV, and they are ascribed to C–H, C=C (sp2), and π–π* transitions, respectively.38−40 In particular, one of the C 1s peaks at 284.9 eV indicated that the synthesized N-CDs were mostly constructed by sp2 carbon atoms.36,41 Next, Figure 9c shows the high-resolution deconvolution spectrum of N 1s, which appeared as two peaks at 397.8 and 399.1 eV, which may possibly be ascribed to amide (O=C–NH2) and amine (C–NH2) groups on the N-CDs surface, respectively.36,41 Finally, Figure 9d shows the deconvolution spectrum of O 1s, which exhibits two binding energy peaks at 529.7 and 531.03 eV, which correspond to the C–O–C and −C–O/–N–O groups, respectively.37,39 The XPS results noticeably exposed that carbon, nitrogen, and oxygen were present in the synthesized N-CDs and their atomic percentages (%) were 73.8, 8.7, and 17.5, respectively, which confirmed that nitrogen was doped on the surface of the CDs.27,36 From the above discussion, it can be concluded that the synthesized N-CDs have hydroxyl, amine, amide, and carboxyl functional groups, which supported the results of FT-IR spectroscopy and HR-TEM with EDS analysis.36,37,39
Figure 9.
(a) XPS spectrum of the synthesized N-CDs (full survey scan) and deconvoluted high-resolution XPS spectrum of (b) C 1s, (c) N 1s, and (d) O 1s.
2.4. Mechanism for Formation of N-CDs
The formation of N-CDs has been reported to be taking place through four steps: polymerization, aromatization, nucleation, and growth process.21 The extract of P. emblica and aqueous ammonia on heating to about 100 °C forms bigger sized polymeric particles in the first step because of inter- and intramolecular dehydration. In the next step, while increasing the temperature, the aromatization of the bigger sized polymeric molecules takes place. In the third step, the nucleation burst between the aromatized molecules could lead finally to the formation of N-CDs.36,42
2.5. Catalytic Ability of N-CDs in the Detoxification of TEff Using NaBH4
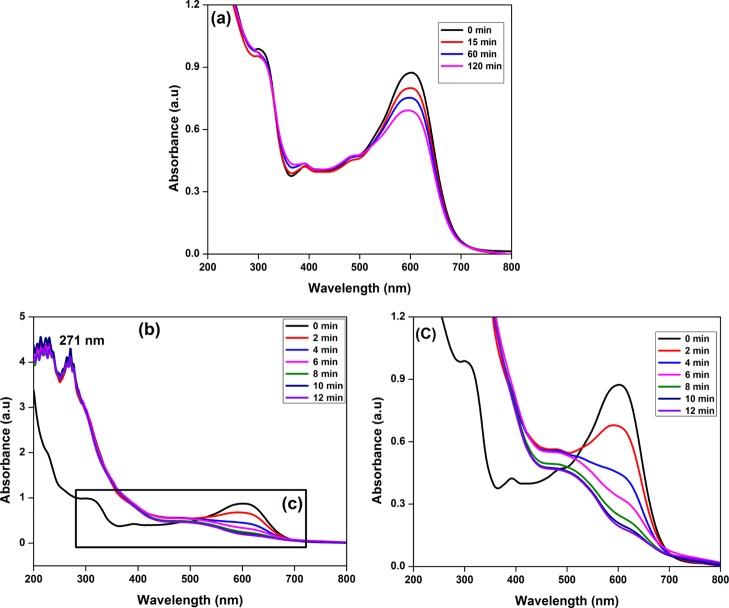
The detoxification of TEff using NaBH4 in the presence of N-CDs was followed using UV–visible spectroscopy. The λmax values for the dyes present in TEff were 601, 392, and 302 nm. Figure 10a shows the detoxification of TEff using NaBH4 in the absence of synthesized N-CDs. The intensity of TEff slightly decreased after the addition of NaBH4. There was only a slight decrease in the intensity of TEff on increase of time. Even after 2 h, no significant reduction of TEff could be observed. Figure 10b displays the UV–visible spectra of the detoxification of TEff using NaBH4 in the presence of synthesized N-CDs (green catalyst) and Figure 10c is the inset of Figure 10b that clearly shows the degradation of pigments. After the addition of 10 μL of green catalyst (0.2 wt/vol %) to the reaction mixture containing TEff and NaBH4, the intensity of TEff decreased markedly and the reduction reaction was completed in 12 min. The TEff absorption peaks disappeared upon addition of N-CDs, which confirmed the superior catalytic ability of the N-CDs in the degradation of dyes present in TEff. The absorption maximum of synthesized N-CDs at 271 nm (Figure 11b) indicated that the green catalyst remained unchanged even after the completion of the reduction reaction.
Figure 10.
UV–visible absorption spectra of the detoxification of TEff using NaBH4 (a) in the absence of N-CDs and (b) in the presence of N-CDs and (c) inset of Figure 11b.
Figure 11.
Graphical representation of the mechanism of formation of N-CDs.
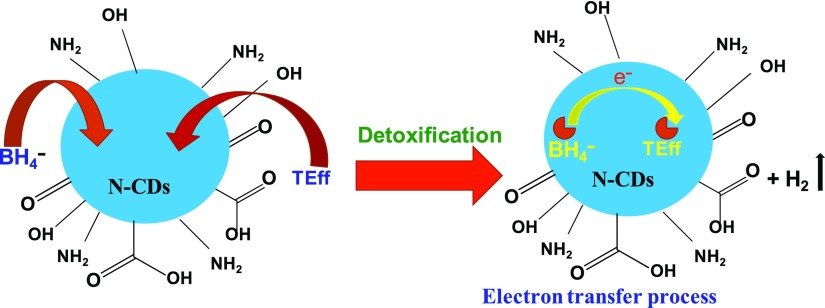
The reduction of mixture of dyes present in the TEff by the N-CDs can be explained with the help of Langmuir–Hinshelwood mechanism.33 The BH4– and dyes get adsorbed over the biogenic N-CDs. The electronic reaction between BH4– and dyes is probably facilitated through electron transfer via N-CDs, which lowers the energy barrier between the reactant and product. This could lead to the increased rate of degradation of pigments in the effluents.9,43,44 Thus, the results of the study explicitly state that N-CDs act as a superior catalyst in the detoxification of TEff by NaBH4 (Figure 12).45
Figure 12.
Graphical representation of the mechanism for the detoxification of TEff using N-CDs.
3. Conclusions
The present study outlines the successful strategy of production of N-CDs from the P. emblica fruit extract through a one-pot hydrothermal carbonization process. The HR-TEM image exhibits the spherical nature of the synthesized N-CDs with an average size of 4.08 nm. The XRD pattern and Raman spectroscopic results confirmed the graphitic nature of the synthesized N-CDs. The N-CDs emitted an intense blue color at 365 nm. The FT-IR and EDS spectroscopy results confirmed the doping of nitrogen on the surface of the N-CDs. The synthesized N-CDs showed considerable catalytic ability on the reduction of TEff by NaBH4 when monitored spectroscopically.
Thus, the study has brought to light a successful strategy of detoxification of TEff from textile industries by employing biogenically prepared N-CDs as revealed by the real-time test results.
4. Experimental Methods
4.1. Materials and Chemicals
The P. emblica (amla) fruits were acquired from the local market in Dindigul, Tamil Nadu, India. Aqueous ammonia, sodium borohydride, and quinine sulfate were procured from CDH Fine Chemicals. TEff were collected from a dyeing unit at Tiruppur, Tamil Nadu, India, prior to the treatment processes. For the preparation of solutions, conductivity water was used.
4.2. P. emblica Fruit Extract Preparation
About 50 g of P. emblica fruit was thoroughly washed in running water, carefully cut into small pieces, and crushed well mechanically. The prepared amla extract was first filtered by filtration with the help of cotton and then using a Whatmann 40 filter paper. The resultant P. emblica fruit extract was utilized as the biogenic source for the preparation of N-CDs.
4.3. Synthesis of N-CDs
A simple, one-pot hydrothermal carbonization process was used for the preparation of N-CDs from P. emblica extract. In this process, the mixture of 29 mL of the P. emblica extract and 1 mL of aq NH3 was taken in a stainless steel autoclave containing a 50 mL Teflon lin. The autoclave was kept in a hot air oven for 12 h at 180 °C. After the completion of reaction, the autoclave was allowed to cool at 25 °C. After reaching room temperature, the autoclave was carefully opened and the extract was filtered through a Whatmann 40 filter paper and centrifuged for 1 h at 10 000 rpm. The resultant dark brown solution containing N-CDs was collected and carefully stored in a refrigerator at 4 °C for further studies.
4.4. Characterization Methods
A Jasco FP 8500 PL spectrophotometer was used to analyze the optical properties of the resultant N-CDs. In the fluorescence spectrophotometer, the excitation wavelengths from 270 to 400 nm were used to find the maximum luminescence intensity. A PerkinElmer LAMBDA 35 UV–visible spectrophotometer was used to characterize the N-CDs on the basis of absorption maxima. The morphology and microstructures were examined by using a JOEL JEM 2100 electron microscope with an accelerating voltage of 200 kV. In HR-TEM studies, the samples were prepared by placing an aqueous solution containing CDs over the copper grid and dried at ambient temperature. A Jasco FT-IR 460 Plus spectrophotometer was employed to analyze the dried P. emblica extract and synthesized N-CDs. A PANalytical X’Pert diffractometer was utilized for recording the XRD pattern of N-CDs. STR 500 nm focal length laser Raman spectroscopy was employed for obtaining Raman spectra for the synthesized N-CDs. A DelsaNano C particle analyzer was used to measure the zeta potential of the N-CDs. Simultaneously, the undoped CDs were also prepared and characterized using the above methods (results are given in as Supporting Information).
4.5. Assessment of the Catalytic Ability of N-CDs
The catalytic performance of the synthesized N-CDs was examined using a UV–visible spectrophotometer. The untreated TEff was collected from a dyeing unit at Tiruppur, Tamil Nadu, India, which contained a mixture of dyes such as yellow RD, navy CN, and black SGR. The quartz cuvette having 3.5 mL capacity with a path length of 1 cm was used to carry out the catalytic reduction of the TEff. Trial experiments were performed to determine the optimum parameters for the reduction of green synthesized N-CDs. TEff (1 mL) was mixed with 1.80 mL of water and 0.20 mL of NaBH4 (0.50 M) with and without N-CDs [10 μL(0.2 wt/vol %)], and the reduction of TEff was monitored using a UV–visible spectrophotometer at various intervals of time from 200 to 800 nm.
Supporting Information Available
The Supporting Information is available free of charge on the ACS Publications website at DOI: 10.1021/acsomega.8b03674.
Absorption spectra and corresponding PL excitation spectra of undoped CDs; PL emission spectra of synthesized undoped CDs; FT-IR spectra of N-CDs and undoped CDs; XRD pattern of the synthesized undoped CDs; Raman spectrum for undoped CDs; EADX and EDS spectra of undoped CDs; HR-TEM images and SAED pattern of undoped CDs; and zeta potential graph for N-CDs and undoped CDs (PDF)
The authors declare no competing financial interest.
Supplementary Material
References
- Lim S. Y.; Shen W.; Gao Z. Carbon quantum dots and their applications. Chem. Soc. Rev. 2015, 44, 362–381. 10.1039/c4cs00269e. [DOI] [PubMed] [Google Scholar]
- Atchudan R.; Edison T. N. J. I.; Sethuraman M. G.; Lee Y. R. Efficient synthesis of highly fluorescent nitrogen-doped carbon dots for cell imaging using unripe fruit extract of Prunus mume. Appl. Surf. Sci. 2016, 384, 432–441. 10.1016/j.apsusc.2016.05.054. [DOI] [Google Scholar]
- Zhang J.; Yu S.-H. Carbon dots: large-scale synthesis, sensing, and bioimaging. Mater. Today 2016, 19, 382–393. 10.1016/j.mattod.2015.11.008. [DOI] [Google Scholar]
- Wang Y.; Hu A. Carbon quantum dots: synthesis, properties and applications. J. Mater. Chem. C 2014, 2, 6921–6939. 10.1039/c4tc00988f. [DOI] [Google Scholar]
- Zhou M.; Zhou Z.; Gong A.; Zhang Y.; Li Q. Synthesis of highly photoluminescent carbon dots via citric acid and Tris for iron (III) ions sensors and bioimaging. Talanta 2015, 143, 107–113. 10.1016/j.talanta.2015.04.015. [DOI] [PubMed] [Google Scholar]
- Chen J.; Wei J.-S.; Zhang P.; Niu X.-Q.; Zhao W.; Zhu Z.-Y.; Ding H.; Xiong H.-M. Red-emissive carbon dots for fingerprints detection by spray method: Coffee ring effect and unquenched fluorescence in drying process. ACS Appl. Mater. Interfaces 2017, 9, 18429–18433. 10.1021/acsami.7b03917. [DOI] [PubMed] [Google Scholar]
- Yang S.-T.; Cao L.; Luo P. G.; Lu F.; Wang X.; Wang H.; Meziani M. J.; Liu Y.; Qi G.; Sun Y.-P. Carbon dots for optical imaging in vivo. J. Am. Chem. Soc. 2009, 131, 11308–11309. 10.1021/ja904843x. [DOI] [PMC free article] [PubMed] [Google Scholar]
- Zhai C.; Sun M.; Zhu M.; Song S.; Jiang S. A new method to synthesize sulfur-doped graphene as an effective metal-free electrocatalyst for oxygen reduction reaction. Appl. Surf. Sci. 2017, 407, 503–508. 10.1016/j.apsusc.2017.02.191. [DOI] [Google Scholar]
- Li L.; Zhang T.; Lü J.; Lü C. A facile construction of Au nanoparticles stabilized by thermo-responsive polymer-tethered carbon dots for enhanced catalytic performance. Appl. Surf. Sci. 2018, 454, 181–191. 10.1016/j.apsusc.2018.05.157. [DOI] [Google Scholar]
- Zhang Y.-Q.; Ma D.-K.; Zhang Y.-G.; Chen W.; Huang S.-M. N-doped carbon quantum dots for TiO2-based photocatalysts and dye-sensitized solar cells. Nano Energy 2013, 2, 545–552. 10.1016/j.nanoen.2013.07.010. [DOI] [Google Scholar]
- Wang H.; Sun P.; Cong S.; Wu J.; Gao L.; Wang Y.; Dai X.; Yi Q.; Zou G. Nitrogen-doped carbon dots for “green” quantum dot solar cells. Nanoscale Res. Lett. 2016, 11, 27. 10.1186/s11671-016-1231-1. [DOI] [PMC free article] [PubMed] [Google Scholar]
- Wang H.; Wang Y.; Guo J.; Su Y.; Sun C.; Zhao J.; Luo H.; Dai X.; Zou G. A new chemosensor for Ga3+ detection by fluorescent nitrogen-doped graphitic carbon dots. RSC Adv. 2015, 5, 13036–13041. 10.1039/c4ra15431b. [DOI] [Google Scholar]
- Atchudan R.; Edison T. N. J. I.; Aseer K. R.; Perumal S.; Lee Y. R. Hydrothermal conversion of Magnolia liliiflora into nitrogen-doped carbon dots as an effective turn-off fluorescence sensing, multi-colour cell imaging and fluorescent ink. Colloids Surf., B 2018, 169, 321–328. 10.1016/j.colsurfb.2018.05.032. [DOI] [PubMed] [Google Scholar]
- Atchudan R.; Edison T. N. J. I.; Aseer K. R.; Perumal S.; Karthik N.; Lee Y. R. Highly fluorescent nitrogen-doped carbon dots derived from Phyllanthus acidus utilized as a fluorescent probe for label-free selective detection of Fe3+ ions, live cell imaging and fluorescent ink. Biosens. Bioelectron. 2018, 99, 303–311. 10.1016/j.bios.2017.07.076. [DOI] [PubMed] [Google Scholar]
- Atchudan R.; Edison T. N. J. I.; Lee Y. R. Nitrogen-doped carbon dots originating from unripe peach for fluorescent bioimaging and electrocatalytic oxygen reduction reaction. J. Colloid Interface Sci. 2016, 482, 8–18. 10.1016/j.jcis.2016.07.058. [DOI] [PubMed] [Google Scholar]
- Liu S.; Tian J.; Wang L.; Zhang Y.; Qin X.; Luo Y.; Asiri A. M.; Al-Youbi A. O.; Sun X. Hydrothermal treatment of grass: A low-cost, green route to nitrogen-doped, carbon-rich, photoluminescent polymer nanodots as an effective fluorescent sensing platform for label-free detection of Cu (II) ions. Adv. Mater. 2012, 24, 2037–2041. 10.1002/adma.201200164. [DOI] [PubMed] [Google Scholar]
- Yin B.; Deng J.; Peng X.; Long Q.; Zhao J.; Lu Q.; Chen Q.; Li H.; Tang H.; Zhang Y.; Yao S. Green synthesis of carbon dots with down- and up-conversion fluorescent properties for sensitive detection of hypochlorite with a dual-readout assay. Analyst 2013, 138, 6551–6557. 10.1039/c3an01003a. [DOI] [PubMed] [Google Scholar]
- Xue M.; Zou M.; Zhao J.; Zhan Z.; Zhao S. Green preparation of fluorescent carbon dots from lychee seeds and their application for the selective detection of methylene blue and imaging in living cells. J. Mater. Chem. B 2015, 3, 6783–6789. 10.1039/c5tb01073j. [DOI] [PubMed] [Google Scholar]
- Bhunia S. K.; Saha A.; Maity A. R.; Ray S. C.; Jana N. R. Carbon Nanoparticle-based fluorescent bioimaging probes. Sci. Rep. 2013, 3, 1473. 10.1038/srep01473. [DOI] [PMC free article] [PubMed] [Google Scholar]
- Wang X.; Qu K.; Xu B.; Ren J.; Qu X. Microwave assisted one-step green synthesis of cell-permeable multicolor photoluminescent carbon dots without surface passivation reagents. J. Mater. Chem. 2011, 21, 2445–2450. 10.1039/c0jm02963g. [DOI] [Google Scholar]
- Georgiou D.; Melidis P.; Aivasidis A.; Gimouhopoulos K. Degradation of azo reactive dyes by ultraviolet radiation in the presence of hydrogen peroxide. Dyes Pigm. 2002, 52, 69–78. 10.1016/s0143-7208(01)00078-x. [DOI] [Google Scholar]
- Ardejani F. D.; Badii K.; Limaee N. Y.; Mahmoodi N. M.; Arami M.; Shafaei S. Z.; Mirhabibi A. R. Numerical modelling and laboratory studies on the removal of Direct Red 23 and Direct Red 80 dyes from textile effluents using orange peel, a low-cost adsorbent. Dyes Pigm. 2007, 73, 178–185. 10.1016/j.dyepig.2005.11.011. [DOI] [Google Scholar]
- Ghoreishi S. M.; Haghighi R. Chemical catalytic reaction and biological oxidation for treatment of non-biodegradable textile effluent. Chem. Eng. J. 2003, 95, 163–169. 10.1016/s1385-8947(03)00100-1. [DOI] [Google Scholar]
- Garg N.; Meena A.; Nain J. Evaluation of physicochemical and preliminary phytochemical studies on the root of Bombax ceiba Linn. Int. J. Res. Ayurveda Pharm. 2011, 2, 924–926. [Google Scholar]
- Lewis R. J.; Garcia M. L. Therapeutic potential of venom peptides. Nat. Rev. Drug Discovery 2003, 2, 790–802. 10.1038/nrd1197. [DOI] [PubMed] [Google Scholar]
- Dasaroju S.; Gottumukkala K. M. Current trends in the research of Emblica Officinalis (Amla): A pharmacological perspective. Int. J. Pharm. Sci. Rev. Res. 2014, 24, 150–159. [Google Scholar]
- Edison T. N. J. I.; Atchudan R.; Sethuraman M. G.; Shim J.-J.; Lee Y. R. Microwave-assisted green synthesis of fluorescent N-doped carbon dots: Cytotoxicity and bio-imaging applications. J. Photochem. Photobiol., B 2016, 161, 154–161. 10.1016/j.jphotobiol.2016.05.017. [DOI] [PubMed] [Google Scholar]
- Shen R.; Song K.; Liu H.; Li Y.; Liu H. Dramatic fluorescence enhancement of bare carbon dots through facile reduction chemistry. Chemphyschem 2012, 13, 3549–3555. 10.1002/cphc.201200018. [DOI] [PubMed] [Google Scholar]
- Dong Y.; Pang H.; Yang H. B.; Guo C.; Shao J.; Chi Y.; Li C. M.; Yu T. Carbon-based dots co-doped with nitrogen and sulfur for high quantum yield and excitation independent emission. Angew. Chem., Int. Ed. 2013, 52, 7800–7804. 10.1002/anie.201301114. [DOI] [PubMed] [Google Scholar]
- Gude V. Synthesis of hydrophobic photoluminescent carbon nanodots by using L-tyrosine and citric acid through a thermal oxidation route. Beilstein J. Nanotechnol. 2014, 5, 1513–1522. 10.3762/bjnano.5.164. [DOI] [PMC free article] [PubMed] [Google Scholar]
- Sachdev A.; Gopinath P. Green synthesis of multifunctional carbon dots from coriander leaves and their potential application as antioxidants, sensors and bioimaging agents. Analyst 2015, 140, 4260–4269. 10.1039/c5an00454c. [DOI] [PubMed] [Google Scholar]
- Arul V.; Edison T. N. J. I.; Lee Y. R.; Sethuraman M. G. Biological and catalytic applications of green synthesized fluorescent N-doped carbon dots using Hylocereus undatus. J. Photochem. Photobiol., B 2017, 168, 142–148. 10.1016/j.jphotobiol.2017.02.007. [DOI] [PubMed] [Google Scholar]
- Mehta V. N.; Jha S.; Kailasa S. K. One-pot green synthesis of carbon dots by using Saccharum officinarum juice for fluorescent imaging of bacteria (Escherichia coli) and yeast (Saccharomyces cerevisiae) cells. Mater. Sci. Eng., C 2014, 38, 20–27. 10.1016/j.msec.2014.01.038. [DOI] [PubMed] [Google Scholar]
- Mehta V. N.; Jha S.; Singhal R. K.; Kailasa S. K. Preparation of multicolor emitting carbon dots for HeLa cell imaging. New J. Chem. 2014, 38, 6152–6160. 10.1039/c4nj00840e. [DOI] [Google Scholar]
- Atchudan R.; Perumal S.; Karthikeyan D.; Pandurangan A.; Lee Y. R. Synthesis and characterization of graphitic mesoporous carbon using metal-metal oxide by chemical vapor deposition method. Microporous Mesoporous Mater. 2015, 215, 123–132. 10.1016/j.micromeso.2015.05.032. [DOI] [Google Scholar]
- Arul V.; Sethuraman M. G. Facile green synthesis of fluorescent N-doped carbon dots from Actinidia deliciosa and their catalytic activity and cytotoxicity applications. Opt. Mater. 2018, 78, 181–190. 10.1016/j.optmat.2018.02.029. [DOI] [Google Scholar]
- Edison T. N. J. I.; Atchudan R.; Shim J.-J.; Kalimuthu S.; Ahn B.-C.; Lee Y. R. Turn-off fluorescence sensor for the detection of ferric ion in water using green synthesized N-doped carbon dots and its bio-imaging. J. Photochem. Photobiol., B 2016, 158, 235–242. 10.1016/j.jphotobiol.2016.03.010. [DOI] [PubMed] [Google Scholar]
- Campos B. B.; Contreras-Cáceres R.; Bandosz T. J.; Jiménez-Jiménez J.; Rodríguez-Castellón E.; Silva J. C. G. E. d.; Algarra M. Carbon dots as a fluorescent sensor for detection of explosive nitro compounds. Carbon 2016, 106, 171–178. 10.1016/j.carbon.2016.05.030. [DOI] [Google Scholar]
- Atchudan R.; Edison T. N. J. I.; Chakradhar D.; Perumal S.; Shim J.-J.; Lee Y. R. Facile green synthesis of nitrogen-doped carbon dots using Chionanthus retusus fruit extract and investigation of their suitability for metal ion sensing and biological applications. Sens. Actuators, B 2017, 246, 497–509. 10.1016/j.snb.2017.02.119. [DOI] [Google Scholar]
- Li Y.-J.; Harroun S. G.; Su Y.-C.; Huang C.-F.; Unnikrishnan B.; Lin H.-J.; Lin C.-H.; Huang C.-C. Synthesis of self-assembled spermidine-carbon quantum dots effective against multidrug-resistant bacteria. Adv. Healthcare Mater. 2016, 5, 2545–2554. 10.1002/adhm.201600297. [DOI] [PubMed] [Google Scholar]
- Lai C.-W.; Hsiao Y.-H.; Peng Y.-K.; Chou P.-T. Facile synthesis of highly emissive carbon dots from pyrolysis of glycerol; gram scale production of carbon dots/mSiO2 for cell imaging and drug release. J. Mater. Chem. 2012, 22, 14403–14409. 10.1039/c2jm32206d. [DOI] [Google Scholar]
- Zhu S.; Song Y.; Zhao X.; Shao J.; Zhang J.; Yang B. The photoluminescence mechanism in carbon dots (graphene quantum dots, carbon nanodots, and polymer dots): current state and future perspective. Nano Res. 2015, 8, 355–381. 10.1007/s12274-014-0644-3. [DOI] [Google Scholar]
- Gupta N.; Singh H. P.; Sharma R. K. Metal nanoparticles with high catalytic activity in degradation of methyl orange: An electron relay effect. J. Mol. Catal. A: Chem. 2011, 335, 248–252. 10.1016/j.molcata.2010.12.001. [DOI] [Google Scholar]
- Mallick K.; Witcomb M.; Scurrell M. Silver nanoparticle catalyzed redox reaction: An electron relay effect. Mater. Chem. Phys. 2006, 97, 283–287. 10.1016/j.matchemphys.2005.08.011. [DOI] [Google Scholar]
- Nigam P.; Banat I. M.; Singh D.; Marchant R. Microbial process for the decolorization of textile effluent containing azo, diazo and reactive dyes. Process Biochem. 1996, 31, 435–442. 10.1016/0032-9592(95)00085-2. [DOI] [Google Scholar]
Associated Data
This section collects any data citations, data availability statements, or supplementary materials included in this article.


