Abstract
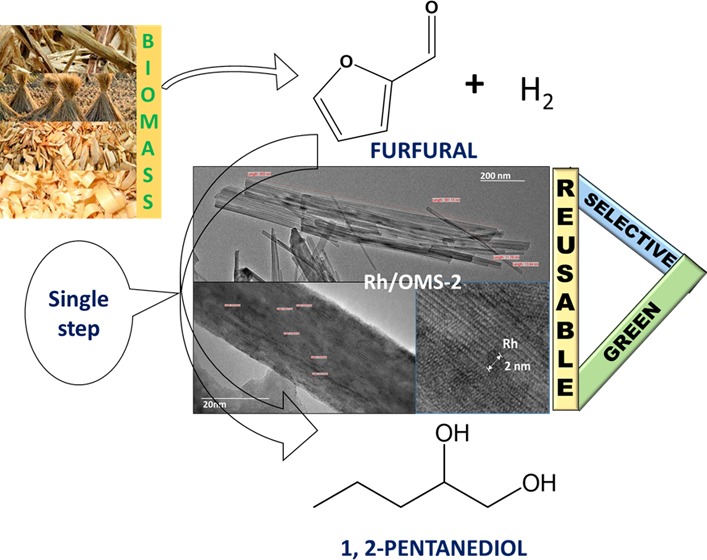
Hydrogenolysis of biomass-derived furfural (FFA) to 1,2-pentanediol (1,2-PeD) was investigated using a bifunctional catalyst with basic and metallic sites, which was synthesized by the hydrothermal method. The synthesized catalyst consisting of rhodium (Rh) supported on an octahedral molecular sieve (OMS-2) of different loadings, such as 0.5, 1, and 1.5% w/w, was studied, and 1% (w/w) loading gave the best results. This 1% w/w Rh/OMS-2 catalyst showed excellent catalytic activity and selectivity for the hydrogenolysis reaction because of better dispersion of rhodium, later revealed by characterization. Furthermore, 1% Rh/OMS-2 catalyst was well characterized in virgin and reused states using various techniques such as Fourier-transform infrared spectroscopy, NH3-temperature-programmed desorption (TPD), CO2-TPD, temperature-programmed reduction, H2 pulse chemisorption, scanning electron microscopy, high-resolution transmission electron microscopy, X-ray diffraction, Brunauer–Emmett–Teller surface area, X-ray photoelectron spectroscopy, Raman spectroscopy, and differential scanning calorimetry–thermogravimetry analysis. The catalyst showed a higher surface area of 72 m2/g and the average size of the highly dispersed Rh metal of ∼2 nm. The studies were performed in a batch reactor; the catalyst offered almost 100% conversion of FFA with 87% selectivity to 1,2-PeD at 160 °C and 30 atm hydrogen pressure in 8 h. The reaction mechanism and kinetic model have been developed using a dual-site Langmuir–Hinshelwood–Hougen–Watson mechanism. The activation energies were 12.3 and 27.6 kcal/mol, correspondingly. The catalyst was found to be active, selective, and reusable.
Introduction
Octahedral molecular sieves (OMS-2, cryptomelane-type) of a manganese oxide-based material have been used since decades in a variety of applications such as battery electrode,1 sensor material in chemical sensing,2 energy storage,3 supercapacitors,4 catalyst in redox reactions5 and water oxidation,6 adsorbent in adsorptive desulfurization of fuel gas, etc.7 The core of OMS-2 has linked edges and vertices of MnO6 octahedra, in the form of square tunnels of 2 × 2 with one-dimensional pore structure. The square tunnels have approximate pore size of 0.46 × 0.46 nm2.7,8 The metal ions in the tunnel balance the valencies, +2, +3, and +4, as well as provide active sites for selective catalysis.9 Briefly, OMS-2 is popular because of its porous nature, ability to form open tunnels, low cost, robustness, high surface area, and environmental friendliness.10 The OMS-2-supported catalyst possesses acidic as well as basic sites with loading of metals such as of Ag and Pt, which were already used for the hydrogenolysis and selective hydrogenation reactions.11−13
Hydrogenolysis of the furan ring of furfural (FFA) generates many chemicals such as furfural alcohol (FA); tetrahydrofurfuryl alcohol (THFA); terahydrofurfural;14 2-methyl terahydrofuran;15 and important diols such as 1,2-pentanediol (1,2-PeD), 1,5-pentanediol (1,5-PeD), etc. 1,2-PeD is an important chemical used in numerous applications, for instance, as a monomer in the manufacture of polyesters,16 as an intermediate in the production of fungicides, as a constituent of products such as printing inks and disinfectant,17 and in cosmetics as an antimicrobial agent.18 Since decades, 1,2-PeD is being produced from petrochemical sources such as n-pentene using mineral acid or formic acid,19 but the process is not green as it uses homogeneous acids as a catalyst and generates waste. There is ample literature available for production of pentanediol (both 1,2-PeD and 1,5-PeD) from feedstocks such as furfuryl alcohol (FA) and tetrahydrofurfuryl alcohol (THFA), which are the intermediates of furfural hydrogenolysis. For example, the Tomishige group studied hydrogenolysis of THFA to produce 1,5-PeD using ReOx/MoOx-modified Rh/SiO2 catalysts in the aqueous phase.15,16 The work related to gas-phase hydrogenation of FFA to FA, as well as liquid-phase hydrogenation of furfural and hydroxymethyl furfural to FA, THFA, 2,5-bis(hydroxymethyl)-furan, etc., is excellently summarized by Tomishige and co-workers.20 The hydrogenolysis of furfural was studied extensively by Zhang et al.,21 who obtained ∼42.1% yield of 1,2-PeD by hydrogenolysis of FFA over Ru/MnOx catalyst at 150 °C and 1.5 MPa hydrogen pressure. A critical review on selective hydrogenolysis and hydrogenation of various biomass-derived products includes conversion of FFA to value-added chemicals including FA and THFA over metal oxide-modified noble metal catalysts such as Rh–ReOx, Rh–MoOx, Ir–ReOx/SiO2, Ir–ReOx/SiO2, etc.22 Moreover, use of ReOx-modified Ir metal (IrReOx) catalysts for hydrogenation of glycerol, sorbitol, and related compounds was also studied.23 A Pd (0.66 wt %)–Ir–ReOx/SiO2 catalyst was used to produce 1,5-PeD up to 71.4% using furfural as feedstock in one pot at 60 atm hydrogen pressure and 120 °C.24 Also, a Rh (0.66 wt %)–Ir–ReOx/SiO2 catalyst produced 71.1% of 1,5-PeD from furfural (50 wt %) in a one-pot two-step temperature reaction.25 Insight into the reaction mechanism and kinetics of THFA hydrogenolysis to 1,5-PeD was provided using Rh–ReOx/SiO2 and Rh/SiO2 catalysts.26 On a layered double oxide of the Cu–Mg3AlO4.5 catalyst, combined yield (of 1,2-PeD and 1,5-PeD) up to 80% was obtained at 140 °C and 60 atm hydrogen pressure with the highest selectivity of 51% to 1,2-PeD using FA as a feedstock.27 A report suggested a selective hydrogenation of FFA to THFA using a bimetallic Cu–Ni/carbon nanotube (CNT) and Ni/CNT as catalysts at mild reaction conditions.28 Recently, Mizugaki et al. used Pt/HT for the direct hydrogenolysis of FFA to 1,2-PeD and successfully obtained 73% yield of 1,2-PeD.17 The bifunctional Pd/MMT-K10 catalyst was also reported to yield 66% 1,2-PeD directly from furfural with complete conversion.29 As production of pentanediol involves a ring-opening reaction, it requires a longer reaction time and harsh reaction conditions. Therefore, it remained a challenging task to get higher conversion of FFA as well as selectivity to 1,2-PeD at mild reaction conditions.
In the present work, hydrogenolysis of furfural to 1,2-pentanediol was achieved in one pot using a heterogeneous mixed-valent octahedral molecular sieve. Rhodium (1% w/w)-impregnated OMS-2 (1% Rh/OMS-2) catalyst was synthesized using the hydrothermal method. Additionally, this catalyst was well characterized in virgin and reused forms by several techniques such as Fourier-transform infrared (FTIR) spectroscopy, NH3-temperature-programmed desorption (TPD), CO2-TPD, temperature-programmed reduction (TPR), H2 pulse chemisorption, scanning electron microscopy (SEM), high-resolution transmission electron microscopy (HR-TEM), X-ray diffraction (XRD), Brunauer–Emmett–Teller (BET) surface area, Raman spectroscopy, X-ray photoelectron spectroscopy (XPS), and differential scanning calorimetry–thermogravimetry analysis (DSC–TGA). The catalyst was selected for hydrogenolysis of FFA, and various reaction parameters were also optimized. A dual-site Langmuir–Hinshelwood–Hougen–Watson (LHHW) mechanism was proposed and kinetic model established. This is the first report on the Rh/OMS-2 catalyst that was used for the single-step hydrogenolysis of furfural while achieving complete conversion of furfural along with higher selectivity (87%) of 1,2-PeD at mild reaction conditions.
Results and Discussion
Efficacy of Different Catalysts
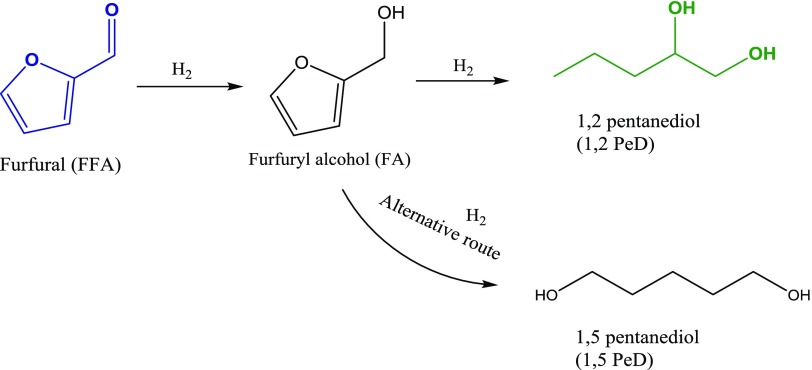
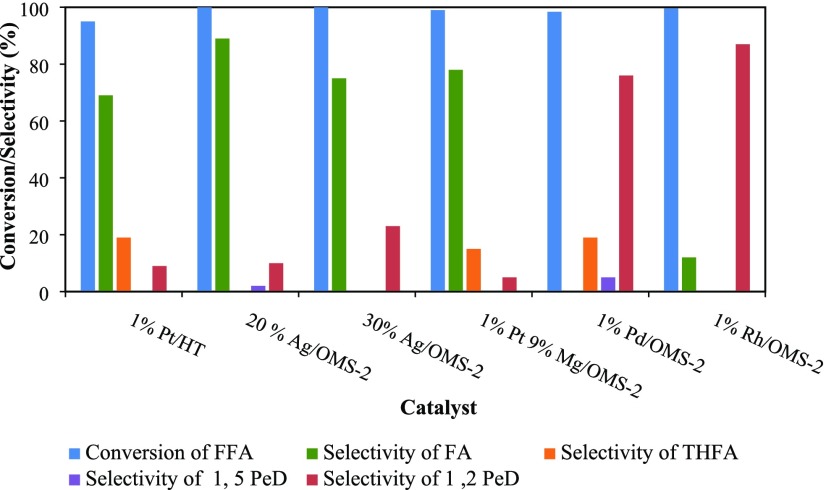
Catalysts such as 1% Pt/HT were prepared by the methods discussed by Mizugaki et al.,17 and other catalysts including 20% Ag/OMS-2, 30% Ag/OMS-2, 1% Pt–9% Mg/OMS-2, 1% Pd/OMS-2, and 1% Rh/OMS-2 were prepared by the method discussed in the Experimental Section. All of these catalysts were screened for hydrogenolysis of FFA to 1,2-PeD. The reaction is sequential hydrogenation of FFA to give reaction intermediate FA, which on further hydrogenolysis produces the final product 1,2-pentanediol (Scheme 1). The catalysts were screened on the basis of conversion of FFA and selectivity to 1,2-PeD. From Figure 1, it was observed that all OMS-2-supported catalysts showed significant activity in terms of conversion of FFA. The OMS-2 support was found to be suitable for the complete hydrogenation of FFA. This was because of the acidic and basic sites available on OMS-2. It was a well-known fact that conversion of FFA into 1,2-PeD requires a longer reaction time and usually high temperature and pressure.17,30,31 The conversion of FFA after 8 h was found to be in the order of 30% Ag/OMS-2 (100%), >20% Ag/OMS-2 (100%), >1% Rh/OMS-2 (99.6%), >1% Pt–9% Mg/OMS-2 (99%), >1% Pd/OMS-2 (98.4%).
Scheme 1. Hydrogenolysis of FFA to 1,2-PeD.
Figure 1.
Effect of different catalysts on the FFA conversion and product selectivity. FFA, 0.0073 mol; speed of agitation, 800 rpm; catalyst wt, 0.25 g; hydrogen pressure, 30 atm; temperature, 160 °C; solvent, methanol; reaction time, 8 h; and total volume, 20 cm3.
As already discussed, Ag and Pt were used for selective hydrogenation. Mg was used to increase the basicity of the catalyst. However, it was observed that only moderate basicity, which was provided by OMS-2, was needed for selective hydrogenation. For the selective hydrogenation reaction, like C–O and C=C hydrogenation, OMS-2 is a very well known catalyst. As we already know, multiple valencies of Mn such as +2, +4, and +7 play very crucial role in the hydrogenolysis reaction and selective hydrogenation reaction.11−13 The use of Pt has been reported for FFA hydrogenolysis.17,32 Pt in combination with Mg on an OMS-2 support produced intermediates FA (78%) and THFA (15%) over 1,2-PeD (5%). The use of Pd increased the selectivity of 1,2-PeD up to 76% but not more than that of 1% Rh/OMS-2. The selectivity profile was in the order of 1% Rh/OMS-2 (87%) > 1% Pd/OMS-2 (76%) > 30% Ag/OMS-2 (23%).
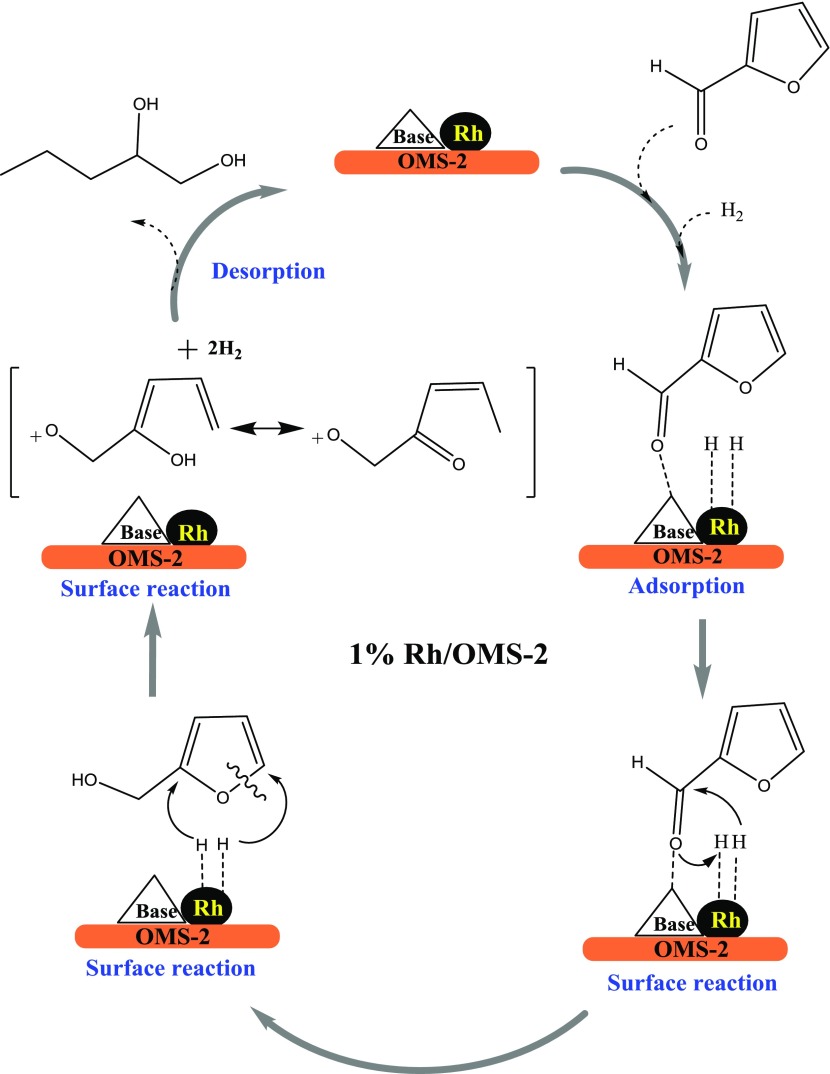
Additionally, the well-dispersed Rh provided metallic sites on the catalyst and synergistically carried out the furan ring-opening reaction, which is further well discussed in CO2-TPD and NH3-TPD analyses as well as in Scheme 2. Hence, the 1% Rh/OMS-2 catalyst was selected for further optimization of various reaction parameters. This catalyst was also compared with previously documented catalysts, and the comparison is presented in Table 1. It can be understood that of all entries, #1–3 showed good conversion but not the selectivity to 1,2-PeD. In the case of other entries such as #4–8, harsh reaction conditions were used. In contrast, the 1% Rh/OMS-2 (entry #10) catalyst used in this study has significantly improved both conversion and selectivity at comparatively mild reaction conditions.
Scheme 2. Proposed Mechanism for Hydrogenolysis of FFA to 1,2-PeD.
Table 1. Catalytic Hydrogenolysis of Various Feedstocks to 1,2-PeD.
| # | catalyst | feed stock | hydrogen pressure (atm) | solvent | T (°C) | t (h) | conversion (%) | selectivity of 1,2-PeD (%) | refs |
|---|---|---|---|---|---|---|---|---|---|
| 1 | Pt/HT | FFA | 30 | 2-PrOH | 150 | 8 | >99 | 73 | (17) |
| 2 | Ru/MnOx | FA | 15 | water | 150 | 4 | 89.2 | 42.1 | (21) |
| 3 | 10Cu–Mg3AlO4.5 | FA | 60 | ethanol | 140 | 24 | >99 | 45.2 | (27) |
| 4 | Pd/MMT-K10 | FFA | 35 | IPA | 220 | 5 | >99 | 66 | (29) |
| 5 | Ru/Al2O3 | FA | 100 | water | 200 | 1 | 100 | 32 | (30) |
| 6 | Cu–Al2O3 | FA | 80 | ethanol | 140 | 8 | 85.8 | 48.1 | (33) |
| 7 | Rh/SiO2 | THFA | 80 | water | 120 | 4 | 5.7 | 61.7 | (34) |
| 8 | Pt/Al2O3 | FFA | 20 | 2-PrOH | 240 | 2 | 43.5 | 33.3 | (31) |
| 9 | Pt/CeO2 | FFA | 30 | 2-PrOH | 165 | 4 | >99.9 | 59.9 | (32) |
| 10 | Rh/OMS-2 | FFA | 30 | methanol | 160 | 8 | 99.6 | 87 | this work |
Catalyst Characterization
X-ray Diffraction
The crystallinity of the catalysts was studied using the X-ray diffraction (XRD) technique (Bruker D8 Advance diffractometer). Cu Kα (λ = 0.154 nm) was used at 2θ value of 5–90°. The diffraction peaks of all synthesized catalysts OMS-2 (α-MnO2), virgin 1% Rh/OMS-2, and reused 1% Rh/OMS-2 showed very sharp peaks (Figure 2). All patterns were found to be identical with JCPDS no. 00-006-0547 (D) (cryptomelane-phase) of MnO2 at various 2θ values: 12.98 (101), 18.38 (002), 28.98 (103̅), 37.74 (112̅), 50.23 (114), 56.39 (413), 60.62 (215). The correct match for Rh (Figure 2B,C) was found to be with JCPDS no. 03-065-2866 (D) for the peaks at 2θ of 41.5, 47.2, and 69.3 due to lattice spacings 111, 200, and 220, respectively. All of the peaks of Rh at 2θ of 41.5, 47.2, and 69.3 are seen overlapping with those of OMS-2 (Figure 2).
Figure 2.
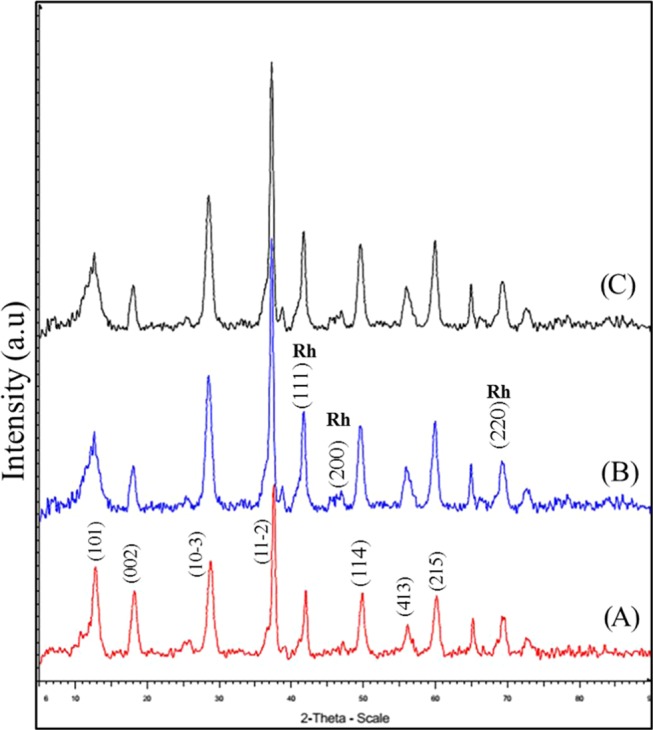
XRD patterns of (A) OMS-2, (B) 1% Rh/OMS-2, and (C) reused 1% Rh/OMS-2.
CO2-TPD and NH3-TPD Analyses
Temperature-programmed desorption (TPD) analysis (AutoChem II 2910, Micromeretics) of OMS-2, 1% Rh/OMS-2, and reused 1% Rh/OMS-2 catalysts was carried out at 50–650 °C (Figure 3a,b). The basic and acidic strengths of the catalysts were evaluated and are mentioned in Table 2. All of the catalysts showed three distinct peaks for CO2-TPD. The OMS-2 catalyst (Figure 3a) showed two combined peaks in the temperature range of 90–500 °C, indicating the presence of weak and moderate basic sites. The sharp peak in the temperature range of 80–300 °C indicated the presence of weak basic sites on both virgin and reused 1% Rh/OMS-2 catalysts, as indicated in Figure 3a-A,B. The increased intensity of weak basic sites may correspond to Rh. Two minor peaks in the temperature ranges of 350–550 and 550–650 °C indicate a few moderate and strong basic sites on the catalysts, respectively.
Figure 3.
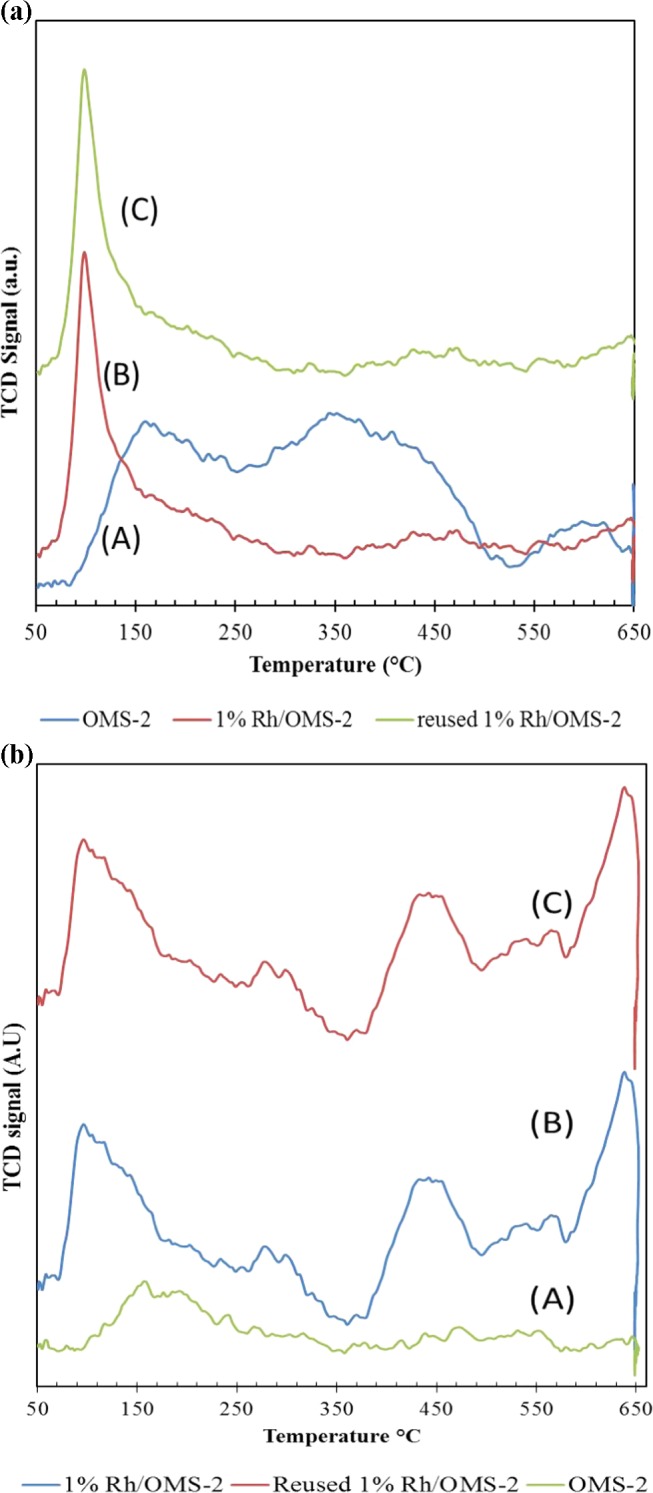
(a) CO2-TPD patterns of catalysts: (A) OMS-2, (B) 1% Rh/OMS-2, and (C) reused 1% Rh/OMS-2. (b) NH3-TPD patterns of catalysts: (A) OMS-2, (B) 1% Rh/OMS-2, and (C) reused 1% Rh/OMS-2.
Table 2. CO2-TPD, NH3-TPD, and TPR Analyses of OMS-2 and Rh-Loaded Catalysts.
| catalyst | CO2-TPD (mmol/gcat) total basicity | NH3-TPD (mmol/gcat) total acidity | TPR (mmol/gcat) |
|---|---|---|---|
| OMS-2 | 0.3 | 0.18 | 5.63 |
| 1% Rh/OMS-2 | 0.11 | 0.22 | 6.68 |
| reused 1% Rh/OMS-2 | 0.095 | 0.20 | 6.08 |
As seen in Figure 3b, a good number of acidic sites are shown by all OMS-2, 1% Rh/OMS-2, and reused 1% Rh/OMS-2 catalysts. The intensity of the peak in the temperature range of 80–300 °C of 1% Rh/OMS-2 and reused 1% Rh/OMS-2 catalysts increased because of incorporation of Rh. The three distinct peaks in the case of 1% Rh/OMS-2 virgin and reused catalysts correspond to weak, moderate, and strong acidic sites of catalysts (Figure 3b). The increased acidity of the catalyst implies incorporation of Rh in the pores of catalysts.
TPR Analysis
Temperature-programmed reduction (TPR) analysis (AutoChem II 2910, Micromeretics) was performed for comprehending efficacy of metallic sites of catalysts. TPR analysis was carried out to check the reducibility of catalysts. The OMS-2 catalyst showed H2 reduction peak in between 50 and 250 °C. Both 1% Rh/OMS-2 and reused 1% Rh/OMS-2 catalysts showed the reduction peak between 150 and 300 °C and another adsorption peak at 490–750 °C (Figure 4), which was because of the strong interaction of Rh above and inside OMS-2 nanorods; this was also supported through TEM analysis. The values obtained in TPR analysis are mentioned in Table 2. It was also seen that the color of the sample was changed from black to brown, which was also one of the indications of a change in the oxidation state to MnO2 as reported by our lab.35
Figure 4.
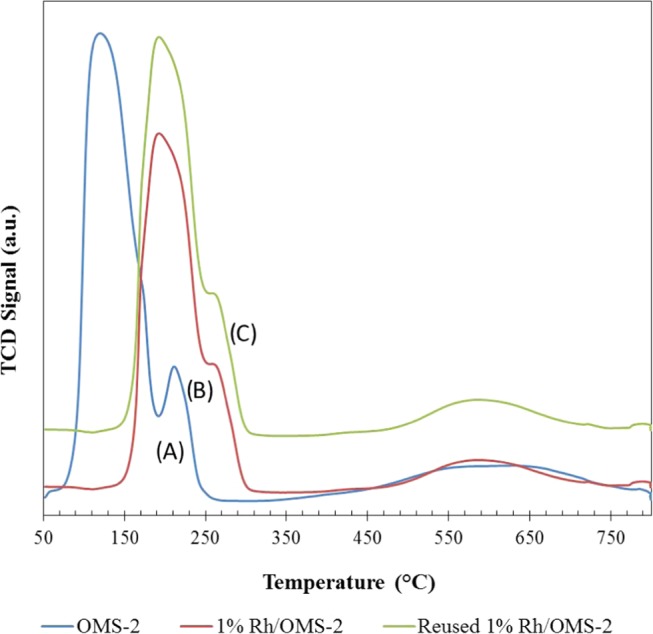
TPR of catalysts: (A) OMS-2, (B) 1% Rh/OMS-2, and (C) reused 1% Rh/OMS-2.
H2 Pulse Chemisorption
H2 pulse chemisorption was performed on a Micromeritics Autochem 2920 instrument to measure the dispersion of Rh over OMS-2 and active surface area. The sample was reduced at 400 °C for 1 h under 10% v/v H2/Ar flow and then cooled to 50 °C. Chemisorption was performed by a pulse of a mixture of 10% v/v H2/Ar. The study showed that Rh dispersion was found to be 14.8% over OMS-2 considering the stoichiometric factor as 1. The value obtained indicates high dispersion of Rh over the OMS-2 catalyst. The average Rh particle size obtained was 6.2 nm (Table 3). The values for metallic surface area and H2 uptake are also mentioned in Table 3.
Table 3. H2 Pulse Chemisorption Analysis.
| catalyst | metallic surface area (m2/g of metal) | metal dispersion (%) | H2 uptake (μmol/g) | particle size (nm) |
|---|---|---|---|---|
| 1% Rh/OMS-2 | 65.2 | 14.8 | 14.4 | 6.2 |
FTIR Studies
FTIR analysis (PerkinElmer, 1000 PC) was done to comprehend the stretching as well as bending vibrations of the catalysts. The catalyst samples were prepared by forming KBr pallets. Figure 5 shows FTIR spectra of all of the catalysts with similar vibrations. The characteristic adsorption bands for all three OMS-2-supported catalysts at 723, 1383, 1633, and 3446 cm–1 were observed.8,36 The signature dominant peak at 1633 cm–1 was due to stretching and bending vibrations of the adsorbed water molecule in the tunnel of OMS-2.35,37 The peak at 1383 cm–1 was because of −OH bending vibrations of adsorbed water. The adsorption band at 723 cm–1 indicated Mn–O and Mn–O–Mn lattice vibrations.38
Figure 5.
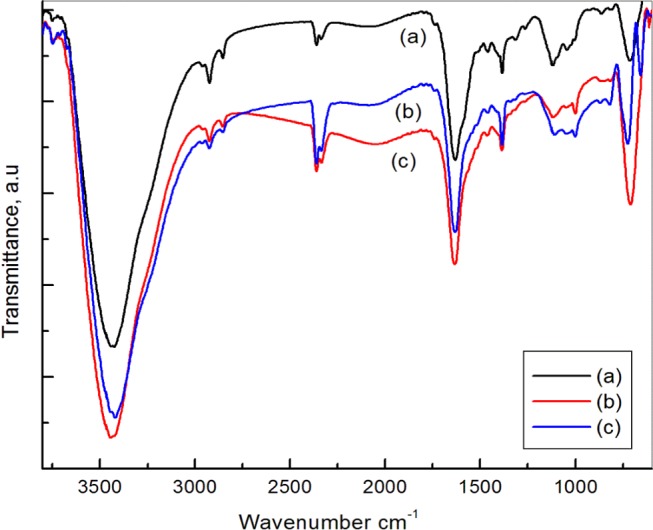
FTIR spectra of (a) OMS-2, (b) reused 1% Rh/OMS-2, and (c) virgin 1% Rh/OMS-2 catalysts.
Raman Spectroscopy
Raman spectra were recorded with a WITec alpha300 R, GmbH, spectrometer, equipped with a 532 nm Ar–Ne laser. The 1% Rh/OMS-2 catalyst represents four distinct peaks located at around 323, 373, 492, and 662 cm–1 (Figure 6). The characteristic sharp peak at 662 cm–1 indicates Mn3O4 of OMS-2. In the case of 1% Rh/OMS-2 catalyst, the peak was sharp, indicating the increased dominance of Mn3O4 species. The bands at 323 and 373 cm–1 are observed because of the active mode of Mn3O4.39 The band at 576 cm–1 corresponds to the stretching mode of Mn–O lattice.40
Figure 6.
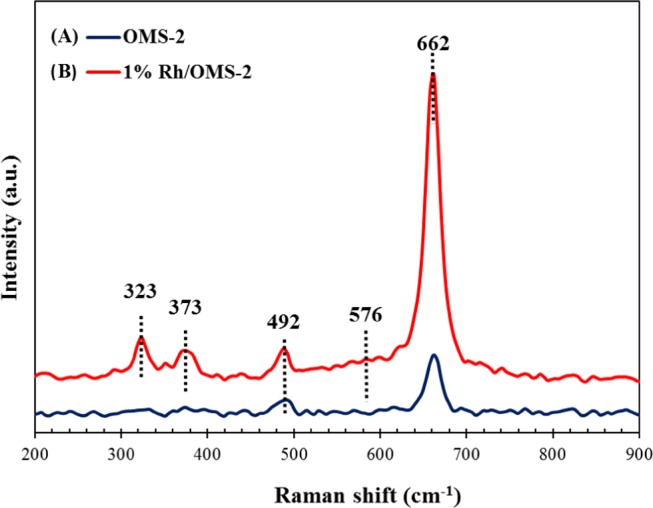
Raman spectra of (A) OMS-2 and (B) 1% Rh/OMS-2 catalysts.
BET Surface Area and Pore Size Analysis
The surface area and pore size distribution measurements were done using the Brunauer–Emmett–Teller (BET) method (Micromeritics ASAP 2010 system). The analysis was carried out at liquid nitrogen temperature using N2 gas as the adsorbent by a multipoint method. Catalyst samples (300 mg) were evacuated at 350 °C for 4 h. The surface area, pore volume, and average pore diameter of OMS-2, 1% Rh/OMS-2, and reused 1% Rh/OMS-2 catalysts were measured and are mentioned in Table 4. The pore volume of the 1% Rh/OMS-2 catalyst decreased, indicating the good dispersion of Rh. There was insignificant decrease in the surface area of reused 1% Rh/OMS-2 from 72 to 63 m2/g, and the average pore diameter decreased from 84 to 79 Å. This may be due to the blockage of the pores of the catalyst by the residuals of the reaction mass after reuse.
Table 4. Surface Area, Pore Volume, and Average Pore Diameter of Catalysts.
| catalyst | surface area (m2/g) | pore volume (cm3/g) | avg. pore diameter (Å) |
|---|---|---|---|
| OMS-2 | 81 | 0.52 | 61 |
| 1% Rh/OMS-2 | 72 | 0.15 | 84 |
| reused 1% Rh/OMS-2 | 63 | 0.15 | 79 |
SEM Analysis
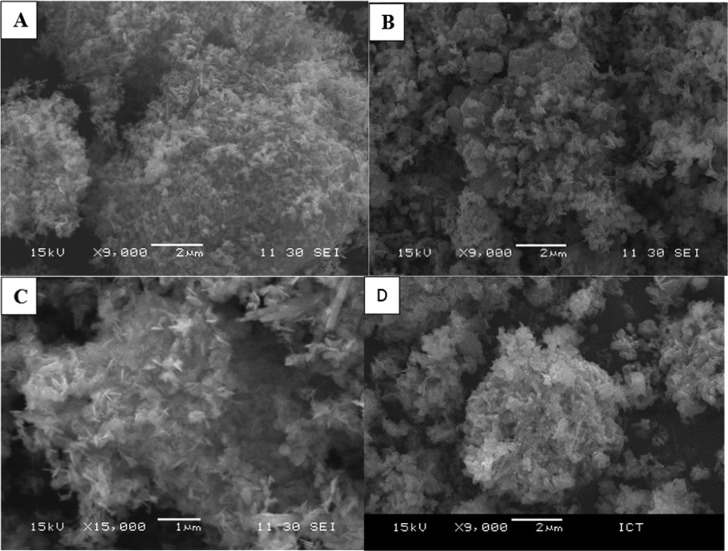
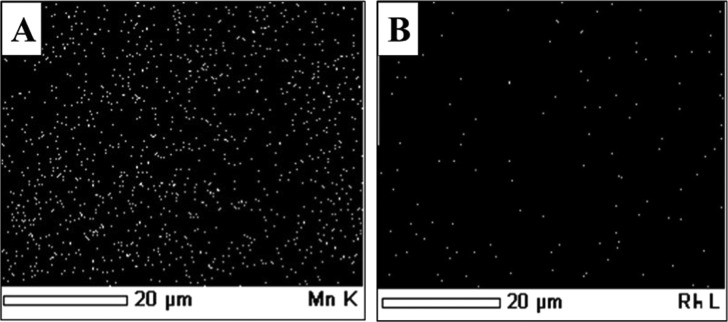
The morphology of the catalysts was studied by means of scanning electron microscopy (SEM), JEOL, model JSM-6380LA, Japan. To ensure proper imaging, the catalyst samples were coated with platinum for 20 s. Cryptomelane type of OMS-2 shows fine and uniform nanorod-like morphology. OMS-2 crystals bundle together, which can be clearly seen in SEM images (Figure 7A,B).41 The 1% Rh/OMS-2 catalyst shows uniform dispersion of Rh over the surface of OMS-2, which was also revealed by energy-dispersive X-ray spectroscopy (EDX) elemental mapping (Figure 8) as well as HR-TEM (Figure 9) analysis.
Figure 7.
SEM analysis of (A) OMS-2 and (B, C) 1% Rh/OMS-2 at different magnifications; (D) reused 1% Rh/OMS-2.
Figure 8.
Elemental mapping of the 1% Rh/OMS-2 catalyst: (A) Mn metal and (B) Rh metal.
Figure 9.
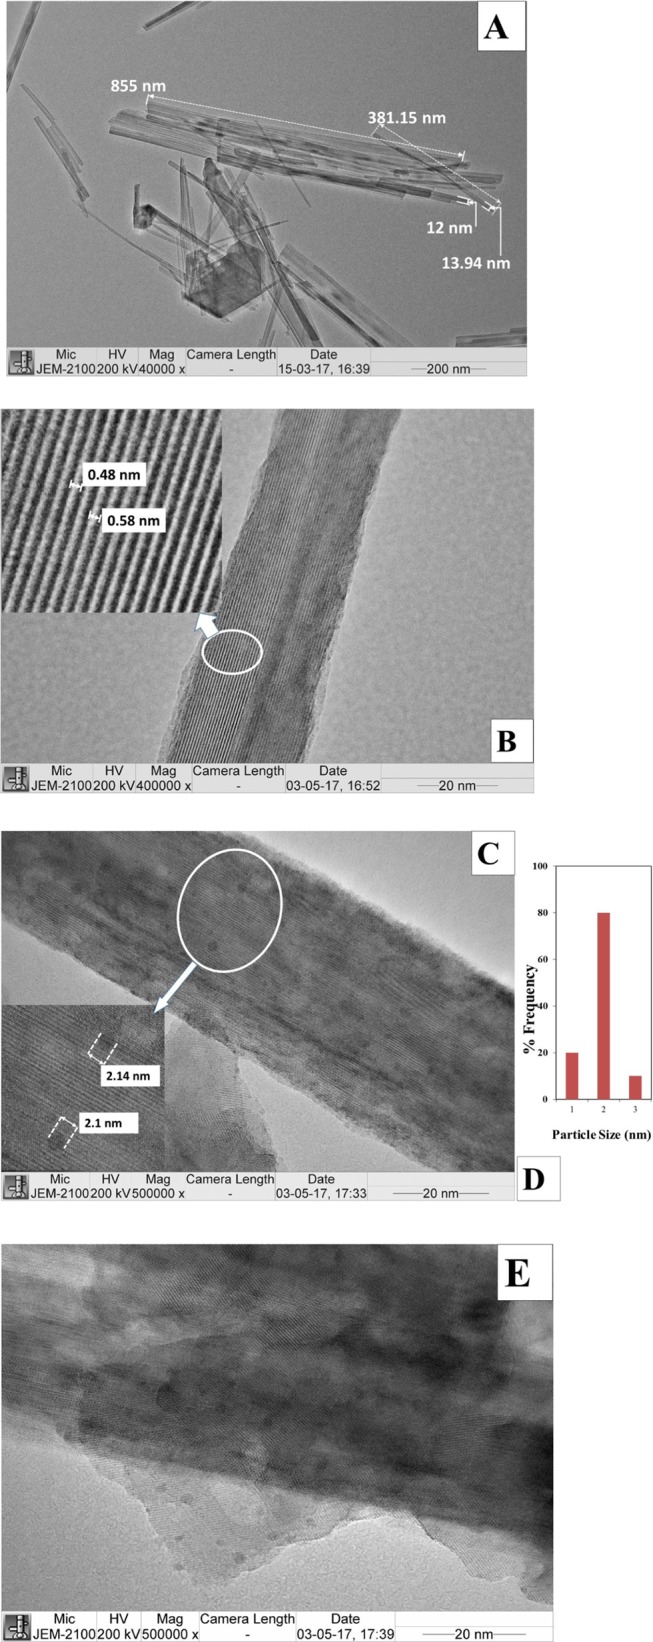
TEM analysis: (A, B) OMS-2 catalysts at different magnifications, (C) 1% Rh/OMS-2 catalyst, (D) particle size distribution of 1% Rh/OMS-2, and (E) reused 1% Rh/OMS-2.
EDX Analysis
Elemental analysis of OMS-2 and 1% Rh/OMS-2 catalyst was carried out using EDAX, and the results are summarized in Table 5. As shown in Table 5, Rh, Mn, and K all were present in the as-synthesized amount of 1% Rh/OMS-2 catalyst. The atomic weight percentage of Rh was 1.17%, which was much close to that of the synthesized 1% Rh/OMS-2 catalyst. Additionally, it was also revealed that the atomic weight ratio of K/Mn of the OMS-2 catalyst was 0.013. In the case of 1% Rh/OMS-2 catalyst, it was 0.001, which was much less than that of OMS-2. This indicates that doped Rh was well deposited over OMS-2 nanorods.
Table 5. EDX Analysis Data for 1% Rh/OMS-2 and OMS-2 Catalysts.
| atomic
weight percentage (%) |
atomic
weight ratio |
|||||
|---|---|---|---|---|---|---|
| catalyst | Rh | Mn | K | O | Rh/Mn | K/Mn |
| 1% Rh/OMS-2 | 1.17 | 98.74 | 0.1 | 22.56 | 0.012 | 0.001 |
| OMS-2 | 98.71 | 1.29 | 22.48 | 0.013 | ||
HR-TEM Analysis
The high-resolution transmission electron microscopy (HR-TEM) characterization technique was performed using a JEOL 2100, Japan, instrument with an accelerating voltage of 200 kV. The samples were prepared by dispersing the material in isopropyl alcohol. A drop of the homogeneous dispersion was loaded on a carbon-coated 200-mesh, copper grid and allowed to dry before analysis. The nanorods were confirmed by HR-TEM analysis, which indicates that the length of nanorods was in the range of 0.8–1 μm and diameter of about 12–14 nm. The well-defined lattice fringes were observed, which indicates that the catalyst is highly crystalline and which supports the XRD. The fringe distance, that is, d-spacing, was measured, and it was found to be 5.3 Å. Figure 9D indicates the average particle size of Rh to be 2 nm. The reused 1% Rh/OMS-2 catalyst showed no deformation in the structure, indicating the stability of the catalyst and that it can be reused.
XPS Analysis
XPS analysis (AXIS Supra, Kratos Analytical, U.K.) was employed to study the surface properties and to identify the elements present in the catalyst. Table 6 represents the percent atomic concentration of each element present in the 1% Rh/OMS-2 catalyst. The Rh 3d3/2 and 3d5/2 peaks with the binding energies of 313.5 and 308.6 eV, respectively, are seen in Figure 10A-a; the Rh 3d peaks at lower binding energies 307.5 and 311.9 eV correspond to the Rh(0) species. The literature value for Rh(0) species appears in the range of 307–307.5 eV and at 311.9 eV and hence confirms the presence of metallic Rh.35−37 The peak maxima at 308.6 and 309.4 eV were due to Rh3+ species, as given in Figure 10A-a,b, respectively. This is also in agreement with the literature value for Rh3+.37 The peak at 304.7 eV is attributed to the 3d level with a different chemical environment.42 As shown in Figure 10B, the two characteristic peaks of Mn 2p3/2 at 641.8 eV and Mn 2p1/2 at 653.2 eV with splitting of 11.4 eV were found to be in good agreement with literature values.43,44 The Mn 2p3/2 peak of 1% Rh/OMS-2 was at 641.8 and 642.6 eV for Mn3+ and Mn4+, respectively.45,46 The additional doublet of Mn 2p1/2 was also observed at 653.2 and 653.8 eV, which correspond to Mn3+ and Mn2+, respectively. The asymmetrical O 1s spectra are shown in Figure 10C, in which a binding energy of 529.2 eV was assigned to the lattice oxygen (O2–) (denoted Olatt). The second peak at 530.7 was assigned to the defect oxide (O– or O22–) or hydroxyl groups.35,45 These results were also in good harmony with those of the TGA–DSC study.
Table 6. XPS Analysis Data of the 1% Rh/OMS-2 Catalyst.
| elements | Mn 2p | Rh 3d | O 1s | K 2p |
|---|---|---|---|---|
| atomic concn (%) | 34.93 | 0.88 | 61.08 | 3.11 |
Figure 10.
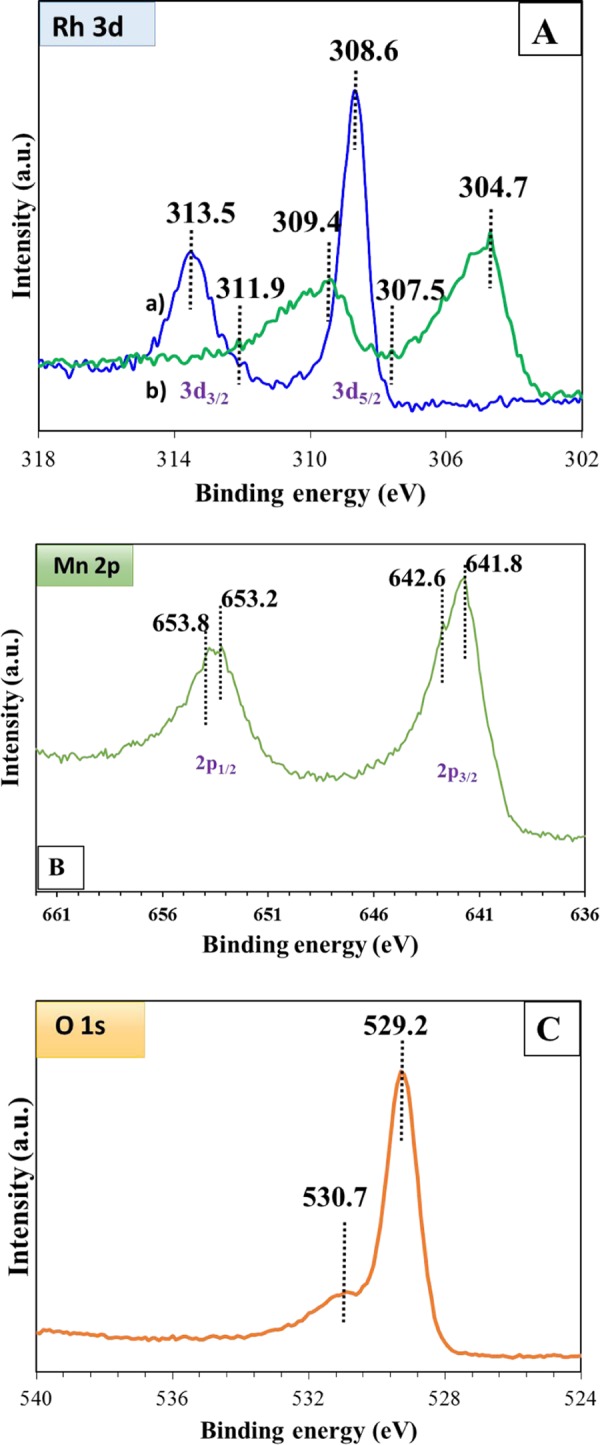
XPS spectra: (A) Rh 3d, (a) oxidized 1% Rh/OMS-2, (b) reduced 1% Rh/OMS-2 and of (B) Mn 2p, and (C) O 1s of the 1% Rh/OMS-2 catalyst.
DSC–TGA Analysis
TGA–DSC was performed on an STA 449 F3 Jupiter, NETZSCH, simultaneous thermal analyzer. The analysis of 1% Rh/OMS-2 catalyst was carried out from 25 to 800 °C with a heating rate of 10 °C/min using a continuous flow of nitrogen. The thermal stability of the 1% Rh/OMS-2 catalyst was observed using DSC–TGA analysis techniques (Figure 11). There was an insignificant weight loss of 3–4%, which indicates the change in the oxidation state of the catalyst from MnO2 to Mn2O3, and further, up to a temperature of 800 °C, no weight loss was observed. The endothermic peak in the region 530–590 °C was because of alteration in the oxidation state of OMS-2 from MnO2 to Mn2O3.35,47,48 Thus, this confirms thermal stability of the catalyst up to 800 °C.
Figure 11.
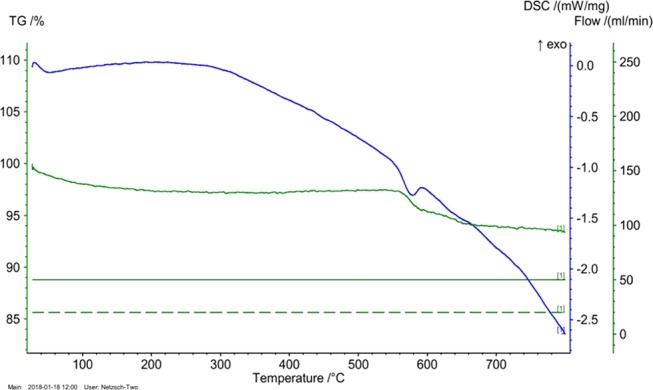
DSC–TGA analysis studies of the 1% Rh/OMS-2 virgin catalyst.
Effect of Different Reaction Parameters
Effect of Speed of Agitation
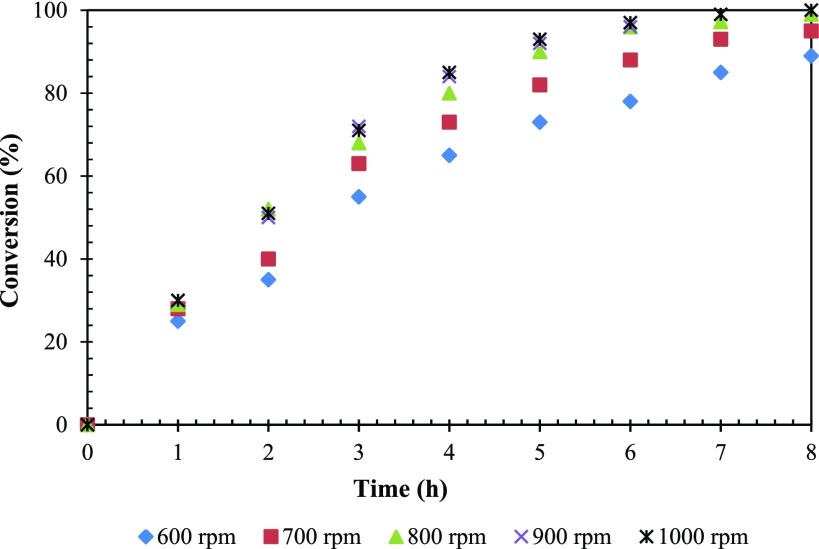
The reaction was carried out at different agitation speeds ranging from 600 to 1000 rpm to study the effect of agitation on the conversion of FFA. It was observed that there was no alteration in the conversion or selectivity of 1,2-PeD, which denotes no mass transfer resistance. Therefore, all of the further studies were carried out at 800 rpm as it was found to be the optimum agitation speed (Figure 12).
Figure 12.
Effect of the speed of agitation on the conversion of FFA. FFA, 0.0073 mol; catalyst wt, 0.25 g; hydrogen pressure, 30 atm; temperature, 160 °C; solvent, methanol; reaction time, 8 h; and total volume, 20 cm3.
Effect of Various Solvents
Solvents including methanol, ethanol, 2-propanol, dioxane, and toluene were used for studying the effect of solvent on the conversion of FFA and 1,2-PeD selectivity. Almost all solvents exhibited good conversion of FFA in 8 h. The rate of hydrogenation is greatly dependent on the solubility as well as polarity reflected in terms of dielectric constant (ε).49,50 A proper combination of H2 pressure and solubility is desirable for a higher rate of hydrogenation. Among all of the solvents used, methanol gives the best result as its dielectric constant (33) is greater than that of ethanol (24.3), 2-propanol (20.2), toluene (2.4), and 1,4-dioxane (2.2). Thus, a remarkable conversion of FFA (99.6%) and selectivity to 1,2-PeD (87%) were observed in methanol as compared to those in other solvents (Tables 7 and 8). Therefore, all of the studies were carried out using methanol as a solvent.
Table 7. Influence of Different Solvents on Hydrogenolysis of Furfurala.
| selectivity (%) |
||||||
|---|---|---|---|---|---|---|
| # | solvents | conversion (%) | FA | THFA | 1,2-PeD | 1,5-PeD |
| 1 | methanol | 99.6 | 12 | 87 | ||
| 2 | ethanol | 95 | 40 | 28 | ||
| 3 | IPA | 85 | 60 | 30 | ||
| 4 | toluene | 92 | 30 | 40 | 8 | 22 |
| 5 | 1,4-dioxane | 90 | 50 | 33 | 10 | 5–7 |
Conditions: FFA, 0.0073 mol; speed of agitation, 800 rpm; catalyst, 0.25 g; hydrogen pressure, 30 atm; temperature, 160 °C; reaction time, 8 h; and total volume, 20 cm3.
Table 8. Values of Rate Constant for Formation of FA (k1) and 1,2-PeD (k2).
| # | T (K) | k1 × 106 (L2/(mol g min)) | k2 × 106 (L2/(mol g min)) |
|---|---|---|---|
| 1 | 403 | 0.03 | 0.0048 |
| 2 | 413 | 0.045 | 0.0113 |
| 3 | 423 | 0.072 | 0.03 |
| 4 | 433 | 0.09 | 0.056 |
| 5 | 443 | 0.12 | 0.1128 |
Effect of Metal Loading
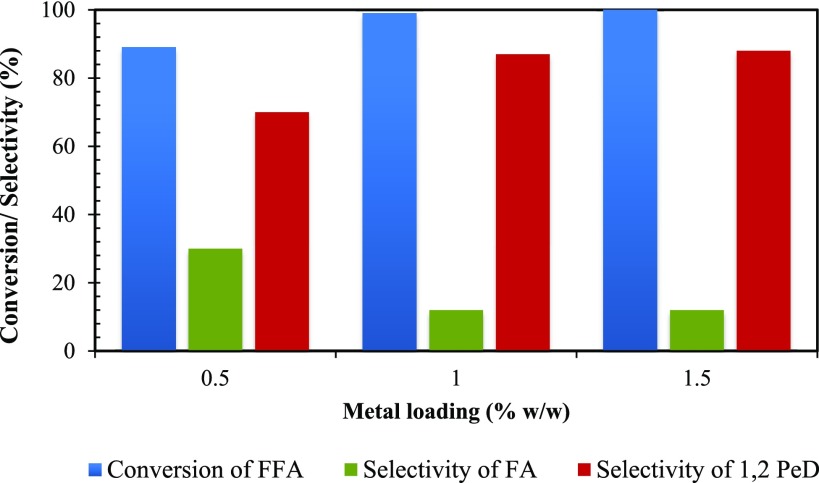
The effect of rhodium loadings of 0.5, 1, and 1.5% w/w on OMS-2 supported catalyst was studied keeping other reaction parameters constant (Figure 13). The rate of hydrogenation was in direct proportion with Rh loading, i.e., an increase in Rh loading increases the conversion and selectivity. Because it is a series reaction, both conversion and selectivity were affected with an increase in Rh loading. Initially, with an increase in Rh loading from 0.5 to 1% w/w, the number of metal sites increased and hence both conversion of FFA and 1,2-PeD selectivity were also improved. At Rh loadings of 1 and 1.5%, the conversion of FFA was increased because of the proportional increase in the number of active sites; however, no change in the selectivity of 1,2-PeD was observed. Therefore, 1% Rh loading was preferred for further studies.
Figure 13.
Effect of metal (Rh) loading on conversion of FFA and selectivity of 1,2-PeD. FFA, 0.0073 mol; speed of agitation, 800 rpm; catalyst weight, 0.25 g; hydrogen pressure, 30 atm; temperature, 160 °C; solvent, methanol; reaction time 8 h; and total volume, 20 cm3.
Effect of Catalyst Loading
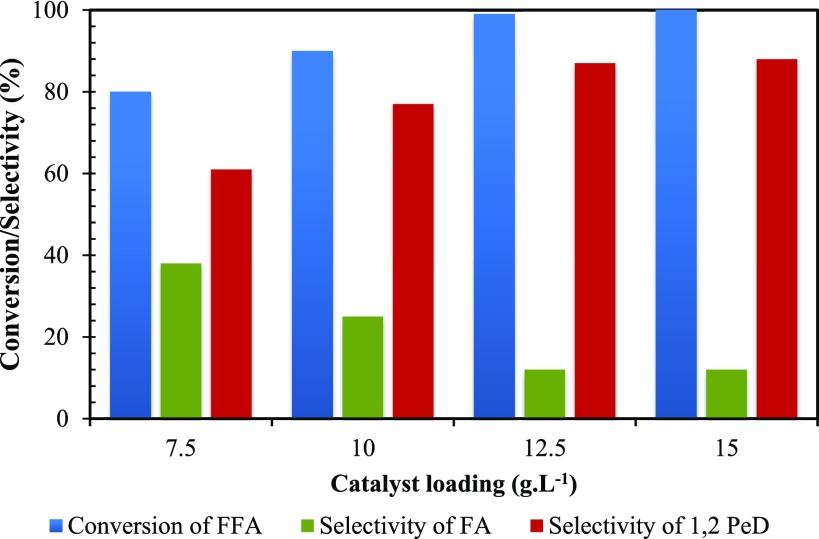
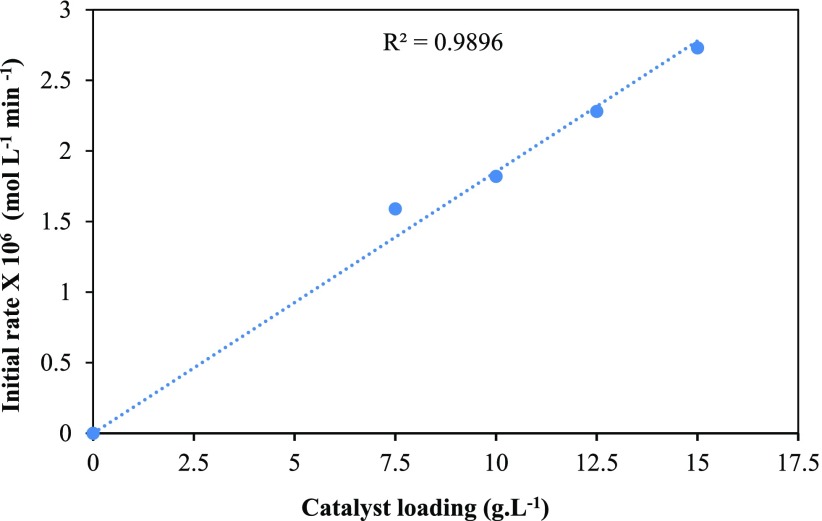
The effect of catalyst loading was comprehensively studied by altering the quantity of catalyst from 7.5 to 15 g/L (Figure 14). Initially, the rate of reaction was proportional to the amount of catalyst because of the proportional increase in the number of active sites. At 12.5 and 15 g/L catalyst loading, neither the conversion nor the selectivity was affected. This indicates that the number of active sites was sufficient and any more catalyst concentration was not needed. This confirms that the rate of reaction was directly proportional to the number of active sites in the absence of mass transfer and intraparticle diffusion resistance. Additionally, the initial rate of hydrogenation of FFA was plotted against catalyst loading. It was observed that with an increase in catalyst loading the rate of reaction was also increased (Figure 15). Hence, it shows that there is a linear relation between catalyst loading and rate of reaction.
Figure 14.
Effect of catalyst loading on conversion of FFA and selectivity of 1,2-PeD. FFA, 0.0073 mol; speed of agitation, 800 rpm; hydrogen pressure, 30 atm; temperature, 160 °C; solvent, methanol; reaction time, 8 h; and total volume, 20 cm3.
Figure 15.
Plot of initial rate vs catalyst loading.
Effect of Initial Concentration of FFA
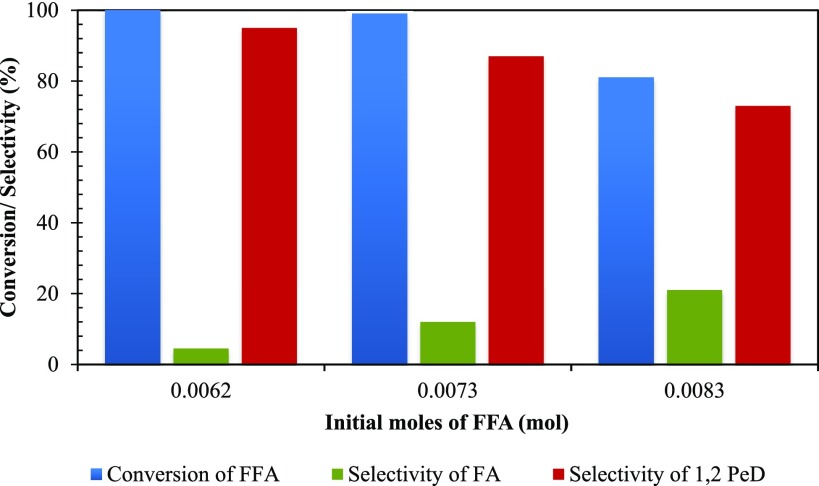
The amount of furfural was varied from 0.0062 to 0.0083 mol to study its effect on the conversion of FFA and selectivity of 1,2-PeD. It was observed that with an increase in furfural concentration the final conversion and selectivity of 1,2-PeD decreased. As the catalyst loading remains constant throughout the study, the number of available metal active sites on the catalyst surface is limited. Hence, with the increase in initial moles of furfural, a decrease in the conversion level was observed. The rate of formation of FA is much higher than that of 1,2-PeD; consequently, with the increase in the initial moles of the substrate, increase in FA selectivity is observed. At 0.0073 mol concentration, after 8 h, 99% conversion and 87% selectivity were obtained (Figure 16).
Figure 16.
Effect of initial concentration of FFA on conversion of FFA and selectivity of 1,2-PeD. Speed of agitation, 800 rpm; catalyst weight, 0.25 g; hydrogen pressure, 30 atm; temperature, 160 °C; solvent, methanol; reaction time, 8 h; and total volume, 20 cm3.
Effect of Hydrogen Pressure
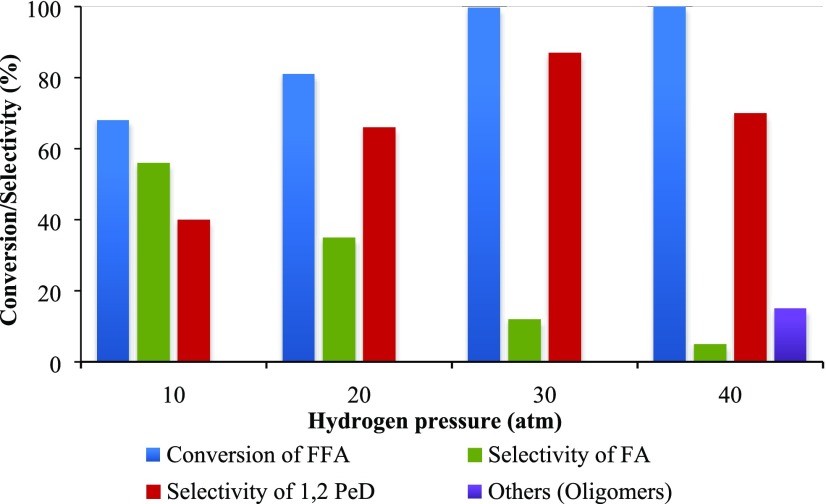
The hydrogen pressure was varied from 10 to 40 atm to evaluate its effect on the conversion of FFA and selectivity of 1,2-PeD. As shown in Figure 17, it was observed that the hydrogenation of FFA to FA and its subsequent hydrogenation finally into 1,2-PeD appear to be greatly dependent on hydrogen pressure, and with an increase in the hydrogen pressure, there was a remarkable increase in conversion. The selectivity of FA (intermediate) decreased as the pressure was increased, which is caused by the equivalent increase in the concentration of dissolved hydrogen in the liquid phase. This leads to successive hydrogenation of FA to 1,2-PeD. However, an increase in pressure beyond 30 atm leads to a decrease in selectivity of 1,2-PeD as the latter was because of the formation of oligomers over hydrogenated products.51 Hence, maintaining adequate pressure is crucial to ensure high selectivity of 1,2-PeD. Therefore, optimum hydrogen pressure, i.e., 30 atm, was maintained for all of the experiments.
Figure 17.
Effect of hydrogen pressure on conversion of FFA and on the selectivity of products. FFA, 0.0073 mol; speed of agitation, 800 rpm; catalyst wt, 0.25 g; temperature, 160 °C; reaction time, 8 h; and total volume, 20 cm3.
Effect of Temperature
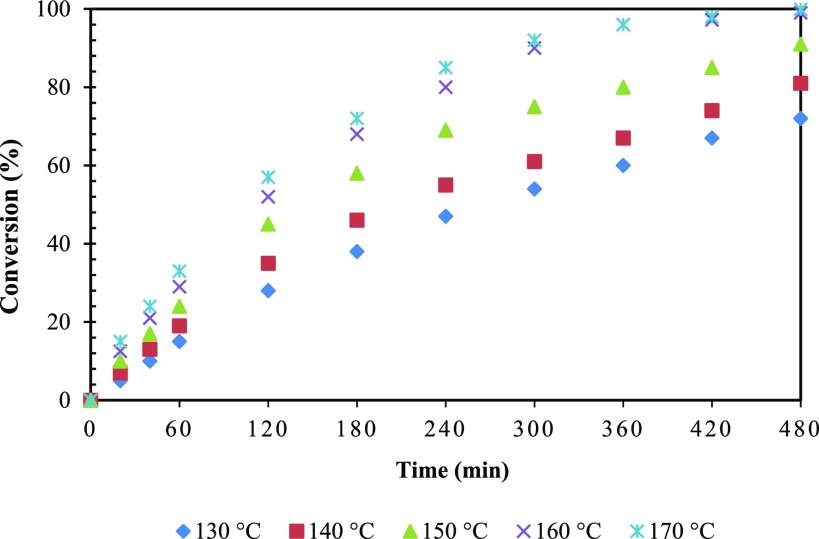
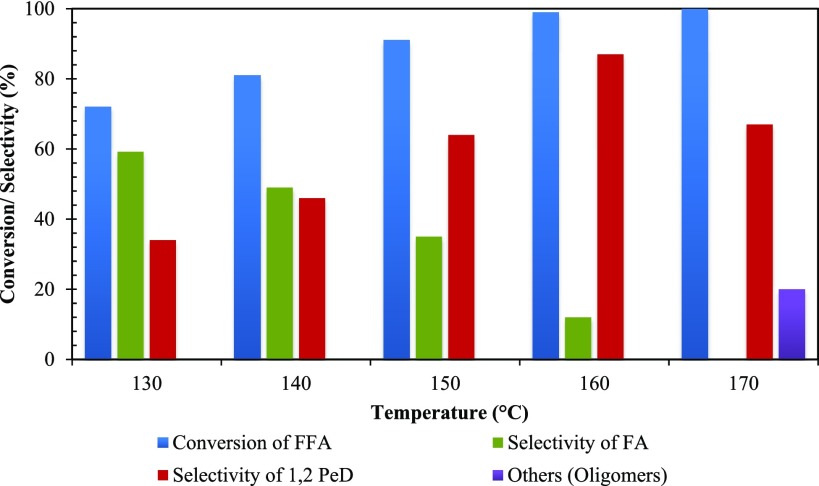
The effect of temperature on the rate of reaction was studied from 130 to 170 °C (Figures 18 and 19). The conversion increased with an increase in reaction temperature. Thus, this indicates that the reaction was intrinsically kinetically controlled. At reaction temperatures of 160 and 170 °C, it was observed that the conversion remains practically the same, indicating that there was significant intraparticle diffusion limitation. Therefore, 160 °C was chosen as the optimum temperature (Figure 18). As shown in Figure 18, the selectivity of 1,2-PeD increased with an increase in temperature. However, with a further increase in temperature (above 160 °C), oligomers of high molecular weight were formed and selectivity of 1,2-PeD dropped significantly. The selectivity of products FA and 1,2-PeD is provided for optimizing the reaction time (Figure S5).
Figure 18.
Effect of temperature on conversion of FFA. FFA, 0.0073 mol; speed of agitation, 800 rpm; catalyst weight, 0.25 g; hydrogen pressure, 30 atm; solvent, methanol; reaction time, 8 h; and total volume, 20 cm3.
Figure 19.
Effect of temperature on conversion of FFA and selectivity of 1,2-PeD. FFA, 0.0073 mol; catalyst weight, 0.25 g; speed of agitation, 800 rpm; hydrogen pressure, 30 atm; solvent, methanol; reaction time, 8 h; and total volume, 20 cm3.
Catalyst Reusability and Leaching Study
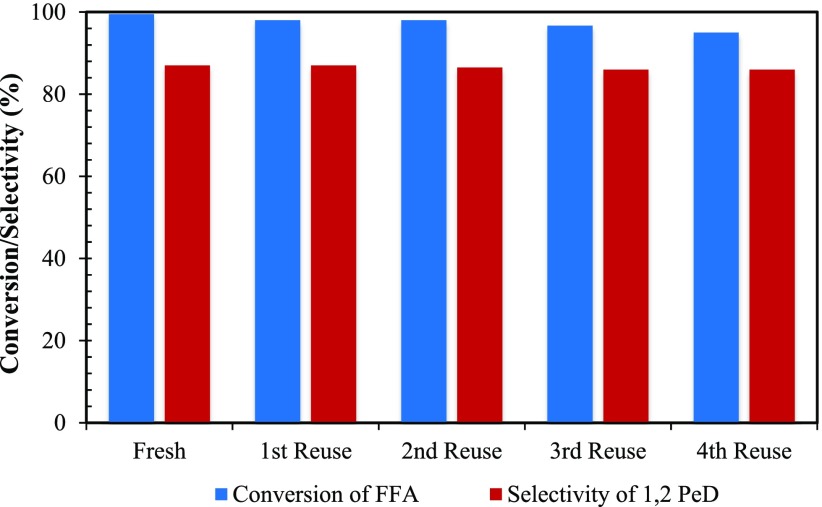
The reusability of the Rh/OMS-2 catalyst was studied for four cycles (Figure 20). The catalyst was filtered, and the filtrate containing products was collected. The recovered catalyst was washed with methanol and dried for 3 h to ensure removal of any adsorbed species from the catalyst pores. A total weight of 0.25 g was maintained in all of the reusability experiments by adding the difference of the catalyst weight from the previous run. There was a marginal drop in the conversion, indicating that the catalyst was active, selective, and reusable. A hot filtration test was also performed for catalyst stability. The agitation was stopped after 1 h, and the reaction mass filtered to remove the catalyst. The clear filtrate (reaction mass) was continuously agitated for next 4 h. It was observed that there was no change in the conversion, and also there was no leaching of the catalyst in the filtrate containing the reactants. Thus, this confirms almost negligible leaching of active Rh sites. Inductively coupled plasma-atomic emission spectroscopy analysis of reaction mass was carried out to find that the leaching of rhodium was below the detection level.
Figure 20.
Reusability of the catalyst. FFA, 0.0073 mol; speed of agitation, 800 rpm; catalyst, 0.25 g; hydrogen pressure, 30 atm; temperature, 160 °C; solvent, methanol; reaction time, 8 h; and total volume, 20 cm3.
Kinetics of Hydrogenolysis of FFA
Hydrogenolysis of FFA leads to 1,2-PeD through a series of reactions (Scheme 2). At the very beginning, hydrogen is adsorbed dissociatively on the metallic site of the catalyst and the aldehyde group was weakly adsorbed on the basic site. For hydrogenolysis, the basic sites of the OMS-2 support were found to be outstanding and the symbiotic relation of the evenly dispersed nanoparticles of Rh leads to diol formation. Similar observations with Pt loading on a basic support were found by Mizugaki et al.17 Rh helps in aromatic-ring-opening hydrogenation reactions.52 During the surface reaction, the aldehyde group is hydrogenated, resulting in the formation of a hydroxyl group, subsequently, forming FA as an intermediate (Figure S1, Supporting Information (SI)). Subsequently, the furan ring gets hydrogenated and ring opening occurs to form 1,2-PeD through tautomerism of the intermediate species as reported by Chen et al.27 Finally, 1,2-PeD gets desorbed and both basic and metallic sites again remain available for the next reaction cycle.
Development of Mathematical Model
From Schemes 1 and 2, a detailed mathematical model was deduced for hydrogenolysis of FFA. The mathematical model was developed considering the LHHW mechanism (dual site).53 A similar kinetic model was already studied in our lab.54 The rates at various steps of the hydrogenation reactions are mentioned here (SI). The rate of consumption of FFA (A) in the hydrogenation reaction can be given as:
| 1 |
The rate of reaction of B (FA) to E (1,2-PeD) can be written as
| 2 |
The rate of formation of E can be written as:
| 3 |
where w is the catalyst loading, 12.5 g/L.
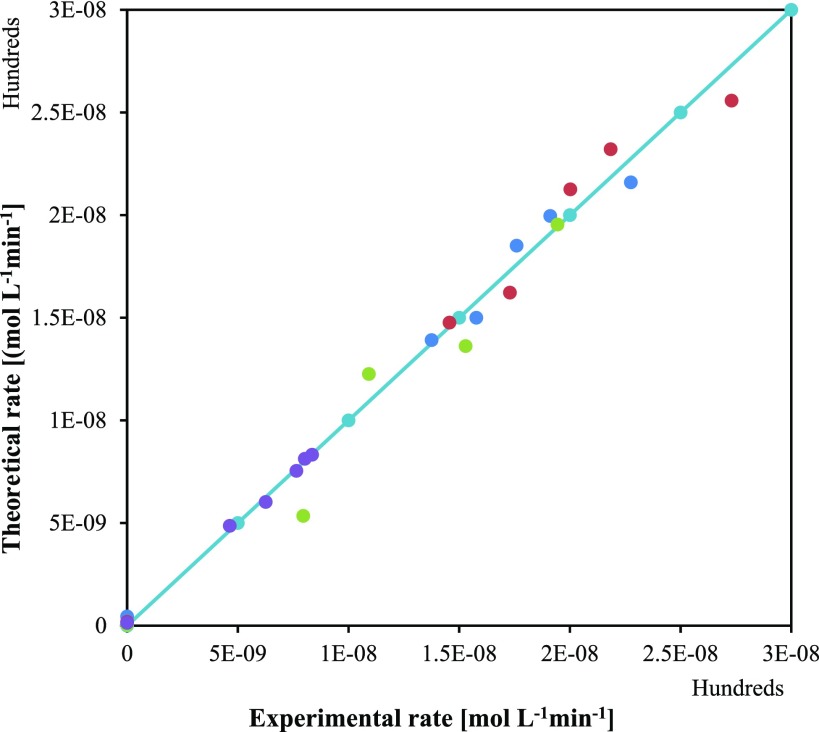
After solving eqs 1–3, adsorption constants (K) along with rate constant (k) were calculated. The values of K are mentioned in Table S1 whereas k values are given in Table 8. With the help of the Arrhenius plot, activation energy for each step was calculated for 12.3 and 27.6 kcal/mol for formation of FA and 1,2-PeD, correspondingly. The formation of FA at low temperature indicates low activation energy requirements. As per the calculations, the concentration of 1,2-PeD increases with an increase in temperature because it has higher activation energy. The parity plot for the initial rate of reaction was also calculated and is shown in Figure 21. The predicted and experimental rate values were plotted over a parity. Both rate expressions are in good agreement with experimental data.
Figure 21.
Parity plot of theoretical vs experimental rate at optimized reaction parameters.
Conclusions
OMS-2-supported heterogeneous catalysts were successfully prepared by the hydrothermal technique. Rh in synergy with the OMS-2 support sets the new benchmark for selective hydrogenolysis of furfural and the furan ring-opening reaction. The basic support aids faster hydrogenolysis of FFA to give 1,2-PeD in a single step. The conversion of FFA was 99.6% with a significant selectivity of 1,2-PeD of 87%. Various reaction parameters were studied to optimize the reaction conditions for FFA hydrogenolysis. The reaction mechanism and kinetics were studied on the basis of a dual-site LHHW mechanism. The activation energies were evaluated for formation of FA and 1,2-PeD and were found to be 12.3 and 27.6 kcal/mol, respectively. The catalyst was prepared, characterized, and reused for the hydrogenolysis reaction of FFA up to four cycles with insignificant change in the conversion and selectivity. The structural integrity of the 1% Rh/OMS-2 catalyst in virgin and reused states was confirmed by characterization techniques. In a nutshell, a bifunctional 1% Rh/OMS-2 catalyst shows excellent activity, selectivity, stability, and reusability. This process is novel and green.
Experimental Section
Chemicals
All of the chemicals were purchased from reputed vendors. Furfural was purchased from S D Fine Chemicals, Mumbai, India. Solvents and precursors such as methanol, isopropyl alcohol (2-PrOH), ethanol, toluene, 1,4-dioxane, potassium permanganate, magnesium nitrate hexahydrate, and rhodium trichloride were procured from Thomas Baker, Mumbai. Manganese nitrate hexahydrate, aluminum nitrate nonahydrate, palladium nitrate hydrate, silver nitrate, and hexachloro-palatinate (of high-performance liquid chromatography grade) were purchased from Sigma-Aldrich, India.
Catalyst Preparation
In general, in the catalyst synthesis method,7 precursor manganese nitrate (26 mmol) was dissolved in 50 mL of distilled water to form solution A. An aqueous permanganate solution B was prepared by dissolving KMnO4 (18.4 mmol) into 50 mL of distilled water. The solution B was added dropwise to solution A with vigorous stirring. After addition, the mixture was stirred for next 30 min. It was transferred to a Teflon-lined hydrothermal stainless steel reactor. This reactor was then kept in oven at the required temperature for a specific period. To obtain a suspension, it was allowed to cool down to room temperature. This suspension was washed with distilled water several times. It was then centrifuged and dried at 120 °C for 24 h.
Metal Loading
Rh (1% w/w) was supported on OMS-2 by the impregnation method as reported in our lab.35 OMS-2 was well dispersed in a beaker containing water, using a magnetic stirrer. In another beaker, solution of RhCl3·3H2O was prepared, which was then added dropwise to a beaker containing OMS-2 with vigorous stirring. This solution was then stirred for next 6 h to remove any excess water, which was evaporated at 60 °C. The mass was dried at 120 °C for 12 h, followed by calcination at 450 °C for 4 h.
Catalytic Reactions
Experiments were carried out in a reactor of 50 mL capacity (Autoclave Engineers, Mumbai) provided with a Rushton-type turbine impeller, pressure gauge, speed regulator, and temperature controller. Prior to reaction, the catalyst sample was freshly reduced using hydrogen at 40 atm for 2 h. In a typical experiment, 0.0073 mol of furfural was charged into the reactor along with 20 mL of methanol as a solvent and 50 μL of n-dodecane as an internal standard. The required amount of catalyst was charged in the reactor, and the reactor was purged three times with nitrogen and then by hydrogen. The reactor was then pressurized with hydrogen at desired pressure, which was kept constant throughout the studies. Once the desired temperature and pressure were obtained, the reaction was carried out for 8 h and the samples were withdrawn periodically and analyzed.
Analytical Method
Samples were analyzed by gas chromatography (GC, Chemito 1000), and the instrument was equipped with a DB-5HT capillary column (0.10 μm × 0.25 mm × 30 m with 5% (phenyl)-methylpolysiloxane packing) and FID. The product, 1,2-PeD, was confirmed after matching the residence time of the standard using GC–mass spectrometry (MS), with capillary column TG-5MS, Thermo Scientific Trace 1300 ISQ LT (SI, Figure S1). The gas-phase analysis was performed using a GC 8610 unit equipped with a Hayesep DB packed column. A thermal conductivity detector was used for detecting H2, CH4, CO2, CO, C2H6, etc. Nitrogen was used as a carrier gas (SI, Figure S3).
Acknowledgments
D.S.P. acknowledges the University Grants Commission (UGC) for the award of a BSR Senior Research Fellowship under its Green technology program. G.D.Y. acknowledges support from the Endowments for R. T. Mody Distinguished Professor, the Tata Chemicals Darbari Seth Distinguished Professor of Leadership and Innovation, and also J. C. Bose National Fellowship of the Department of Science and Technology, Government of India.
Glossary
- A
furfural
- B
furfuryl alcohol
- CA
concentration of A (mol/L or M)
- CB
concentration of B (M)
- CD
concentration of D (M)
- CE
concentration of E (M)
- D
intermediate species
- E
1,2-pentanediol (1,2-PeD)
- k
reaction rate constant
- K
equilibrium constant for the adsorption of different species (L/mol)
- KH
equilibrium constant for the adsorption reaction of hydrogen (L/mol)
- M
mol/L
- PH2
partial pressure of hydrogen (atm)
- –r
rate of surface reaction (M/min)
- w
catalyst loading (g/L)
- EDX
energy-dispersive X-ray spectroscopy
- FFA
furfural
- FA
furfuryl alcohol
- THFA
tetrahydrofurfuryl alcohol
- 1,2-PeD
1,2-pentanediol
- 1,5-PeD
1,5-pentanediol
Supporting Information Available
The Supporting Information is available free of charge on the ACS Publications website at DOI: 10.1021/acsomega.8b01595.
Characterization data including GCMS analysis, concentration profile of conversion of FFA, selectivity of products, demonstration of the structure of active sites; kinetic parameters including the mathematical model for hydrogenolysis; adsorption constants of different species; and reaction of THFA over 1% Rh/OMS-2 catalyst (PDF)
The authors declare no competing financial interest.
Supplementary Material
References
- Jiang C. H.; Dou S. X.; Liu H. K.; Ichihara M.; Zhou H. S. Synthesis of Spinel LiMn2O4 Nanoparticles through One-Step Hydrothermal Reaction. J. Power Sources 2007, 172, 410–415. 10.1016/j.jpowsour.2007.07.039. [DOI] [Google Scholar]
- Nogami M.; Maeda T.; Uma T. A Methanol Gas Sensor Based on Inorganic Glass Thin Films. Sens. Actuators, B 2009, 137, 603–607. 10.1016/j.snb.2009.01.067. [DOI] [Google Scholar]
- Rasul S.; Suzuki S.; Yamaguchi S.; Miyayama M. Manganese Oxide Octahedral Molecular Sieves as Insertion Electrodes for Rechargeable Mg Batteries. Electrochim. Acta 2013, 110, 247–252. 10.1016/j.electacta.2013.06.094. [DOI] [Google Scholar]
- Lee S. W.; Kim J.; Chen S.; Hammond P. T.; Shao-Horn Y. Carbon Nanotube/Manganese Oxide Ultrathin Film Electrodes for Electrochemical Capacitors. ACS Nano 2010, 4, 3889–3896. 10.1021/nn100681d. [DOI] [PubMed] [Google Scholar]
- Sithambaram S.; Kumar R.; Son Y. C.; Suib S. L. Tandem Catalysis: Direct Catalytic Synthesis of Imines from Alcohols Using Manganese Octahedral Molecular Sieves. J. Catal. 2008, 253, 269–277. 10.1016/j.jcat.2007.11.006. [DOI] [Google Scholar]
- Iyer A.; Del-Pilar J.; King’ondu C. K.; Kissel E.; Garces H. F.; Huang H.; El-Sawy A. M.; Dutta P. K.; Suib S. L. Water oxidation catalysis using amorphous manganese oxides, octahedral molecular sieves (OMS-2), and octahedral layered (OL-1) manganese oxide structures. J. Phys. Chem. C 2012, 116, 6474–6483. 10.1021/jp2120737. [DOI] [Google Scholar]
- Ho P. H.; Lee S. C.; Kim J.; Lee D.; Woo H. C. Properties of a Manganese Oxide Octahedral Molecular Sieve (OMS-2) for Adsorptive Desulfurization of Fuel Gas for Fuel Cell Applications. Fuel Process. Technol. 2015, 131, 238–246. 10.1016/j.fuproc.2014.11.019. [DOI] [Google Scholar]
- Qiu G.; Huang H.; Dharmarathna S.; Benbow E.; Sta L.; Suib S. L.. Hydrothermal Synthesis of Manganese Oxide Nanomaterials and Their Catalytic and Electrochemical Properties Chem. Mater. 2011, 3892−3901 10.1021/cm2011692. [DOI]
- Ding Y.; Shen X.; Sithambaram S.; Gomez S.; Kumar R.; Crisostomo V. M. B.; Suib S. L.; Aindow M. Synthesis and Catalytic Activity of Cryptomelane-Type Manganese Dioxide Nanomaterials Produced by a Novel Solvent-Free Method. Chem. Mater. 2005, 5382–5389. 10.1021/cm051294w. [DOI] [Google Scholar]
- Özacar M.; Poyraz A. S.; Genuino H. C.; Kuo C. H.; Meng Y.; Suib S. L. Influence of Silver on the Catalytic Properties of the Cryptomelane and Ag-Hollandite Types Manganese Oxides OMS-2 in the Low-Temperature CO Oxidation. Appl. Catal., A 2013, 462–463, 64–74. 10.1016/j.apcata.2013.04.027. [DOI] [Google Scholar]
- Yadav G. D.; Mewada R. K. Selective Hydrogenation of Acetophenone to 1-Phenyl Ethanol over Nanofibrous Ag-OMS-2 Catalysts. Catal. Today 2012, 198, 330–337. 10.1016/j.cattod.2012.06.028. [DOI] [Google Scholar]
- Yadav G. D.; Chandan P. A.; Tekale D. P. Hydrogenolysis of Glycerol to 1,2-Propanediol over Nano-Fibrous Ag-OMS-2 Catalysts. Ind. Eng. Chem. Res. 2012, 51, 1549–1562. 10.1021/ie200446y. [DOI] [Google Scholar]
- Manyar H. G.; Yang B.; Daly H.; Moor H.; Mcmonagle S.; Tao Y.; Yadav G. D.; Goguet A.; Hu P.; Hardacre C. Selective Hydrogenation of Alpha,beta-Unsaturated Aldehydes and Ketones Using Novel Manganese Oxide and Platinum Supported on Manganese Oxide Octahedral Molecular Sieves as Catalysts. ChemCatChem 2013, 5, 506–512. 10.1002/cctc.201200447. [DOI] [Google Scholar]
- Nakagawa Y.; Takada K.; Tamura M.; Tomishige K. Total Hydrogenation of Furfural and 5-Hydroxymethylfurfural over Supported Pd-Ir Alloy Catalyst. ACS Catal. 2014, 4, 2718–2726. 10.1021/cs500620b. [DOI] [Google Scholar]
- Nakagawa Y.; Tomishige K. Production of 1,5-Pentanediol from Biomass via Furfural and Tetrahydrofurfuryl Alcohol. Catal. Today 2012, 195, 136–143. 10.1016/j.cattod.2012.04.048. [DOI] [Google Scholar]
- Ma R.; Wu X.-P.; Tong T.; Shao Z.-J.; Wang Y.; Liu X.; Xia Q.; Gong X.-Q. The Critical Role of Water in the Ring Opening of Furfural Alcohol to 1,2-Pentanediol. ACS Catal. 2016, 333–337. 10.1021/acscatal.6b02845. [DOI] [Google Scholar]
- Mizugaki T.; Yamakawa T.; Nagatsu Y.; Maeno Z.; Mitsudome T.; Jitsukawa K.; Kaneda K. Direct Transformation of Furfural to 1,2-Pentanediol Using a Hydrotalcite-Supported Platinum Nanoparticle Catalyst. ACS Sustainable Chem. Eng. 2014, 2, 2243–2247. 10.1021/sc500325g. [DOI] [Google Scholar]
- Agostini, I. and Cupferman, S. L’Oreal SA, Cosmetic composition comprising an aqueous dispersion of film-forming polymer particles containing 1, 2-pentanediol. U.S. Patent 6,296,858; 2001.
- Koch O.; Köckritz A.; Kant M.; Martin A.; Schöning A.; Armbruster U.; Bartoszek M.; Evert S.; Lange B.; Bienert R.. Method for Producing 1, 2-Pentanediol. U.S. Patent US8921617; Symrise AG, 2014.
- Nakagawa Y.; Tamura M.; Tomishige K. Catalytic Reduction of Biomass-Derived Furanic Compounds with Hydrogen. ACS Catal. 2013, 2655–2668. 10.1021/cs400616p. [DOI] [Google Scholar]
- Zhang B.; Zhu Y.; Ding G.; Zheng H.; Li Y. Selective Conversion of Furfuryl Alcohol to 1,2-Pentanediol over a Ru/MnOx Catalyst in Aqueous Phase. Green Chem. 2012, 14, 3402–3409. 10.1039/c2gc36270h. [DOI] [Google Scholar]
- Tomishige K.; Nakagawa Y.; Tamura M. Selective Hydrogenolysis and Hydrogenation Using Metal Catalysts Directly Modified with Metal Oxide Species. Green Chem. 2017, 19, 2876–2924. 10.1039/C7GC00620A. [DOI] [Google Scholar]
- Tomishige K.; Tamura M.; Nakagawa Y. Role of Re Species and Acid Cocatalyst on Ir-ReOx/SiO2 in the C-O Hydrogenolysis of Biomass-Derived Substrates. Chem. Rec. 2014, 14, 1041–1054. 10.1002/tcr.201402026. [DOI] [PubMed] [Google Scholar]
- Liu S.; Amada Y.; Tamura M.; Nakagawa Y.; Tomishige K. One-Pot Selective Conversion of Furfural into 1,5-Pentanediol over a Pd-Added Ir-ReOx/SiO2 Bifunctional Catalyst. Green Chem. 2014, 16, 617–626. 10.1039/C3GC41335G. [DOI] [Google Scholar]
- Liu S.; Amada Y.; Tamura M.; Nakagawa Y.; Tomishige K. Performance and Characterization of Rhenium-Modified Rh-Ir Alloy Catalyst for One-Pot Conversion of Furfural into 1,5-Pentanediol. Catal. Sci. Technol. 2014, 4, 2535–2549. 10.1039/C4CY00161C. [DOI] [Google Scholar]
- Koso S.; Nakagawa Y.; Tomishige K. Mechanism of the Hydrogenolysis of Ethers over Silica-Supported Rhodium Catalyst Modified with Rhenium Oxide. J. Catal. 2011, 280, 221–229. 10.1016/j.jcat.2011.03.018. [DOI] [Google Scholar]
- Liu H.; Huang Z.; Zhao F.; Cui F.; Li X.; Xia C.; Chen J. Efficient Hydrogenolysis of Biomass-Derived Furfuryl Alcohol to 1,2- and 1,5-Pentanediols over a Non-Precious Cu–Mg3AlO4.5 Bifunctional Catalyst. Catal. Sci. Technol. 2016, 6, 668–671. 10.1039/C5CY01442E. [DOI] [Google Scholar]
- Liu L.; Lou H.; Chen M. Selective Hydrogenation of Furfural to Tetrahydrofurfuryl Alcohol over Ni/CNTs and Bimetallic Cu-Ni/CNTs Catalysts. Int. J. Hydrogen Energy 2016, 41, 14721–14731. 10.1016/j.ijhydene.2016.05.188. [DOI] [Google Scholar]
- Date N. S.; Chikate R. C.; Roh H. S.; Rode C. V. Bifunctional Role of Pd/MMT-K 10 Catalyst in Direct Transformation of Furfural to 1,2-Pentanediol. Catal. Today 2018, 309, 195–201. 10.1016/j.cattod.2017.08.002. [DOI] [Google Scholar]
- Götz D.; Lucas M.; Claus P. C–O Bond Hydrogenolysis vs. C=C Group Hydrogenation of Furfuryl Alcohol: Towards Sustainable Synthesis of 1,2-Pentanediol. React. Chem. Eng. 2016, 1, 161–164. 10.1039/C5RE00026B. [DOI] [Google Scholar]
- Bhogeswararao S.; Srinivas D. Catalytic Conversion of Furfural to Industrial Chemicals over Supported Pt and Pd Catalysts. J. Catal. 2015, 327, 65–77. 10.1016/j.jcat.2015.04.018. [DOI] [Google Scholar]
- Tong T.; Xia Q.; Liu X.; Wang Y. Direct Hydrogenolysis of Biomass-Derived Furans over Pt/CeO2 Catalyst with High Activity and Stability. Catal. Commun. 2017, 101, 129–133. 10.1016/j.catcom.2017.08.005. [DOI] [Google Scholar]
- Liu H.; Huang Z.; Kang H.; Xia C.; Chen J. Selective Hydrogenolysis of Biomass-Derived Furfuryl Alcohol into 1,2- and 1,5-Pentanediol over Highly Dispersed Cu-Al2O3 Catalysts. Chin. J. Catal. 2016, 37, 700–710. 10.1016/S1872-2067(15)61080-4. [DOI] [Google Scholar]
- Koso S.; Furikado I.; Shimao A.; Miyazawa T.; Kunimori K.; Tomishige K. Chemoselective Hydrogenolysis of Tetrahydrofurfuryl Alcohol to 1,5-Pentanediol. Chem. Commun. 2009, 2035. 10.1039/b822942b. [DOI] [PubMed] [Google Scholar]
- Deshmukh G. P.; Yadav G. D. Insight into Regioselective Hydrogenation of Methyl Phenyl Glyoxalate to Methyl Mandelate over Pt/α-MnO2 Nanorods. Mol. Catal. 2017, 433, 250–264. 10.1016/j.mcat.2017.02.002. [DOI] [Google Scholar]
- Julien C. M.; Massot M.; Poinsignon C. Lattice Vibrations of Manganese Oxides: Part I. Periodic Structures. Spectrochim. Acta, Part A 2004, 60, 689–700. 10.1016/S1386-1425(03)00279-8. [DOI] [PubMed] [Google Scholar]
- Pahalagedara L. R.; Dharmarathna S.; King’ondu C. K.; Pahalagedara M. N.; Meng Y.-T.; Kuo C.-H.; Suib S. L. Microwave-Assisted Hydrothermal Synthesis of α-MnO2: Lattice Expansion via Rapid Temperature Ramping and Framework Substitution. J. Phys. Chem. C 2014, 118, 20363–20373. 10.1021/jp505306q. [DOI] [Google Scholar]
- Meng X.; Zhang J.; Chen B.; Jing Z.; Zhao P. Copper Supported on H+ -Modified Manganese Oxide Octahedral Molecular Sieves (Cu/H-OMS-2) as a Heterogeneous Biomimetic Catalyst for the Synthesis of imidazo[1,2-a]-N-Heterocycles. Catal. Sci. Technol. 2016, 6, 890–896. 10.1039/C5CY01433F. [DOI] [Google Scholar]
- Sun M.; Li W.; Zhang B.; Cheng G.; Lan B.; Ye F.; Zheng Y.; Cheng X.; Yu L. Enhanced Catalytic Performance by Oxygen Vacancy and Active Interface Originated from Facile Reduction of OMS-2. Chem. Eng. J. 2018, 331, 626–635. 10.1016/j.cej.2017.09.028. [DOI] [Google Scholar]
- Wang R.; Li J. OMS-2 Catalysts for Formaldehyde Oxidation: Effects of Ce and Pt on Structure and Performance of the Catalysts. Catal. Lett. 2009, 131, 500–505. 10.1007/s10562-009-9939-5. [DOI] [Google Scholar]
- Jung Y.; Shin T.; Kim K.; Byun H.; Cho S. J.; Kim H.; Song H. Rh(0)/Rh(III) Core–shell Nanoparticles as Heterogeneous Catalysts for Cyclic Carbonate Synthesis. Chem. Commun. 2017, 53, 384–387. 10.1039/C6CC08318H. [DOI] [PubMed] [Google Scholar]
- Ibrahim M.; Poreddy R.; Philippot K.; Riisager A.; Garcia-Suarez E. J. Chemoselective Hydrogenation of Arenes by PVP Supported Rh Nanoparticles. Dalton Trans. 2016, 45, 19368–19373. 10.1039/C6DT03668F. [DOI] [PubMed] [Google Scholar]
- Rico-Pérez V.; Lecea C. S. M. D.; Bueno-López A. Preparation of RhOx/CeyPr1-yO2 N2O Decomposition Catalysts by Rhodium Nitrate Impregnation with Different Solvents. Appl. Catal., A 2014, 472, 134–142. 10.1016/j.apcata.2013.12.021. [DOI] [Google Scholar]
- Tian Z.-Y.; Mountapmbeme Kouotou P.; Bahlawane N.; Tchoua Ngamou P. H. Synthesis of the Catalytically Active Mn3O4 Spinel and Its Thermal Properties. J. Phys. Chem. C 2013, 117, 6218–6224. 10.1021/jp312444s. [DOI] [Google Scholar]
- Zhang J.; Li Y.; Wang L.; Zhang C.; He H. Catalytic Oxidation of Formaldehyde over Manganese Oxides with Different Crystal Structures. Catal. Sci. Technol. 2015, 5, 2305–2313. 10.1039/C4CY01461H. [DOI] [Google Scholar]
- Zhang L.; Tu J.; Lyu L.; Hu C. Enhanced Catalytic Degradation of Ciprofloxacin over Ce-Doped OMS-2 Microspheres. Appl. Catal., B 2016, 181, 561–569. 10.1016/j.apcatb.2015.08.029. [DOI] [Google Scholar]
- Almquist C.; Krekeler M.; Jiang L. An Investigation on the Structure and Catalytic Activity of Cryptomelane-Type Manganese Oxide Materials Prepared by Different Synthesis Routes. Chem. Eng. J. 2014, 252, 249–262. 10.1016/j.cej.2014.04.102. [DOI] [Google Scholar]
- Nicolas-Tolentino E.; Tian Z.-R.; Zhou H.; Xia G.; Suib S. L. Effects of Cu2+ Ions on the Structure and Reactivity of Todorokite- and Cryptomelane-Type Manganese Oxide Octahedral Molecular Sieves. Chem. Mater. 1999, 11, 1733–1741. 10.1021/cm9811040. [DOI] [Google Scholar]
- Tiwari M. S.; Yadav G. D.; Ng F. T. T. Selective Hydrogenation of 3,4-Dimethoxybenzophenone in Liquid Phase over Pd/C Catalyst in a Slurry Reactor. Can. J. Chem. Eng. 2014, 92, 2157–2165. 10.1002/cjce.22073. [DOI] [Google Scholar]
- Toukoniitty E.; Mäiki-Arvela P.; Kuusisto J.; Nieminen V.; Päivärinta J.; Hotokka M.; Salmi T.; Murzin D. Y. Solvent Effects in Enantioselective Hydrogenation of 1-Phenyl-1,2-Propanedione. J. Mol. Catal. A: Chem. 2003, 192, 135–151. 10.1016/S1381-1169(02)00415-6. [DOI] [Google Scholar]
- Chen B.; Li F.; Huang Z.; Yuan G. Tuning Catalytic Selectivity of Liquid-Phase Hydrogenation of Furfural via Synergistic Effects of Supported Bimetallic Catalysts. Appl. Catal., A 2015, 500, 23–29. 10.1016/j.apcata.2015.05.006. [DOI] [Google Scholar]
- Resasco D. E.; Sitthisa S.; Faria J.; Prasomsri T.; Ruiz M.. Furfurals as Chemical Platform for Biofuels Production. In Solid Waste as a Renewable Resource Methodologies; Taylor & Francis Group, 2011; p 103. [Google Scholar]
- Levenspiel O.Chemical Reaction Engineering, 3rd ed.; Wiley, 2017; pp 376–402. [Google Scholar]
- Gawade A. B.; Tiwari M. S.; Yadav G. D. Biobased Green Process: Selective Hydrogenation of 5-Hydroxymethylfurfural to 2,5-Dimethyl Furan under Mild Conditions Using Pd-Cs2.5H0.5PW12O40/K-10 Clay. ACS Sustainable Chem. Eng. 2016, 4, 4113–4123. 10.1021/acssuschemeng.6b00426. [DOI] [Google Scholar]
Associated Data
This section collects any data citations, data availability statements, or supplementary materials included in this article.


