Abstract
In this paper, we report a simple, novel, and highly selective plasmonic nanoparticles (NPs)-based colorimetric nanoprobe for the detection of Al(III) ions in aqueous solution. 5-Hydroxy indole-2-carboxylic acid (5H-I2CA) was utilized as a reducing as well as capping agent for the preparation of silver nanoparticles (5H-I2CA@AgNPs). The interaction between Al(III) and AgNPs was determined by UV–vis absorption spectroscopy, high-resolution transmission electron microscopy, Fourier transform infrared, X-ray photoelectron spectroscopy, and dynamic light scattering techniques. The absorption values (A452–410) of the 5H-I2CA@AgNPs solution exhibited a linear correlation with Al(III) ion concentrations within the linear range of 0.1–50 nM. An outstanding selectivity toward Al(III) was demonstrated by the proposed nanoprobe in the presence of interfering cations. Kinetics was used to study the selectivity of nanoprobe, which indicated second-order kinetics, and the rate constant was very high. The activation energies of Al(III) were found to be the lowest compared to those of other interfering ions. The results of kinetics and thermodynamic study of Al(III) were compared to those of four other competing ions. The thermodynamic data reveal that the interaction best suited for Al(III) ion compared to other metal ions (Al(III) > Co(II) > Hg(II) > Cr(III) ≅ Cr(VI)). The lower detection limit of the proposed nanoprobe for Al(III) is 1 nM. The present method also holds practical applicability for real water samples.
Introduction
Research on analytical methods for trace-level detection of aluminum ions is gaining interest nowadays owing to the toxic nature and impact of aluminum on human health and environment.1−3 Aluminum has a wide range of applications,4 and some of its compounds are utilized in our day-to-day life, for instance, in aluminum foils, vessels, food additives, pharmaceutical products, etc.,5,6 thereby leading to the contamination of food and water. Numerous epidemiologic studies suggested that even a low-dose exposure of Al(III) can result in many health complications. It is responsible for various disorders such as Alzheimer’s disease,7,8 Parkinson’s disease,9,10 and dialysis encephalopathy.11,12 Thus, to circumvent these difficulties, WHO has set the permissible limit of Al(III) in drinking water as 7.4 μM.13 Therefore, it is essential to develop new methods that can be efficiently utilized for Al(III) detection, specifically in the underdeveloped areas.14
The routine methods that have been utilized for Al(III) detection involve atomic absorption spectrometry,15 inductively coupled plasma mass spectroscopy,16 inductively coupled plasma atomic emission spectrometry,17 electrochemical methods,18 etc. These methods require complex sample preparation and expensive instrumentation and are also time-consuming. Hence, these techniques are not viable for use in areas with limited resources, making the detection of metal ions using colorimetric sensing materials of significant interest.19,20 Among the colorimetric sensing materials, silver and gold nanoparticles (NPs)-based colorimetric detection methods have emerged as an efficient cost-effective alternative to the above-mentioned analytical methods.21−26 These methods are based on the controlled aggregation of the surface-modified AgNPs or AuNPs in the presence of target analytes. Owing to their unique physicochemical properties and surface plasmon resonance (SPR), they have been extensively utilized for trace-level detection of target analytes.27−30 The target analyte-induced aggregation of NP causes a color change of the solution as well as modification in their related absorption spectra.31−34 This facilitates the detection of analyte ions by the naked eye or using a simple UV–vis spectrophotometer technique.
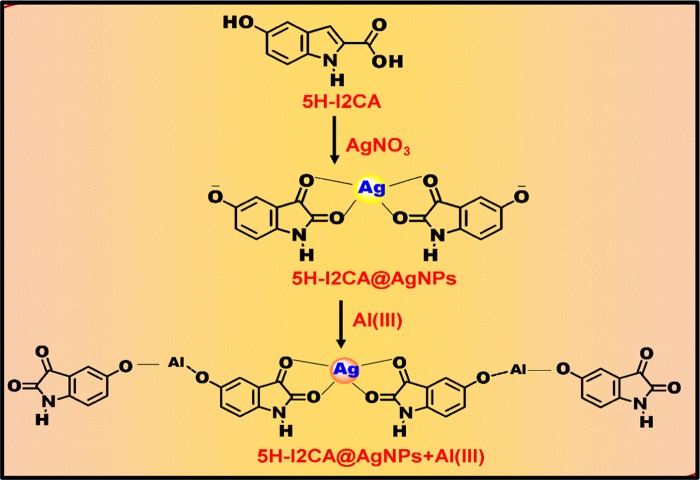
To date, several AgNP or AuNP colorimetric methods have been developed for the detection of Al(III) in aqueous system AuNPs. For example, Xue and co-workers utilized 5-mercapto methyl tetrazole-capped AuNPs (MMT-AuNPs) for the selective detection of Al(III).35 Chen and group demonstrated the use of triazole ether-functionalized AuNPs for the detection of Al(III)ions in aqueous solution.36 The disadvantage of both the above methods is the lengthy sample preparation process. Chen et al. prepared ionic coated gold nanoparticles for the determination of Al(III) in vermicelli samples.37 Our research group has also reported a sensitive and selective method for the on-site detection of Al(III) ions in aqueous solution by using indole-2-carboxylic acid as a reducing as well as stabilizing agent.38 Although we obtained satisfactory results from our previous study, the exact mechanism and excellent selectivity of Al(III) ion were still unknown. Therefore, we have used a reducing and stabilizing agent, i.e., 5-hydroxy indole-2-carboxylic acid (5H-I2CA), for the synthesis of AgNPs as well as for the detection of Al(III) ions in aqueous systems. This molecule has the advantage of the extra hydroxy group, which is present at the fifth position and plays an important role in sensing of aluminum. Being a Lewis acid, aluminum strongly interacts with a hydroxyl group and gets adsorbed on the surface of NPs. The presence of extra binding site (−OH group) makes it a better molecule for Al(III) sensing in comparison to indole, 2-carboxylic acid. The N- and O-containing ligands in 5H-I2CA are extremely prone to get coordinated with the Al(III) ions.38 Thus, the detection limit observed for the present method was 1 nM, which is far better than the limit observed by our previously reported method. The rationale design for this new nanoprobe for Al(III) detection is illustrated in Schemes 1 and 2. To evaluate the selective interaction of the Al(III) ions with the 5H-I2CA@AgNPs, thermodynamic and kinetics parameters were also utilized. We have also characterized our probe before and after with a number of techniques, especially X-ray photoelectron spectroscopy (XPS), which governs the Al(III) sensing. The prepared NPs also displayed excellent selectivity compared to other competing metal ions.
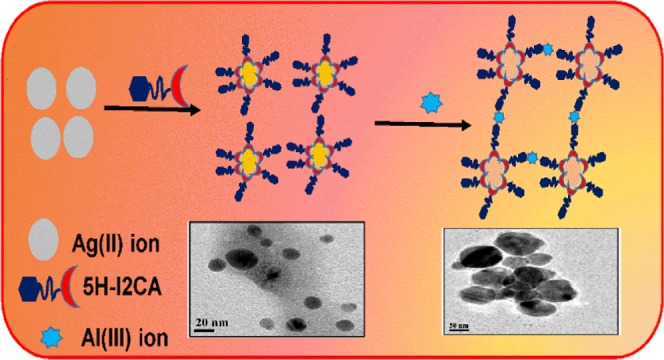
Scheme 1. Mechanistic Pathway for the Preparation of 5H-I2CA@AgNPs and Their Selective Interaction with Al(III) Ions.
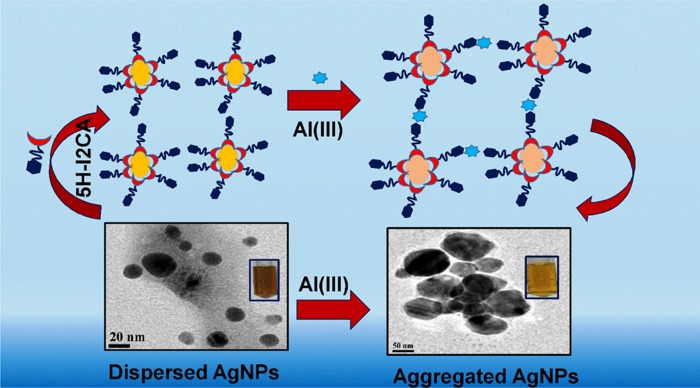
Scheme 2. Pictorial Presentation for the Preparation of 5H-I2CA@AgNPs and Their Interaction with Al(III) Ions.
Results and Discussion
Preparation and Stability of AgNPs
5-Hydroxy indole-2-carboxylic acid (5H-I2CA) was utilized as both a reducing and capping agent in the preparation of AgNPs. AgNPs were prepared at different pH values ranging from 6 to 12. The UV–vis spectra were recorded after 10 min of the preparation of AgNPs at different pH values. The SPR peak at pH 8 was the narrowest, having a well-defined peak at 410 nm (Figure S1a). Furthermore, with an increase in pH, the peak intensity decreases with red shifting because of the NPs destabilization. At low pH, a broad and low-intensity peak was observed, indicating that the acidic medium did not support the NPs preparation. At acidic pH, the reducing capacity of functional groups present in 5H-I2CA@AgNPs decreases.39 In the alkaline medium, the reducing capability increases as the dissociation constant of the functional groups lies in the pH range 8–11.40 The inset of Figure S1a shows color change with respect to pH.
Stability of a nanoprobe is an imperative feature in the NPs-based sensing applications. Therefore, we analyzed the stability of the NPs at a pH range of 6–12. A board peak was observed at pH 6, although the intensity of the peak increases with pH and shows maximum value with a characteristic peak at pH 9. Near physiological pH, the C=O group undertakes resonance,41 providing partial negativity to it, which in turn ensures the electrostatic stability of the prepared AgNPs. A decrease in the SPR peak intensity was observed with the increase in pH because of the NPs destabilization (Figure S1b). The inset of Figure S1b shows visual color at different pH values.
Effect of Temperature
The effect of increasing temperature from 50 to 100 °C was determined on the preparation of AgNPs. UV–vis spectral studies reveal that at 50 °C, a broad peak was observed. However, the peak intensity increases along with the blue shift with an increase in temperature up to 80 °C (Figure S2a), which indicates the preparation of AgNPs. On further increasing the temperature, the peak intensity decreases with the red shift from 410 to 423 nm. The corresponding color change in the AgNP solutions is shown in the inset of Figure S2a. Thus, 80 °C was set as an optimal temperature for the preparation of AgNPs.
Effect of Concentration of 5H-I2CA@AgNPs
The preparation of the NPs was determined by observing the changes in the SPR bands at each concentration. The reaction kinetics was determined by adding 50 mL of 1 × 10⁻³ M AgNO3 to various concentrations of 5H-I2CA ranging from 1 × 10⁻⁵ to 1 × 10⁻¹ M (Figure S2b). At initial concentration, a low-intensity broad band was observed. However, with further increase in concentration, the intensity of the SPR band increases up to 1 × 10⁻² M. After that, a less intense red-shifted SPR peak was noted, thus indicating 1 × 10⁻² M of 5H-I2CA as an optimal concentration for the preparation of AgNPs. It is expected that at higher concentrations, the preparation of the secondary layer reduces the density of electrons at the NPs’ surface, which results in peak shift as well as a decrease in SPR intensity. Thus, the obvious color change and red shifting in the absorption spectra of NPs are the criteria for their increased size.42,43 The full width at half-maximum (FWHM) was also demonstrated for determining the dispersity of NPs.44 An increase in the FWHM values was observed, which might be due to an increase in the NPs size (Figure S3(a,b) and Table 1).
Table 1. Values Used for Calculating FWHM for Figure S1(a,b).
| S.No. | concentration (M) | abs. at λmax | abs. at λmax1/2 | width range | FWHM |
|---|---|---|---|---|---|
| 1 | 1 × 10⁻² | 0.0446 | 0.0223 | 456–354 | 102 |
| 2 | 1 × 10⁻⁴ | 0.0161 | 0.00805 | 333–477 | 144 |
Thermogravimetric Analysis (TGA)
TGA analysis was done to investigate the thermal stability of 5H-I2CA and 5H-I2CA@AgNPs (Figure 1). For 5H-I2CA, the sample started to degrade at around 150–270 °C. This may be due to the decomposition of the carboxylate and amino functional groups.40,45 Decomposition was found to occur at 335–360 °C due to the degradation of the 5H-I2CA backbone. In the case of 5H-I2CA@AgNPs, the degradation occurred in three main steps. In the first step, there was a weight loss at around 150–58 °C, which was attributed to the physically adsorbed water molecules. Further weight loss in the range of 300–360 °C may be attributed to the pyrolysis of oxygen-containing groups. After the third stage, the total weight loss for the 5H-I2CA@AgNPs was estimated at around 50%. Further weight loss is ascribed to the degradation of the stabilizing materials over the NPs’ surface.46 The improved thermal stability of 5H-I2CA@AgNPs might be because of the strong binding of the capping agent over the NPs’ surface.
Figure 1.
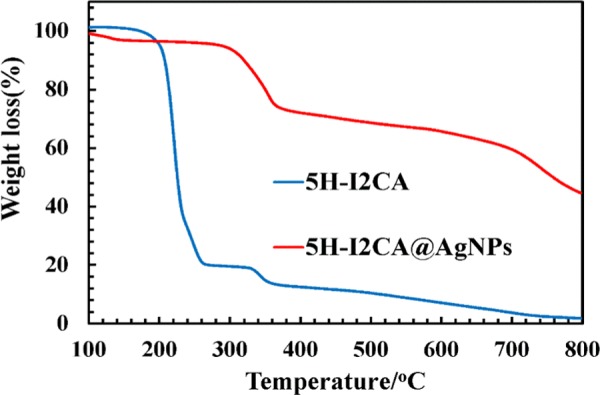
TGA curves of pure 5H-I2CA and 5H-I2CA@AgNPs.
Fourier Transform Infrared (FTIR) Analysis
Figure S4a shows the FTIR spectrum of the 5H-I2CA molecule. A strong band at 3341 cm–1 is allotted to the N–H stretching vibration involved in the intermolecular N–H···O hydrogen bonding. The peak at 3128 cm–1 arises due to the stretching vibration of OH group involved in intermolecular hydrogen bonding. The peaks at 1693 and 1190 cm–1 are due to the C=O and C–O stretching vibrations in the carboxylic group, respectively,47 whereas in the FTIR spectrum of 5H-I2CA@AgNPs, a peak shift from 1693 to 1600 cm–1 and the disappearance of a peak at 1190 cm–1 indicate the involvement of carboxylic group in the NPs preparation (Figure S4b). In alkaline medium, AgNO3 acted as an oxidizing agent, which showed oxidative decarboxylation of 5H-I2CA forming an indole cation. The formed intermediate species, which exists in its tautomeric form, was highly unstable. In alkaline medium, Ag further extracts two electrons from the hydroxyl group present at the second position of indole ring and forms cation at its oxygen group. This results in the preparation of the unstable intermediate and it then tautomerizes into its stable intermediate. Further, the radical cation formed at the third position of indole ring was attacked by the hydroxyl anion, which oxidized into 2,3-dihydroxy indole. The release of electrons during these processes was responsible for the preparation of 5H-I2CA@AgNPs, and the negative charge on the surface of dihydroxy indole enhances their stability (Scheme 1).
After interaction with Al(III), the characteristic peak at 3100 cm–1 also disappears, indicating the interaction of the Al(III) with the OH group of 5H-I2CA@AgNPs (Figure S4c). The interaction of Al(III) with 5H-I2CA@AgNPs can be attributed to the presence of many electronegative N and O elements in the molecule.48,38
Kinetics of Reactive Interaction between Detection Nanoprobe and Al(III)
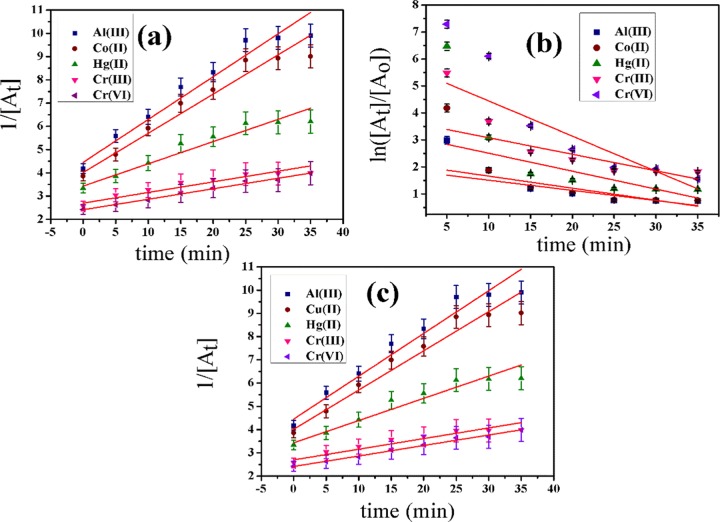
The study of kinetics of reactive interaction was carried out to determine the rate of interaction and also the rate-determining kinetics. In this study, various kinetic models, viz., zero-, first-, and second-order (Figure 2), were evaluated for Al(III), Co(II), Hg(II), Cr(III), and Cr(VI) at three different temperatures. The linear forms of zero-order (Figure 2a), first-order (Figure 2b), and second-order (Figure 2c) kinetic models are as follows (eqs 1–3)
| 1 |
| 2 |
| 3 |
where [At], [Ao], ko, and t are the absorbance at time t, absorbance at time (t = 0), zero-order rate constant, and time, respectively. The curves for zero-, first-, and second-order models are plotted as [At] vs T, ln([At]/[Ao]) vs T, and 1/[At] vs T, respectively, for Al(III), Co(II), Hg(II), Cr(III), and Cr(VI). Figure 2a–c shows zero-, first-, and second-order kinetic plots for all ions. R2-values for all ions fitted in the second-order model of kinetics (Table 2).
Figure 2.
Kinetic plots of zero-, first-, and second-order models for Al(III), Co(II), Hg(II), Cr(III), and Cr(VI).
Table 2. Rate Constants of Zero-, First-, and Second-Order Models.
| k0 (au/min) | k1 (min–1) | k2 (au–1 min–1) | |
|---|---|---|---|
| Al(III) | –0.0036 | –0.038 | 0.17 |
| Co(II) | –0.004 | –0.041 | 0.15 |
| Hg(II) | –0.0039 | –0.066 | 0.08 |
| Cr(III) | –0.0036 | –0.068 | 0.03 |
| Cr(VI) | –0.004 | –0.161 | 0.045 |
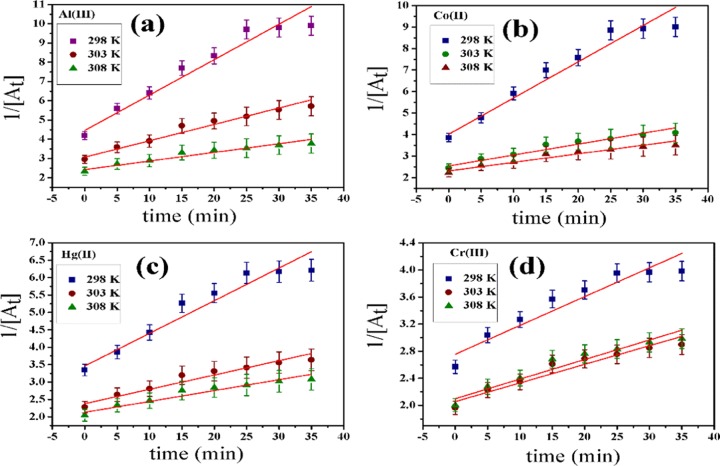
The rate constant value for Al(III) is the highest among five metal ions, i.e., the prepared nanoprobe is highly selective toward Al(III). The second-order rate constants for all metal ions are in the sequence of Al(III) (Figure 3a) > Co(II) (Figure 3b) > Hg(II) (Figure 3c) > Cr(III) (Figure 3d) ≅ Cr(VI), which is shown in Tables 2 and 3 for three temperatures, i.e., 298, 303, and 308 K. The rate constant of the second-order reaction is 0.81 au–1 min–1 for Al(III), which is much higher than other metal ions’ rate constants as well as other kinetic constants (Figure 3).
Figure 3.
Second-order kinetic plots for Al(III) (a), Co(II) (b), Hg(II) (c), and Cr(III) (d) at three temperatures 298, 303, and 308 K.
Table 3. Regression Constant Values of Zero-, First-, and Second-Order Models.
| regression | zero order (R2) | first order (R2) | second order (R2) |
|---|---|---|---|
| Al(III) | 0.81 | 0.71 | 0.96 |
| Co(II) | 0.82 | 0.74 | 0.94 |
| Hg(II) | 0.85 | 0.62 | 0.92 |
| Cr(III) | 0.81 | 0.71 | 0.89 |
| Cr(VI) | 0.91 | 0.74 | 0.90 |
The order of the kinetic model to fit in the interaction data according to R2-value is second order > first order > zero order; other details are given in Tables 2–4. The second-order model was the best fit for this interaction, which indicated that the rate-limiting step is controlled by a chemical reaction including valence forces through electron exchange or sharing between the 5H-I2CA@AgNPs and Al(III) ions.49,50
Table 4. Second-Order Rate Constants for Al(III), Co(II), Hg(II), and Cr(III) at Three Temperatures.
| Al(III) |
Co(II) |
Hg(II) |
Cr(III) |
|||||
|---|---|---|---|---|---|---|---|---|
| temperature (K) | k2 | R2 | k2 | R2 | k2 | R2 | k2 | R2 |
| 298 | 0.17 | 0.94 | 0.15 | 0.92 | 0.08 | 0.92 | 0.02 | 0.92 |
| 303 | 0.07 | 0.95 | 0.04 | 0.93 | 0.03 | 0.93 | 0.02 | 0.92 |
| 308 | 0.04 | 0.93 | 0.03 | 0.93 | 0.02 | 0.92 | 0.03 | 0.89 |
Thermodynamics of Reactive Interactions
To understand the energy changes during the selective interaction of prepared nanoprobe toward Al(III), thermodynamic studies were done at different temperatures. Thermodynamic parameters were calculated by using activation energy (eq 4), i.e., Arrhenius relation.51 Thermodynamic data reveal the nature of interaction, spontaneity, and feasibility
| 4 |
The activation energies (Ea) for all ions are in the order of Al(III) < Co(II) < Hg(II) < Cr(III). This result indicates that the interaction with Al(III) required less energy than other metal ions, and hence the kinetics of Al(III) was much faster than that of other metal ions (Figure 4). The Ea was 110.40 kJ/mol for Al(III), which was lower than that for other ions. Other thermodynamic parameters of interaction with all four metal ions were calculated by using eqs 5–7
| 5 |
| 6 |
| 7 |
All thermodynamic parameters were strongly in favor of selective interaction of Al(III) with prepared nanoprobe, and results are shown in Tables 5–7. The interaction was spontaneous, feasible, and endothermic.
Figure 4.
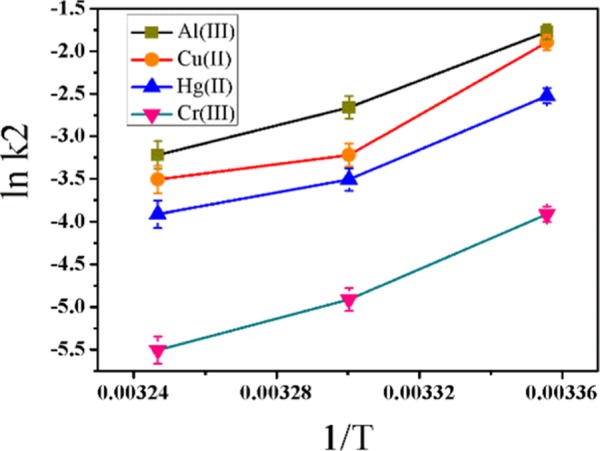
Activation energy curves for Al(III), Co(II), Hg(II), and Cr(III) ions.
Table 5. Thermodynamic Parameters of Al(III) and Co(II).
| Al(III) |
Co(II) |
|||||
|---|---|---|---|---|---|---|
| parameters | 298 K | 303 K | 308 K | 298 K | 303 K | 308 K |
| ΔH≠ (kJ/mol) | 108.06 | 108.02 | 107.9 | 120.7 | 120.71 | 120.6 |
| ΔG≠ (kJ/mol) | –77.37 | –80.94 | –83.75 | –77.68 | –82.35 | –84.4 |
| ΔS≠ (J/K/mol) | 0.622 | 0.62 | 0.62 | 0.66 | 0.67 | 0.66 |
Table 7. Activation Energies of Al(III), Co(II), Hg(II), and Cr(III).
| metal ion | Ea (kJ/mol) | R2 |
|---|---|---|
| Al(III) | 110.49 | 0.97 |
| Co(II) | 123.21 | 0.77 |
| Hg(II) | 106.03 | 0.89 |
| Cr(III) | 121.80 | 0.96 |
Table 6. Thermodynamic Parameters of Hg(II) and Cr(III).
| Hg(II) |
Cr(III) |
|||||
|---|---|---|---|---|---|---|
| parameters | 298 K | 303 K | 308 K | 298 K | 303 K | 308 K |
| ΔH≠ (kJ/mol) | 109.06 | 106.54 | 106.45 | 119.35 | 119.31 | 119.27 |
| ΔG≠ (kJ/mol) | 79.23 | 82.35 | 84.4 | 82.6 | 84.10 | 84.4 |
| ΔS≠ (J/K/mol) | 0.1 | 0.07 | 0.06 | 0.12 | 0.11 | 0.11 |
Selectivity Study toward Metal Ions
The application of the prepared nanoprobe as a colorimetric sensor for metal-ion detection is based on the spectral analysis along with color change of the NPs solution. Thus, by applying this strategy, the selectivity of the prepared nanoprobe was determined against 15 metal ions. There was no significant change in the UV–vis spectra of any metal ion, except Al(III), as shown in Figure 5a. The presence of Al(III) causes a red shift in the SPR band. This indicates the interaction of Al(III) with the prepared NPs, which results in the morphology change of the 5H-I2CA@AgNPs and red shift in the SPR spectrum. Quantitative analysis was also performed at two different absorption ratios (A452–410). Figure 5b demonstrates an apparently high absorption ratio (A452–410) for Al(III), indicating the maximum aggregation state, whereas other metal ions displayed an absorption ratio similar to that of blank (untreated AgNPs). The effect of the coexisting metal ions on the sensing efficiency was also determined by mixing different metal-ion solutions (50 nM) with the Al(III) ions (10 nM). A coexisting metal cation test was also demonstrated to examine the selectivity of 5H-I2CA@AgNPs toward Al(III). The colorimetric response of the reaction mixtures is that the metal ions did not interfere in the detection of the Al(III)ions (Figure 6a). The results were also supported by the plot of the values obtained (A452–410 of the 5H-I2CA@AgNPs) with various metal cations mixed with Al(III) (5–50 nM) (Figure 5c). The Al(III)-induced values were dramatically larger than the values obtained for any of the other metal cations (Figure 5c).
Figure 5.
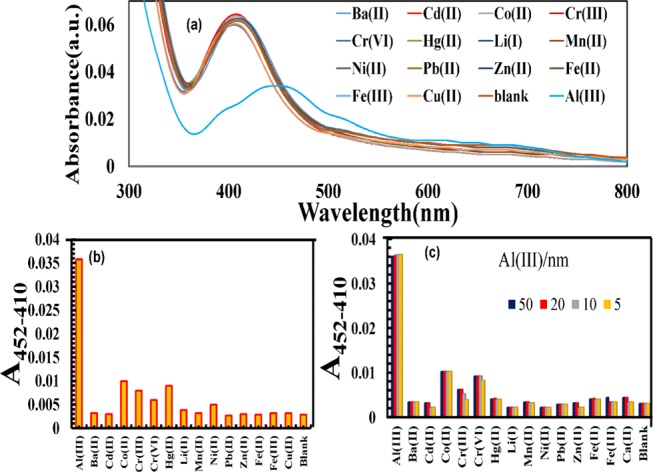
(a) Absorption spectra after addition of 5H-I2CA@AgNPs over the addition of metal cations, (b) UV–visible intensity ratio (A452–410) of 5H-I2CA@ over the addition of metal cations in an aqueous medium, and (c) bar graph denoting the selectivity of 5H-I2CA@AgNPs with various concentrations of Al(III) ranging from 50 to 5 nM.
Figure 6.
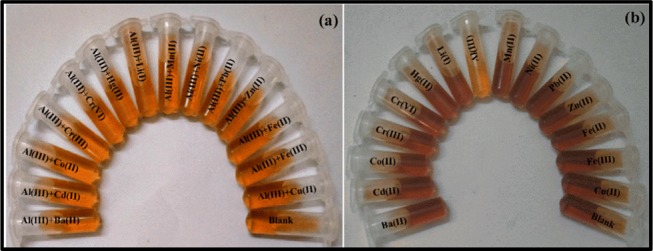
(a) Optical images of the 5H-I2CA@AgNPs incubated with a mixture of Al(III) and other ions in competitive metal ions test. (b) Colorimetric changes of 5H-I2CA@AgNPs in the presence of Al(III) and various metal ions.
A colorimetric nanoprobe is advantageous as it does not require complex instrumentation; the color change can be seen by the naked eye. The proposed nanoprobe could be used as a visual colorimetric nanosensor for the detection of metal ions. As observed in Figure 6b, only Al(III) can significantly induce an aggregation to cause the color change in the NPs solution, while other metal ions did not induce any such change even at a concentration of 50 nM.
Sensitivity Study
To observe the response of nanoprobe to Al(III) ions, various concentrations of Al(III) ranging from 0.1 to 50 nM were individually added to the NPs solutions. The corresponding UV–vis spectra were recorded after 2 min of shaking time. The effects of different concentrations of Al(III) ions on the prepared NPs are demonstrated in Figure 7a. The SPR band of the NPs solutions was shifted to higher wavelength, with increasing concentration of Al(III) ions. The band intensity decreases gradually, along with a red shift, indicating strong aggregation of NPs. Figure 7b shows that the color of the solution changes from yellowish brown to yellow as a function of Al(III) ions. This reveals that the visual detection of Al(III) ions is possible with our prepared nanoprobe (Scheme 2). By plotting Al(III) concentration against A452–410, a straight line with R2 = 0.9903 in the range of 1–50 nM was obtained (Figure 7c). Moreover, the color of NPs solution is the same as that of control at 1 nM concentration of Al(III) ions. These findings are well supported by the spectral analysis in which no change in the SPR intensity was observed beyond 1 nM concentration of Al(III) ions. Thus, the detection limit of Al(III) for the proposed nanoprobe was found to be 1 nM.
Figure 7.
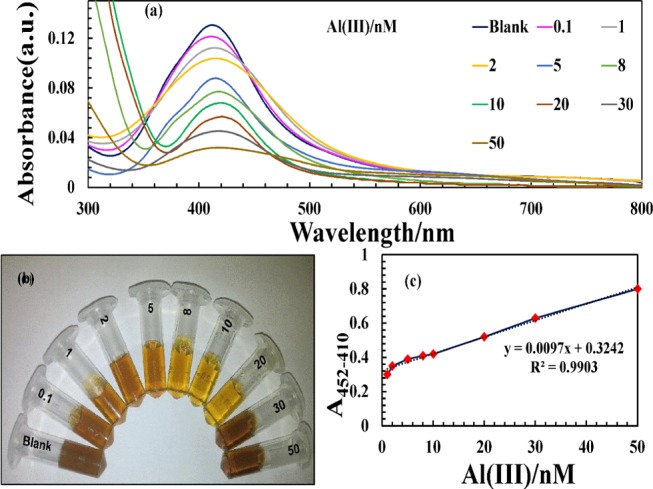
(a) UV–vis spectra, (b) optical images of 5H-I2CA@AgNPs after the addition of different Al(III) ion concentration of 0.1–50 nM, and (c) plot of absorption intensity vs various concentrations of Al(III).
The aggregation behavior of the NPs in the presence of Al(III) ions was further confirmed by the high-resolution transmission electron microscopy (HRTEM) images. Figure 8 shows the change in the behavior of the NPs after the addition of Al(III) ions. Figure 8a shows that the particles are well dispersed having the size of 5–25 nm, whereas after the addition of the Al(III) ions (Figure 7c), the particles were aggregated (Figure 8b), thus changing their morphology from monodispersed to polydispersed (Scheme 2). The interaction of NPs with Al(III) ions was further confirmed by the dynamic light scattering (DLS) techniques. The average diameter of the particles changes from 26 to 110 nm after the addition of the Al(III)ions (Figure S5a–c).
Figure 8.
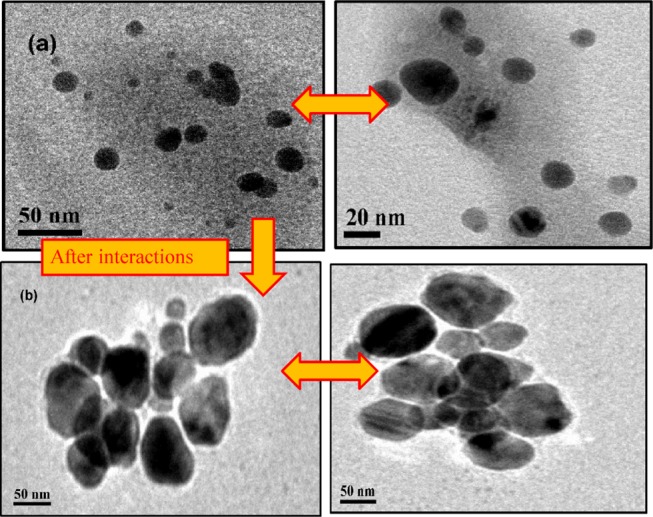
HRTEM images of 5H-I2CA@AgNPs (a) before and (b) after the addition of Al(III) ions.
Thus, all of the aforementioned results support the Al(III) ions-assisted aggregation of prepared NPs solution. On the basis of the HRTEM images, it was noted that the prepared NPs were sensitive to the Al(III) ions and can be used for quantitative purposes.
XPS Analysis
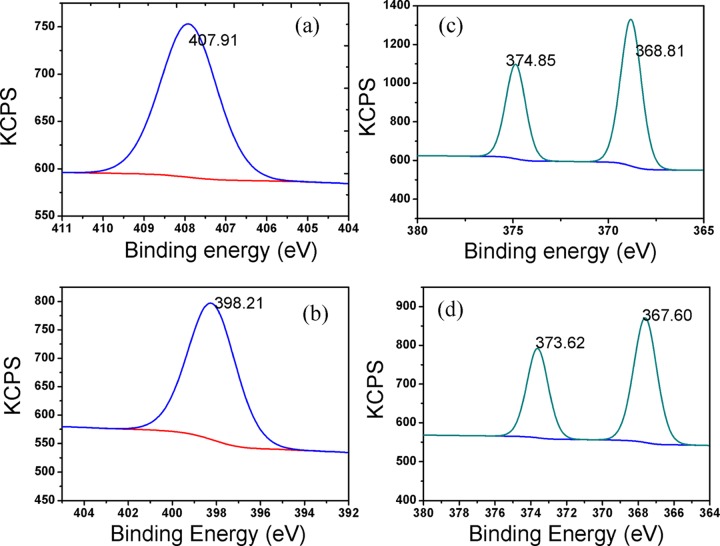
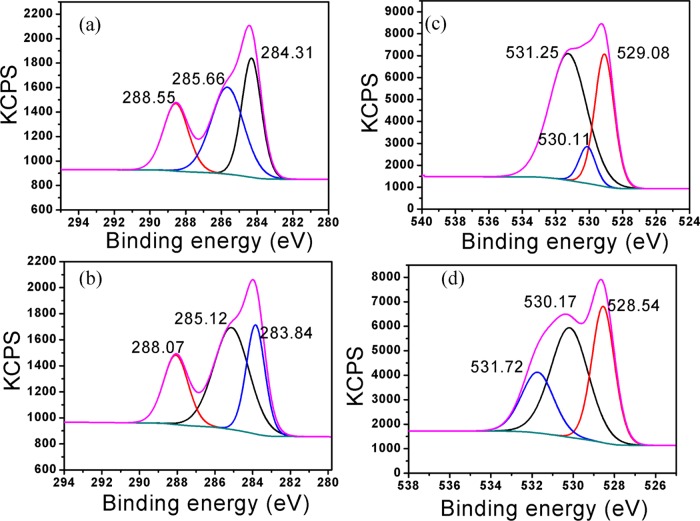
The preparation of the 5H-I2CA@AgNPs and their selective interaction with the Al(III) ions were also determined by the XPS analysis and results are tabulated in Table 8. The peaks observed at 368.81 and 374.85 eV attribute to 3d5/2 and 3d3/2 orbits of Ag0 prior to the addition of the Al(III) ions. The binding energies of Ag changed after the addition of the Al(III) ions, and the peaks observed at 367.60 and 373.62 eV (Figure 9c,d)52 are the indication of the formation of silver oxide (Ag2O) after the reaction of AgNPs with Al(III) ions. The strong peaks appeared at about 72.9 and 74.6 eV in the Al 2p spectrum for Al(OH)3 and Al metal ion, respectively.53 These peaks confirm the interaction of Al(III) over the surface of the NPs (Figure 10). The C 1s spectrum can be deconvoluted at about 284.31, 285.66, and 288.55 eV corresponding to the C–C, carbon in C–O, and the C=O. After adding the Al(III) ions, the binding energies of C–C, C–O, and C=O were realized at 283.84, 285.12, and 288.07 eV, respectively (Figure 11a,b). The three peaks appearing at 529.08, 530.11, and 531.25 eV are the signals of O 1s of the metal per oxide anion, M-OH, and −C=O group, respectively, and the shift toward lower binding energies, i.e., 528.54, 530.17, and 531.72 eV, was observed after the interaction with Al(III) ion (Figure 11c,d). Changes were also observed in the spectra of NH from 399.6 to 398.2 eV, after the addition of Al(III) ion (Figure 9a,b). The binding energy changes are mainly attributed to the presence of the Al–O bonds between AgNPs and Al(III) ions (Scheme 1).
Table 8. Binding Energy of 5H-I2CA@AgNPs before and after Interaction of Al(III).
| metal bonding | % concentration before | % concentration after | binding energy before (eV) | binding energy after (eV) |
|---|---|---|---|---|
| Al 2p3/2 | 47.73 | 73.02 | ||
| Al 2p1/2 | 52.47 | 73.06 | ||
| C–C | 34.08 | 27.72 | 284.31 | 283.84 |
| C–O | 41.32 | 48.99 | 285.66 | 285.12 |
| C=O | 24.60 | 23.29 | 288.55 | 288.07 |
| O 1s | 59.77 | 45.09 | 531.25 | 530.17 |
| 32.54 | 33.61 | 529.08 | 528.54 | |
| 7.09 | 21.31 | 530.11 | 531.72 | |
| Ag 3d5/2 | 60.15 | 61.99 | 368.81 | 367.60 |
| Ag 3d3/2 | 39.85 | 38.01 | 374.85 | 373.62 |
| N 1s | 100 | 100 | 407.91 | 398.21 |
Figure 9.
XPS wide scan spectra of 5H-I2CA@AgNPs before and after interaction of Al(III) (a, b) N 1s and (c, d) Ag 3d, respectively.
Figure 10.
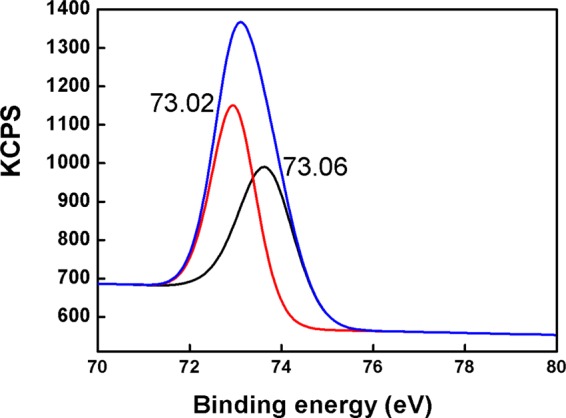
XPS wide scan spectra of Al 2p.
Figure 11.
XPS wide scan spectra of 5H-I2CA@AgNPs before and after interaction (a, b) C 1s and (c, d) O 1s, respectively.
Practical Application
To demonstrate that the prepared nanoprobe can be used to detect Al(III) ions in real water samples, a solution of the prepared NPs was used to detect Al(III) ions in tap water. Then, different concentrations of the Al(III) ions were introduced into the tap water samples and then added to the prepared nanoprobe solution. The SPR spectra demonstrate that the SPR peak intensity decreases with increasing concentration of Al(III)ions (Figure S6a). The change in the color of the prepared nanoprobe in the water samples validates results as shown in Figure S6b. The prepared probe displayed good linearity with the R2-value of 0.9902 with the tap water at minimum concentrations (Figure S6c). The sensitivity of the prepared nanosensor was also compared to other methods available for the detection of Al(III). It has been observed that the detection limit of the prepared NPs is either superior or comparable to that of the available methods54,55 (see Table S1).
Conclusions
The 5H-I2CA@AgNPs that were prepared by a simple reduction method have the capability to detect Al(III) ions over other tested metal ions in aqueous solutions. With an increasing amount of Al(III) ions, the prepared AgNPs tend to aggregate, resulting in a considerable decrease in the absorption intensity and a visible color change from yellowish brown to yellow. The obvious color change of the prepared AgNPs can be easily observed via the naked eye. Under identical conditions, the prepared nanoprobe displayed a good linearity over a wide range of Al(III) concentrations with a correlation coefficient of 0.9903. The kinetic study of selectivity of Al(III) was best fitted in a second-order model with a rate constant of 0.81 au–1 min–1. Thermodynamic data reveal that interaction with Al(III) with the probe was a feasible, spontaneous, and endothermic process. The kinetic and thermodynamic data reveal that the Al(III) best interacted with the prepared nanoprobe. The order for selectivity was Al(III) > Co(II) > Hg(II) > Cr(III) ≅ Cr(VI). This method offers a new cost-effective, rapid, and simple solution for the detection of the Al(III) ions in the real water samples also. Compared to traditional methods available for Al(III) detection, the proposed method is advantageous due to its simplicity, rapidity, high selectivity, and sensitivity.
Experimental Section
Materials and Characterization Techniques
Several chemicals used during the synthesis and experimental procedure of sensing, such as silver nitrate (AgNO3), 5-hydroxy indole-2-carboxylic acid (5H-I2CA), mercury chloride (HgCl2), barium chloride (BaCl2), potassium dichromate (K2Cr2O7), cadmium chloride (CdCl2), cobalt chloride (CoCl2), lithium chloride (LiCl), manganese chloride (MnCl2), potassium chloride (KCl), nickel chloride (NiCl2), lead nitrate (Pb(NO3)2), zinc chloride (ZnCl2), aluminum chloride (AlCl3), ferric chloride (FeCl3), CrCl3, hydrochloric acid (HCl), sodium hydroxide (NaOH), and lithium aluminum hydroxide (LiAlH4), were purchased from Merck Pvt. Ltd. All of the chemicals were of analytical grade and used as received without further purification. All solutions were made in deionized water. All of the obtained chemicals were utilized as received. The glassware was washed with aqua regia and then cleaned with Millipore water before use. UV–vis absorption spectra were recorded using a Lab India 3000+ UV–vis spectrophotometer with a 1 cm quartz cell by using deionized water as the blank for background correction. The thermal study was carried out by thermogravimetric analysis (TGA). The surface morphology was determined by high-resolution transmission electron microscopy (HRTEM). Dynamic light scattering (DLS) studies were performed on a Zetasizer Nano ZS90, Malvern Instruments. Thermo K-Alpha XPS instrument has been utilized for determining the surface elemental composition of the samples. The elemental composition was determined using energy-dispersive X-ray spectroscopy. The functional group involved in the preparation of NPs was investigated by Fourier transform infrared spectral studies.
Preparation of AgNPs
The preparation of NPs was done by the method reported in the literature.38 Briefly, 50 mL of 1 × 10⁻³ M AgNO3 solution was boiled at 80 °C for 15 min. Then, 20 mL of 5H-I2CA (1 × 10⁻² M) was added to the AgNO3 solution under vigorous stirring. pH was maintained by adding 0.1 N NaOH solution. A rapid color change of the solution from light yellow to yellowish brown was observed, indicating the preparation of well-dispersed AgNPs. The as-prepared AgNPs were stable for months without any obvious color change or aggregation.
Kinetics of Interaction
To understand the kinetics of the interaction between the prepared sensor and the metal ions, absorbance of the mixed solution was measured at a fixed time interval. In this experiment, 10 mL of each metal salt solution was mixed in the prepared sensor and the absorbance of the mixed solution was analyzed every 5 min to check any colorimetric changes.
Colorimetric Assay
For this, 300 μL of prepared nanoprobe solution (5H-I2CA@AgNPs) was added to 500 μL of metal-ion solutions and mixed systematically. The prepared nanoprobe solution showed sensitivity toward Al(III), causing a change in the color of the NPs solution from yellowish brown to yellow as well as a red shift in their SPR spectrum. The practical applicability was checked by tap water samples, which were collected from our laboratory.
Acknowledgments
The authors gratefully acknowledge support from the Ministry of Human Resource Development, Department of Higher Education, Government of India, under the Scheme of Establishment of Centre of Excellence for Training and Research in Frontier Areas of Science and Technology (FAST), vide letter No., F. No. 5-5/2014-TS. Vll.
Supporting Information Available
The Supporting Information is available free of charge on the ACS Publications website at DOI: 10.1021/acsomega.8b01945.
Figure S1: Effect of pH (a) on the synthesis and (b) stability of prepared 5H-I2CA@AgNPs (the inset shows the change in their solutions); Figure S2: (a) UV–vis spectra of AgNPs prepared at different temperatures (the inset shows the photographs of the corresponding solutions) and (b) different concentrations of 5H-I2CA (the inset shows colorimetric changes at different concentrations of 5H-I2CA); Figure S3: (a, b) Calculation of FWHM of 5H-I2CA@AgNPs synthesized at different concentrations of 5H-I2CA; Figure S4: FTIR spectra of (a) 5H-I2CA, (b) 5H-I2CA@AgNPs, and (c) 5H-I2CA@AgNPs + Al(III); Figure S5: Size distribution of 5H-I2CA@AgNPs before and after the addition of Al(III) ions; Figure S6: (a) SPR spectra of 5H–I2CA@AgNPs after the addition of various concentration of Al(III) ions on to the tap water, (b) Colorimetric response of the synthesized of 5H–I2CA@AgNPs in tap water, (c) Plot of absorbance intensity difference versus concentrations of Al(III) ions in tap water samples; Table S1: Comparison table demonstrating LODs of available probes for the detection of the Al(III) (PDF)
The authors declare no competing financial interest.
Supplementary Material
References
- Liu J.; Lewis G. Environmental Toxicity and <tep-common:author-query>AQ5: Please provide a DOI number for ref 1 or indicate if one doesn&#x2019;t exist.</tep-common:author-query>Poor Cognitive Outcomes in Children and Adults. J. Environ. Health 2014, 76, 130–138. [PMC free article] [PubMed] [Google Scholar]; PMID: 24645424, PMCID: PMC4247328.
- Gall J. E.; Boyd R. S.; Rajakaruna N. Transfer of heavy metals through terrestrial food webs: a review. Environ. Monit. Assess. 2015, 187, 1–21. 10.1007/s10661-015-4436-3. [DOI] [PubMed] [Google Scholar]
- Mehta V. N.; Kailasa S. K. Malonamide dithiocarbamate functionalized gold nanoparticles for colorimetric sensing of Cu2+ and Hg2+ ions. RSC Adv. 2015, 5, 4245–4255. 10.1039/C4RA11640B. [DOI] [Google Scholar]
- Kim K. B.; You D. M.; Jeon J. H.; Yeon Y. H.; Kim J. H.; Kim K. A fluorescent and colorimetric chemosensor for selective detection. Tetrahedron Lett. 2014, 55, 1347–1352. 10.1016/j.tetlet.2014.01.021. [DOI] [Google Scholar]
- Heinz A.; Haszler A.; Keidel C.; Moldenhauer S.; Benedictus R.; Miller W. S. Recent development in aluminium alloys for aerospace applications. Mater. Sci. Eng., A 2000, 280, 102–107. 10.1016/S0921-5093(99)00674-7. [DOI] [Google Scholar]
- Mergu A. K.; Singh N. K. Highly Sensitive and Selective Colorimetric and Off–On Fluorescent Reversible Chemosensors for Al3+ Based on the Rhodamine Fluorophore. Sensors 2015, 15, 9097–9111. 10.3390/s150409097. [DOI] [PMC free article] [PubMed] [Google Scholar]
- Sanchez-Iglesias S.; Mendez-Alvarez E.; Iglesias-Gonzalez J.; Munoz-Patino A.; Sanchez-Sellero I.; Labandeira-Garcia J. L.; Soto-Otero R. Brain oxidative stress and selective behaviour of aluminium in specific areas of rat brain: potential effects in a 6-OHDA-induced model of Parkinson’s disease. J. Neurochem. 2009, 109, 879–888. 10.1111/j.1471-4159.2009.06019.x. [DOI] [PubMed] [Google Scholar]
- Exley C.; House E. R. Aluminium in the human brain. Monatsh. Chem. 2011, 142, 357–363. 10.1007/s00706-010-0417-y. [DOI] [Google Scholar]
- Flaten T. P. Aluminium as a risk factor in Alzheimer’s disease, with emphasis on drinking water. Brain Res. Bull. 2001, 55, 187–196. 10.1016/S0361-9230(01)00459-2. [DOI] [PubMed] [Google Scholar]
- Andrasi E.; Pali N.; Molnar Z.; Kosel S. Brain aluminum, magnesium and phosphorus contents of control and Alzheimer-diseased patients. J. Alzheimer’s Dis. 2005, 7, 273–284. 10.3233/JAD-2005-7402. [DOI] [PubMed] [Google Scholar]
- Mcdermott J. R.; Smith A. I.; Ward M. K.; Parkinson I. S.; Kerr D. N. S. aluminium concentration in dialysis encephalopathy. Lancet 1978, 311, 901–904. 10.1016/S0140-6736(78)90681-5. [DOI] [PubMed] [Google Scholar]
- Nathan E.; Pedersen S. E. Dialysis encephalopathy in a non-dialysed uraemic boy treated with aluminium hydroxide orally. Acta Paediatr. 1980, 69, 793–796. 10.1111/j.1651-2227.1980.tb07155.x. [DOI] [PubMed] [Google Scholar]
- Guidelines for Drinking Water Quality; WHO: Geneva, 2008; p 301. [Google Scholar]
- Li X.; Wang J.; Suna L.; Wang Z. Gold nanoparticle-based colorimetric assay for selective detection of aluminium cation on living cellular surfaces. Chem. Commun. 2010, 46, 988–990. 10.1039/B920135A. [DOI] [PubMed] [Google Scholar]
- Şatıroğlu N.; Tokgöz İ. Cloud point extraction of aluminum(III) in water samples and determination by electrothermal atomic absorption spectrometry, flame atomic absorption spectrometry and UV–visible spectrophotometry. Int. J. Environ. Anal. Chem. 2010, 90, 560–572. 10.1080/03067310903276266. [DOI] [Google Scholar]
- Tao G.; Yamada R.; Fujikawa Y.; Kojima R.; Zheng J.; Fisher D. A.; Koerner R. M.; Kudo A. Determination of major metals in arctic snow by inductively coupled plasma mass spectrometry with cold plasma and micro concentric nebulization techniques. J. Environ. Anal. Chem. 2006, 76, 135–144. 10.1080/03067310008034125. [DOI] [Google Scholar]
- Hirata S.; Umezaki Y.; Ikeda M. Determination of chromium(III), titanium, vanadium, iron(III), and aluminum by inductively coupled plasma atomic emission spectrometry with an on-line preconcentrating ion exchange column. Anal. Chem. 1986, 58, 2602–2606. 10.1021/ac00126a005. [DOI] [Google Scholar]
- Kefala G.; Economou A.; Sofoniou M. Determination of trace aluminium by adsorptive stripping voltammetry on a preplated bismuth–film electrode in the presence of cupferron. Talanta 2006, 68, 1013–1019. 10.1016/j.talanta.2005.07.001. [DOI] [PubMed] [Google Scholar]
- Liu D.; Wang Z.; Jiang X. Gold Nanoparticles for the Colorimetric and Fluorescent Detection of Ions and Small Organic Molecules. Nanoscale 2011, 3, 1421–1433. 10.1039/c0nr00887g. [DOI] [PubMed] [Google Scholar]
- Kumar A.; Bhatt M.; Vyas G.; Bhatt S.; Paul P. Sunlight Induced Preparation of Functionalized Gold Nanoparticles as Recyclable Colorimetric Dual Sensor for Aluminum and Fluoride in Water. ACS Appl. Mater. Interfaces 2017, 9, 17359–17368. 10.1021/acsami.7b02742. [DOI] [PubMed] [Google Scholar]
- Dong Y.; Ding L.; Jin X.; Zhu N. Silver nanoparticles capped with chalcon carboxylic acid as a probe for colorimetric determination of cadmium(II). Microchim. Acta 2017, 184, 3357–3362. 10.1007/s00604-017-2358-1. [DOI] [Google Scholar]
- Grajeda B. A. G.; Acosta S. G. S.; Aguila S. A.; Guevara H. P.; Garcıa M. E. D.; Enrıquez A. C.; Jose J. Campos–Gaxiola, Selective and colorimetric detection of Ba2+ ions in aqueous solutions using 11-mercaptoundecylphosphonic acid functionalized gold nanoparticles. RSC Adv. 2017, 7, 31611–31618. 10.1039/C7RA03861E. [DOI] [Google Scholar]
- Mehta V. N.; Rohit J. V.; Kailasa S. K. Functionalization of silver nanoparticles with 5-sulfoanthranilic acid dithiocarbamate for selective colorimetric detection of Mn2+ and Cd2+ ions. New J. Chem. 2016, 40, 4566–4574. 10.1039/C5NJ03454J. [DOI] [Google Scholar]
- Joshi P.; Nair M.; Kumar D. pH-controlled sensitive and selective detection of Cr(III) and Mn(II) by using clove (Syzygium aromaticum) reduced and stabilized silver nanospheres. Anal. Methods 2016, 8, 1359–1366. 10.1039/C5AY03217B. [DOI] [Google Scholar]
- Walekar L. S.; Gore A. H.; Anbhule P. V.; Sudarsan V.; Patila S. R.; Kolekar G. B. A novel colorimetric probe for highly selective recognition of Hg2+ ions in aqueous media based inducing the aggregation of CPB-capped AgNPs: accelerating direct detection for environmental analysis. Anal. Methods 2013, 5, 5501–5507. 10.1039/c3ay40827b. [DOI] [Google Scholar]
- Kumar D. N.; Rajeshwari A.; Alex S. A.; Chandrasekaran N.; Mukherjee A. Acetylcholinesterase inhibition-based colorimetric determination of Hg2+ using unmodified silver nanoparticles. New J. Chem. 2015, 39, 1172–1178. 10.1039/C4NJ01722F. [DOI] [Google Scholar]
- Kumar V.; Mehta N.; Kumar J.; Rohit V.; Kailasa S. K. Functionalization of silver nanoparticles with 5-sulfoanthranilic acid dithiocarbamate for selective colorimetric detection of Mn2+ and Cd2+ ions. New J. Chem. 2016, 40, 4566–4574. 10.1039/C5NJ03454J. [DOI] [Google Scholar]
- Noh K. C.; Nam Y. S.; Lee H. J.; Lee K. B. A colorimetric probe to determine Pb2+ using functionalized silver nanoparticles. Analyst 2015, 140, 8209–8216. 10.1039/C5AN01601K. [DOI] [PubMed] [Google Scholar]
- Tharmaraj V.; Yang J. Sensitive and selective colorimetric detection of Cu2+ in aqueous medium via aggregation of thiomalic acid functionalized Ag nanoparticles. Analyst 2014, 139, 6304–6309. 10.1039/C4AN01449A. [DOI] [PubMed] [Google Scholar]
- Ha W.; Yu J.; Wang R.; Chen J.; Shi Y. P. Green colorimetric assay for the selective detection of trivalent chromium based on Xanthoceras sorbifolia tannin attached to gold Nanoparticles. Anal. Methods 2014, 6, 5720–5726. 10.1039/C4AY00976B. [DOI] [Google Scholar]
- Narayanan K. B.; Park H. H. Colorimetric detection of manganese(II) ions using gold/dopa Nanoparticles. Spectrochim. Acta, Part A 2014, 131, 132–137. 10.1016/j.saa.2014.04.081. [DOI] [PubMed] [Google Scholar]
- Jin W.; Huang P.; Wu F.; Ma L. H. Ultrasensitive colorimetric assay of cadmium ion based on silver nanoparticles functionalized with 5-sulfosalicylic acid for wide practical applications. Analyst 2015, 140, 3507–3513. 10.1039/C5AN00230C. [DOI] [PubMed] [Google Scholar]
- Sung Y. M.; Wu S. P. Colorimetric detection of Cd(II) ions based on di-(1H-pyrrol-2-yl)methanethione functionalized gold nanoparticles. Sens. Actuators, B 2014, 201, 86–91. 10.1016/j.snb.2014.04.069. [DOI] [Google Scholar]
- Lou T.; Chen Z.; Wang Y.; Chen L. Blue-to-Red Colorimetric Sensing Strategy for Hg2+ and Ag via Redox-Regulated Surface Chemistry of Gold Nanoparticles. ACS Appl. Mater. Interfaces 2011, 3, 1568–1573. 10.1021/am200130e. [DOI] [PubMed] [Google Scholar]
- Xue D.; Wang H.; Zhang Y. Specific and sensitive colorimetric detection of Al3+ using 5-mercaptomethyltetrazole capped gold nanoparticles in aqueous solution. Talanta 2014, 119, 306–311. 10.1016/j.talanta.2013.11.012. [DOI] [PubMed] [Google Scholar]
- Chen Y. C.; Lee L.; Sung Y. M.; Pao S. Colorimetric detection of Al3+ ions using triazole-ether functionalized gold nanoparticles. Talanta 2013, 117, 70–74. 10.1016/j.talanta.2013.08.054. [DOI] [PubMed] [Google Scholar]
- Chen W.; Jia Y.; Feng Y.; Zheng W.; Wang Z.; Jiang X. Colorimetric detection of Al(III) in vermicelli samples based on ionic liquid group coated gold nanoparticles. RSC Adv. 2015, 5, 62260–62264. 10.1039/C5RA09099G. [DOI] [Google Scholar]
- Joshi P.; Painuli R.; Kumar D. Label-free colorimetric nanosensor for the selective on-site detection of aqueous Al3+. ACS Sustainable Chem. Eng. 2017, 5, 4552–4562. 10.1021/acssuschemeng.6b02861. [DOI] [Google Scholar]
- Annadhasan M.; Kumarasamyvel T. M.; Sankar Babu V. R.; Rajendiran N. Green Prepared Silver and Gold Nanoparticles for Colorimetric Detection of Hg2+, Pb2+, and Mn2+ in Aqueous Medium. ACS Sustainable Chem. Eng. 2014, 2, 887–896. 10.1021/sc400500z. [DOI] [Google Scholar]
- Annadhasan M.; Kasthuri J.; Rajendiran N. Green preparation of gold nanoparticles under sunlight irradiation and their colorimetric detection of Ni2+ and Co2+ ions. RSC Adv. 2015, 5, 11458–11468. 10.1039/C4RA14034F. [DOI] [Google Scholar]
- Lewis D. J.; Day T. M.; MacPherson J. V.; Pikramenou Z. Luminescent nanobeads: attachment of surface reactive Eu(III) complexes to gold nanoparticles. Chem. Commun. 2006, 13, 1433–1435. 10.1039/b518091k. [DOI] [PubMed] [Google Scholar]
- Agnihotri S.; Mukherji S.; Mukherji S. Size-controlled silver nanoparticles preparationed over the range 5–100 nm using the same protocol and their antibacterial efficacy. RSC Adv. 2014, 4, 3974–3983. 10.1039/C3RA44507K. [DOI] [Google Scholar]
- Han X.; Wang H.; Qu X.; Zhang X. Highly selective, reproducible and stable SERS sensors based on well-controlled silver nanoparticle-decorated silicon nanowire building blocks. J. Mater. Chem. 2012, 22, 14127–14132. 10.1039/c2jm31443f. [DOI] [Google Scholar]
- Pandey S.; Mewada A.; Thakur M.; Shinde S.; Shah R.; Oza G.; Sharon M. Rapid biopreparation of silver nanoparticles by exploiting the reducing potential of trapabi spinosa peel extract. J. Nanosci. 2013, 2013, 516357 10.1155/2013/516357. [DOI] [Google Scholar]
- Abthagir P. S.; Saraswathi R. Charge transport and thermal properties of polyindole, polycarbazole and their derivatives. Thermochim. Acta 2004, 424, 25–35. 10.1016/j.tca.2004.04.028. [DOI] [Google Scholar]
- Khan M. A. M.; Kumar S.; Ahamed M.; Alrokayan S. A.; AlSalhi M. S. Structural and thermal studies of silver nanoparticles and electrical transport study of their thin films. Nanoscale Res. Lett. 2011, 6, 434–441. 10.1186/1556-276X-6-434. [DOI] [PMC free article] [PubMed] [Google Scholar]
- Morzyk-Ociepa B. M.; Michalskab D.; Pietraszkoc A. Structures and vibrational spectra of indolecarboxylic acids. Part II. 5-Methoxyindole-2-carboxylic acid. J. Mol. Struct. 2004, 688, 87–94. 10.1016/j.molstruc.2003.09.029. [DOI] [Google Scholar]
- Gupta V. K.; Shoora S. K.; Kumawat L. K.; Jain A. K. A highly selective colorimetric and turn-on fluorescent chemosensor based on 1-(2-pyridylazo)-2-naphthol for the detection of aluminium(III) ions. Sens. Actuators, B 2015, 209, 15–24. 10.1016/j.snb.2014.10.143. [DOI] [Google Scholar]
- Raghav S.; Kumar D. Adsorption equilibrium, kinetics, and thermodynamic studies of fluoride absorbed by tetrametallic oxide adsorbent. J. Chem. Eng. Data 2018, 63, 1682–1697. 10.1021/acs.jced.8b00024. [DOI] [Google Scholar]
- Tan I. A. W.; Ahmad A. L.; Hameed B. H. Adsorption isotherms, kinetics, thermodynamics and desorption studies of 2,4,6-trichlorophenol on oil palm empty fruit bunch-based activated carbon. J. Hazard. Mater. 2009, 164, 473–482. 10.1016/j.jhazmat.2008.08.025. [DOI] [PubMed] [Google Scholar]
- Rahman N.; Haseen U. Equilibrium modeling, kinetic, and thermodynamic studies on adsorption of Pb(II) by a hybrid inorganic–organic material: polyacrylamide zirconium(IV) iodate. Ind. Eng. Chem. Res. 2014, 53, 8198–8207. 10.1021/ie500139k. [DOI] [Google Scholar]
- Liu Z.; Luo L.; Dong Y. H.; Weng G. J.; Li J. J. Resonance scattering amplification assay of biomolecules based on the biomineralization of gold nanoparticles bioconjugates. J. Colloid Interface Sci. 2011, 363, 182–186. 10.1016/j.jcis.2011.07.073. [DOI] [PubMed] [Google Scholar]
- Zhang F.; Zhang C. L.; Song L.; Zeng R. C.; Qui L. Y.; Cui H. Z. Corrosion resistance of superhydrophobic Mg-Al layered double hydroxide coatings on aluminium alloys. Acta Metall. Sin. 2015, 28, 1373–1381. 10.1007/s40195-015-0335-4. [DOI] [Google Scholar]
- Chen S.; Fang Y.-M.; Xiao Q.; Li J.; Li S.-B.; Chen H.-J.; Sun J.-J.; Yang H.-H. Rapid visual detection of aluminium ion using citrate capped gold nanoparticles. Analyst 2012, 137, 2021–2023. 10.1039/c2an35129c. [DOI] [PubMed] [Google Scholar]
- Sharma R.; Dhillon A.; Kumar D. Mentha-Stabilized Silver Nanoparticles for high-performance colorimetric detection of Al(III) in aqueous systems. Sci. Rep. 2018, 8, 5189 10.1038/s41598-018-23469-1. [DOI] [PMC free article] [PubMed] [Google Scholar]
Associated Data
This section collects any data citations, data availability statements, or supplementary materials included in this article.


