Abstract
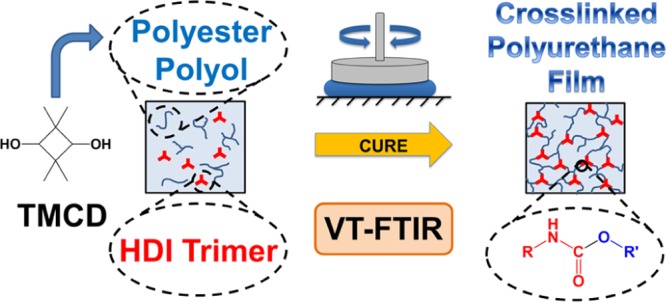
The sol–gel transition of a series of polyester polyol resins possessing varied secondary hydroxyl content and reacted with a polymerized aliphatic isocyanate cross-linking agent is studied to elucidate the effect of molecular architecture on cure behavior. Dynamic rheology is utilized in conjunction with time-resolved variable-temperature Fourier-transform infrared spectroscopy to examine the relationship between chemical conversion and microstructural evolution as functions of both time and temperature. The onset of a percolated microstructure is identified for all resins, and apparent activation energies extracted from Arrhenius analyses of gelation and average reaction kinetics are found to depend on the secondary hydroxyl content in the polyester polyols. The similarity between these two activation energies is explored. Gel point suppression is observed in all the resin systems examined, resulting in significant deviations from the classical gelation theory of Flory and Stockmayer. The magnitude of these deviations depends on secondary hydroxyl content, and a qualitative model is proposed to explain the observed phenomena, which are consistent with results previously reported in the literature.
1. Introduction
Polymeric systems are employed in a wide range of applications from precisely shaped 3D parts to protective film coatings on various substrates.1−5 For numerous coating technologies, thermosetting polymers are often found to be particularly attractive because of their inherent ability to form densely cross-linked networks that impart a favorable combination of mechanical, barrier, and chemical-resistance properties.2,6−8 Such coating systems can take the form of dry powders9−11 or variable-viscosity liquids (water-borne12,13 or solvent-borne14) and can be applied as aerosol sprays, brushed finishes, or rolled laminates onto a solid substrate prior to curing. Nearly all polymeric coatings are broadly divided into two categories: one-component (1K) and two-component (2K) systems.8 Most of these polymers are acrylic-, alkyd-, or polyester-based, and they react in the presence of a cross-linking agent to form dense molecular networks. Polyester-based urethane systems are popular 2K systems because of their versatility, desirable barrier/mechanical properties, and good weathering capability.15 Understanding their cure behavior is crucial for designing such multicomponent polymers for coatings applications. In these systems, a polyol/catalyst/solvent mixture is typically combined with an isocyanate cross-linking agent, and the resulting mixture is sprayed or painted onto a substrate. While properties for transparent coatings must adhere to quality standards that vary with application,16 coating viscosities must be compatible with the deposition method, and associated cross-linking behavior must be acceptable for industrially relevant cure conditions, as well as for favorable film properties once cured.
The monomer 2,2,4,4-tetramethyl 1,3-cyclobutanediol (TMCD) has been previously investigated15 in thermoplastic polyester systems and has been successfully commercialized as part of the Tritan copolyester manufactured by the Eastman Chemical Company. Prior efforts have demonstrated that TMCD improves the impact resistance of polyester-based systems while maintaining good thermal properties.17 However, studies describing how the incorporation of TMCD in a polyester backbone affects cure behavior in 2K thermosetting polyesters remain lacking. Chemical conversion and accompanying thermomechanical property evolution constitute two vital characteristics of a coating system when considering the cure behavior of any 2K thermosetting coating. Previous efforts in this vein have relied on thermal calorimetry to monitor reaction kinetics and the corresponding evolution of the glass transition temperature (Tg), dynamic rheology to identify the sol–gel transition (also known as the gel point), and spectroscopy to measure the time-dependent chemical conversion at various temperatures.18−25 These analytical techniques provide useful insights when performed independently but are especially valuable when used in parallel, as is the case here and in previous works.26,27 In this study, we seek to exploit the complementary benefits of dynamic rheology and variable-temperature spectroscopy by directly relating network evolution in TMCD-containing resins in 2K polyester-polyol resins systematically varying in backbone chemistry with chemical conversion during the cure process at different industrially relevant temperatures.
2. Experimental Section
2.1. Materials
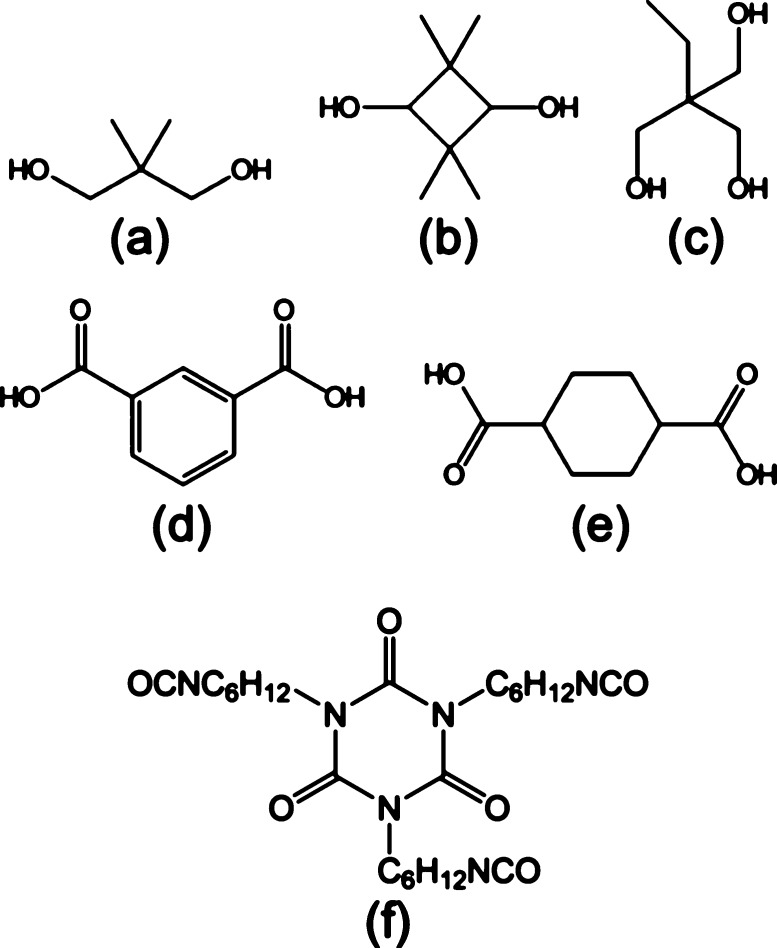
Polyester resins were supplied by Eastman Chemical Company and used as-received. Figure 1 depicts the chemical structures of all the monomers employed in the synthesis of the polyester resins. The cross-linking agent was hexamethylene diisocyanurate (HDI trimer), purchased from Covestro (Desmodur 3390 BA/SN) and also pictured in Figure 1. Dibutyltin dilaurate (95%) obtained from Sigma-Aldrich and urethane-grade methyl amyl ketone (MAK) supplied by the Eastman Chemical Company were both used without further purification.
Figure 1.
Chemical structures of the monomers used to synthesize polyester polyols are displayed in (a–e). (a) Neopentane glycol (NPG), (b) TMCD, (c) trimethylolpropane (TMP), (d) isophthalic acid (IPA), and (e) 1,4-cyclohexanediacid (CHDA). The chemical structure of the HDI trimer cross-linking agent is included in (f).
2.2. Methods
2.2.1. Specimen Preparation
Gel permeation chromatography with polystyrene standards was conducted in an Agilent Series 1260 liquid chromatograph with a UV/vis detector to measure the number-average molecular weight (Mn) and polydispersity index, or molar-mass dispersity (Đ), of each resin, the composition and properties of which are listed in Table 1. The dibutyltin dilaurate catalyst was mixed with MAK to produce a 1 wt % catalyst solution, which was added at 2.5 wt % (relative to the total solids) to a known quantity of polyester resin in MAK. This catalyst/polyester/solvent mixture, hereafter referred to as component “A,” was then agitated in the presence of a magnetic stir bar in a 20 mL glass scintillation vial until the polymer was fully dissolved (∼8 h). A predetermined quantity of component A was added to a 10 mL glass scintillation vial, and the cross-linking agent (component “B”) was added dropwise under agitation to achieve a NCO/OH stoichiometric ratio of 1.10 ± 0.02:1 at a constant solids content of 60 ± 2%. This mixture was then placed on a stir plate for 5 min at ambient temperature before analysis.
Table 1. Compositions and Selected Properties of Targeted Polyester-Polyol Resinsa.
| diol
composition (%) |
diacid
composition (%) |
||||||||
|---|---|---|---|---|---|---|---|---|---|
| resin Designation | NPG | TMCD | TMP | CHDA | IPA | Mn (Da) | Đ | OH # | secondary hydroxyl contentb (mol %) |
| 0T | 93.3 | 6.7 | 50 | 50 | 1562 | 1.7 | 113 | 0.0 | |
| 25T | 71.6 | 21.7 | 6.7 | 50 | 50 | 1616 | 1.8 | 111 | 21.7 |
| 50T | 46.7 | 46.6 | 6.7 | 50 | 50 | 1590 | 1.7 | 102 | 46.7 |
| 75T | 21.7 | 71.6 | 6.7 | 50 | 50 | 1707 | 1.8 | 97 | 71.7 |
| 100T | − | 93.3 | 6.7 | 50 | 50 | 1799 | 1.8 | 91 | 93.3 |
2.2.2. Rheological Analysis
Dynamic oscillatory shear rheology was conducted to monitor the cross-linking reaction of each polyester in the presence of the HDI trimer. All rheological measurements were performed on a TA Instruments Discovery Series Hybrid Rheometer HR-3, outfitted with a Peltier plate temperature-control system and operated with 40 mm aluminum parallel plates and a solvent trap. Each experiment commenced after sample equilibration for 5 min at the reaction temperature. Reaction progress was followed in situ as a function of time at a fixed strain amplitude within the linear viscoelastic regime of the sample at an angular frequency of 1 rad/s. Measured shear stresses were used to calculate the dynamic storage (G′) and loss (G″) moduli. To identify the temperature dependence of the gel point, times required for G′–G″ crossover were evaluated at four different temperatures for each resin. We further discuss this gel-point criterion in subsequent sections.
2.2.3. Variable-Temperature Spectroscopy
Variable-temperature Fourier-transform infrared (FTIR) spectroscopy was performed in attenuated total reflectance (ATR) mode on specimens with a Bio-Rad Excalibur Series spectrometer equipped with a germanium crystal and a PIKE Technologies heating stage. Approximately 0.05 g of each sample were placed on the crystal and heating stage, and a solvent trap was placed over the sample to prevent drying. The reaction clock began when the sample was placed on the stage, and spectra were collected as a function of time at each reaction temperature. A zero-point spectrum was collected 5 min after the sample was loaded to allow for excess CO2 to be flushed out of the spectrometer. Following the collection of FTIR spectra, baseline corrections were performed using the Win-IR Pro software package from Bio-Rad. Peak areas were calculated with Origin.
3. Results and Discussion
3.1. Gelation from Dynamic Rheology
Small-amplitude dynamic rheology identifies the time required to achieve G′–G″ crossover at 1 rad/s for all samples. This time, referred to as tc, affords an estimate of the gel point at which a contiguous network forms within a specimen. Networks are ubiquitous and important physical phenomena in polymers, as they are responsible for generating not only dense thermosets but also stretchy elastomers. Moreover, networks can be either chemically cross-linked, as is the case here, or they can be physically cross-linked in the case of, for instance, multiblock copolymers.28 Once tc is reached, G′ (a measure of elastic behavior) becomes equal to and subsequently greater than G″ (a measure of viscous behavior). Therefore, at this point in time, the sample begins to exhibit more solid-like behavior. According to the Winter–Chambon rheological criterion for gelation, the true gel point occurs when tan δ (=G″/G′) becomes independent of frequency.29,30 The systems examined here do not strictly adhere to the Winter–Chambon criterion over the temperature range examined, so a true gel point is not possible to identify. Therefore, defining tc as the transition from viscous- to solid-like behavior at a single frequency is considered sufficient for the purpose of this study. A representative time sweep is presented in Figure 2 for resin 0T at 45 °C and clearly reveals the existence of G′–G″ crossover at tc ≈ 130 min. Data such as these are employed to construct Figure 3a, which displays the average time for moduli crossover for all five resins examined at four different temperatures. An important observation in this figure is that resins possessing higher levels of secondary hydroxyl content due to the presence of TMCD require appreciably longer times for network formation. We attribute this result to the TMCD secondary hydroxyl groups, which make the monomer more sterically hindered than NPG or TMP with primary hydroxyl groups (see Figure 1).
Figure 2.
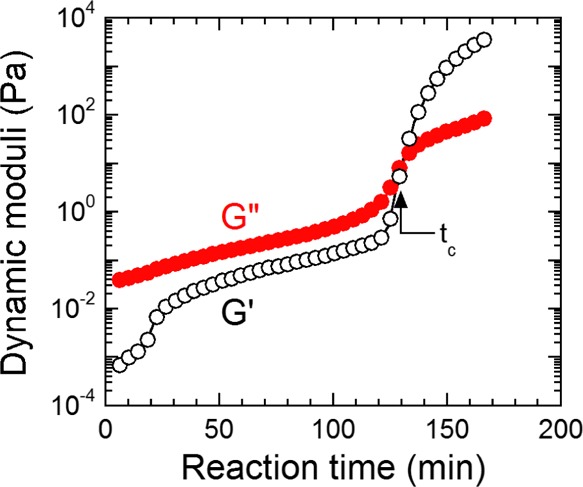
Variation of the dynamic moduli (G′ and G″, labeled and color-coded) with reaction time during the cure of resin 0T at 45 °C. The gel point at tc is identified at the G′–G″ crossover. The solid lines serve to connect the data.
Figure 3.
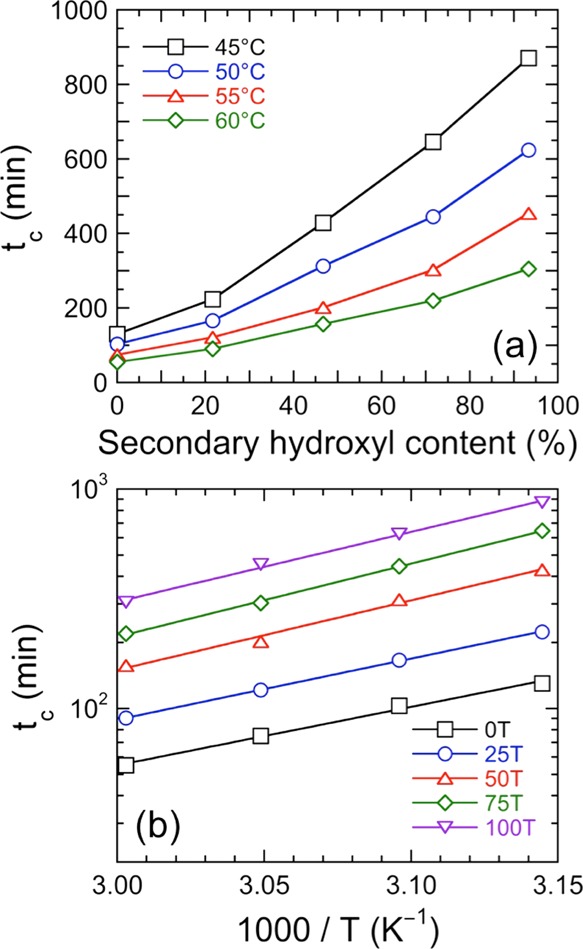
(a) Values of tc extracted from moduli crossover times (see Figure 2) as functions of resin composition (secondary hydroxyl content) and temperature (see color-coded legend). The color-matched solid lines serve to connect the data. (b) Arrhenius-style representation of tc as a function of reciprocal temperature for five different polyester-polyol resins (see color-coded legend). The solid lines are linear regressions of eq 1 to the data, and the apparent activation energy values extracted from the slopes are listed in Table 2.
In addition, the time required for modulus crossover is seen to increase systematically with decreasing reaction temperature, a feature that is consistent with the behavior of a thermally activated process. This expectation is confirmed by the linear trends evident in Figure 3b, which is an Arrhenius-style representation of the data provided in Figure 3a. Because of the thermally activated nature of the gelation process, previous studies31−34 of related systems have used an Arrhenius expression to extract values of the apparent activation energy (Ea) of gelation, viz.,
| 1 |
where tc,0 is a constant, R is the universal gas constant, and T denotes absolute temperature. Values of Ea calculated from the slopes of the lines in Figure 3b according to eq 1 are compiled in Table 2 for each resin. In general, resins with a higher secondary hydroxyl content exhibit higher Ea values. It is interesting that values of Ea ascertained for 0T and 25T are similar, while those for 50T, 75T, and 100T are likewise comparable. These groupings can be explained by considering the Flory–Stockmayer theory for gelation in conjunction with the difference in reactivity between primary and secondary hydroxyls.35,36 For all the resin systems examined, the theoretical conversion of the total alcohol functionality is approximately 50% at the gel point. Because the reactivity of the secondary hydroxyls differs substantially from primary hydroxyls in the presence of dibutyltin dilaurate catalyst,37 the secondary hydroxyls do not necessarily need to participate fully in network formation at concentration levels below ∼50% (e.g., samples 0T and 25T). Thus, the apparent activation energies reported here do not reflect the chemical kinetics governing the cross-linking reaction, but rather afford insight into network formation and the thermal process governing it.
Table 2. Apparent Activation Energies From Rheological and Spectroscopic Analysesa.
| resin designation | apparent gelation Ea (kJ/mol) | apparent kinetic Ea (kJ/mol) |
|---|---|---|
| 0T | 51.0 ± 2.9 | 62.9 ± 8.4 |
| 25T | 53.3 ± 0.6 | 58.3 ± 12.8 |
| 50T | 60.8 ± 4.0 | 61.6 ± 5.6 |
| 75T | 63.8 ± 1.3 | 71.0 ± 18.5 (40.4) |
| 100T | 61.0 ± 2.7 | 79.6 ± 10.6 (65.7) |
Parenthetical values exclude the kinetic rate constants at the lowest temperature examined.
Another classical network theory, proposed by Carothers,38 has been expanded to include nonstoichiometric monomer mixtures by Pinner.39 This theory and its subsequent expansion predict significantly higher critical extents of conversion to achieve gelation in polymeric systems than those given by Flory and Stockmayer.35,36,40 We return to discuss this topic further in following sections.
3.2. Reactivity from Chemical Spectroscopy
Variable-temperature FTIR permits tracking the time-dependent intensity of the isocyanate peak for the five resins examined at four temperatures (45, 50, 55, and 60 °C). Examples of overlaid FTIR spectra collected from one resin (100T) at one temperature (55 °C) are displayed for illustrative purposes at several reaction times in Figure 4. To determine the concentration of the isocyanate functional group as a function of time, we first measure the area below the isocyanate stretch peak located at ∼2260 cm–1 and then normalize the result with respect to the area below the C–H stretch peaks between ∼2840 and ∼3050 cm–1. The conversion of the isocyanate functional group (p) at any given time (t) is then calculated from
| 2 |
where At is the normalized area under the isocyanate peak at t and A0 is the normalized area under the isocyanate peak at t = 5 min. [The true zero time was not used because excess CO2 had to be flushed from the spectrometer once the sample was loaded.] The same procedure has been followed for all five resins, and the conversion of the isocyanate peak has been monitored as functions of both time and temperature, as illustrated in Figure 5a for resin 100T. These results confirm that the reaction reaches full conversion faster at higher temperatures and that full conversion appears to be achieved in less than 20 h over the temperature range examined here.
Figure 4.
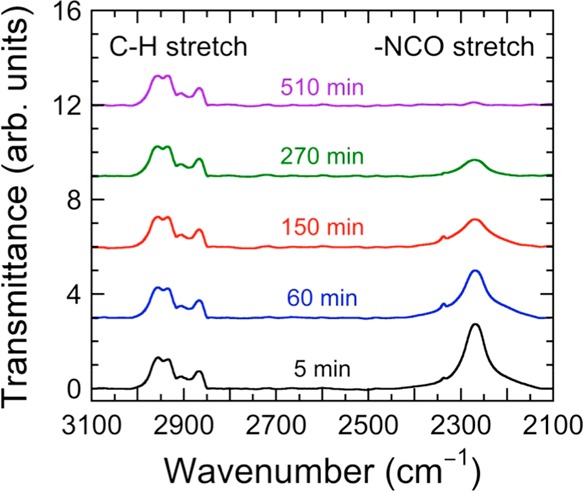
Representative FTIR spectra acquired at different reaction times (labeled and color-coded) from the 100T resin at 55 °C. Disappearance of the isocyanate peak at 2260 cm–1 (identified), normalized with respect to the C–H stretch peak (identified), is used to determine the reaction kinetics.
Figure 5.
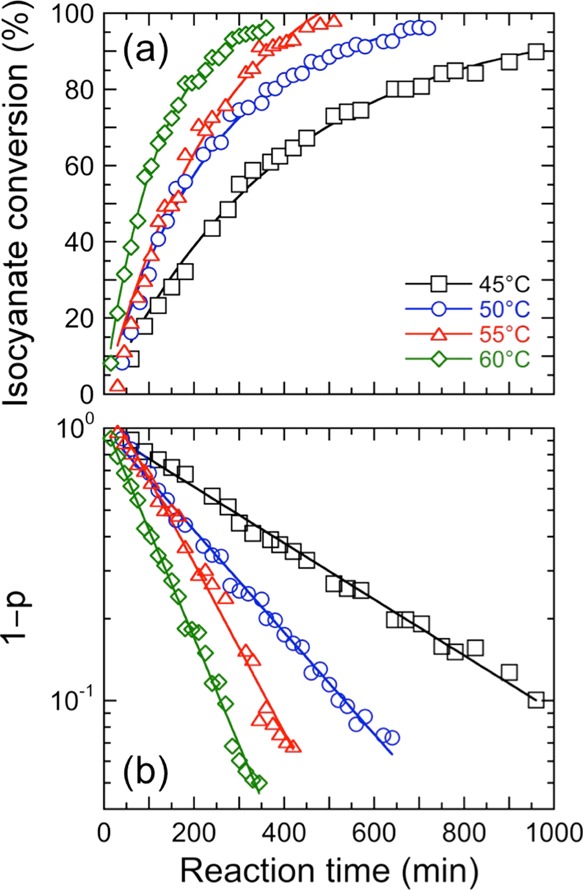
(a) Isocyanate conversion (p) calculated for resin 100T from eq 2 in the text and presented as a function of reaction time at four different temperatures (see color-coded legend). The color-matched solid lines serve as guides for the eye. (b) Isocyanate conversion for resin 100T presented as a function of reaction time according to first-order kinetics (see eq 4) at the same four temperatures as in (a). The color-matched solid lines are linear regressions to the data, and the slopes yield the kinetic rate constants.
By assuming first-order reaction kinetics, the data presented in Figure 5a can be analyzed to extract kinetic rate constant (k) values. In this scenario, p can be written as
| 3 |
Algebraic rearrangement of eq 3 yields
| 4 |
in which case a plot of (1 – p) versus t on semi-logarithmic coordinates is expected to yield a linear trend, which is clearly observed in Figure 5b. The results displayed in Figure 5b are consistent with first-order reaction kinetics with respect to the isocyanate group for all five resin systems. To confirm the existence of first-order kinetics and rule out other possibilities, we have also examined the conversion data for all five systems in the context of second-order kinetics with respect to the isocyanate group. The linear trends obtained from first-order kinetics agree much more closely with the measured conversions. The slopes of the curves in Figure 5b afford the first-order rate constants for resin 100T over the four temperatures examined. For consistency with the rheological analysis, we have elected to include data points from the beginning of the reaction to the time corresponding to the modulus crossover in our rheological tests. As such, the rate constants obtained from conversion–time plots such as the one shown in Figure 5b constitute average rate constants for the reaction between t = 5 min and t ≈ tc.
First-order kinetic rate constants discerned for the five resin systems are provided as functions of secondary hydroxyl content and temperature in Figure 6. As anticipated, the rate constants generally increase with increasing temperature for all five resin systems examined and decrease with increasing secondary hydroxyl content. To relate the temperature dependence of these first-order rate constants to the secondary hydroxyl content, Figure 7 plots the data acquired for each resin in Arrhenius form. In accord with our earlier analysis employing this representation (cf. Figure 3b), the slope of each line is used to extract the apparent kinetic activation energy of each resin up to tc. These apparent activation energies are included for comparison with the apparent activation energies of gelation in Table 2. In Figure 7, the linearity of the data corresponding to the TMCD-rich resin systems (75T and 100T) appears to deviate at the lowest temperature examined (45 °C).
Figure 6.
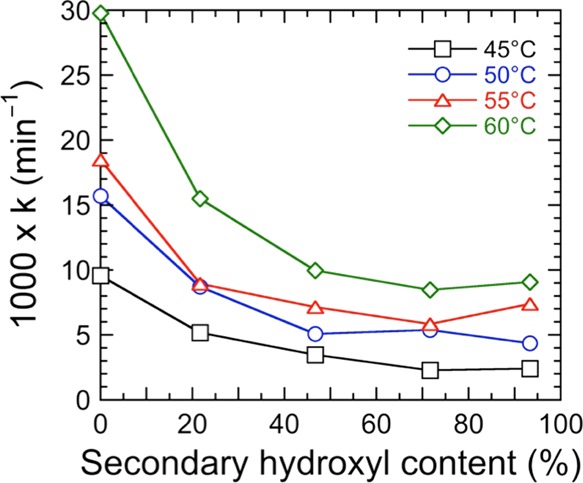
Dependence of the first-order kinetic rate constants calculated from plots such as the one provided in Figure 5b on composition at four different temperatures (see color-coded legend). The color-matched solid lines serve to connect the data.
Figure 7.
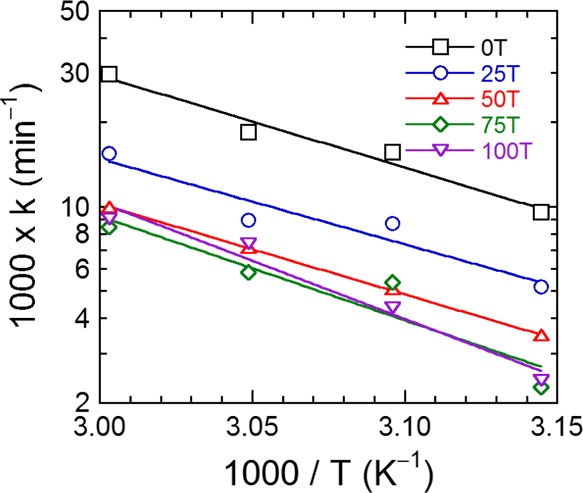
Arrhenius-style representation of the kinetic rate constants as a function of reciprocal temperature for five different polyester-polyol resins (see color-coded legend). The solid lines are linear regressions to the data, and the apparent activation energy values extracted from the slopes are included in Table 2.
To take this deviation into account, the apparent activation energies tabulated in Table 2 for these two resins are calculated with and without the datum point measured at 45 °C. This deviation at low temperature might be indicative of nontrivial diffusion limitations within the system as it cures. All the apparent kinetic activation energy values reported here naturally involve some degree of complex interplay between reaction and diffusion limitations because they are derived from average kinetic rate constants from the initial time (when the system behaves highly Newtonian) to the modulus crossover time (when the system begins to exhibit more solid- than viscous-like behavior). Another important consideration is that an increase in secondary hydroxyl content due to TMCD incorporation induces chain stiffening of the polyester resin. The impact of this phenomenon is discussed further below.
The apparent activation energies of gelation, measured by dynamic rheology, and the apparent kinetic activation energy, measured by VT-FTIR, are compared in Figure 8. While this comparison does not include the activation energies for the 75T and 100T resins calculated by omitting the rate constants measured at 45 °C, we note that the rheological activation energy values are generally lower than those determined by chemical analysis. The error bars included in Figure 8 correspond to the standard error in the slope of the Arrhenius-style representations used to ascertain Ea for each resin system. It is comforting that the measured apparent kinetic activation energies and apparent activation energies of gelation are relatively close and, in most cases, equal within experimental error. Such agreement does not, however, have to be the case. Because gelation is undoubtedly a thermally activated process, it can be modeled as an Arrhenius phenomenon. With this expectation notwithstanding, the activation energy does not take into account the molecular-level phenomena accompanying a physical phase transition, but is rather a measure of the temperature dependence of a mechanical property. In contrast, the apparent kinetic activation energies provide insight into the chemical changes occurring within the resins due to the cross-linking reaction and can be used in conjunction with measured reaction times to determine the relative reactivity of the different hydroxyl-containing constituents. As we have measured it here, the apparent kinetic activation energy constitutes an average activation energy from the beginning of the reaction to the modulus crossover time and provides information not only on the chemical nature of the reactive system as the cross-linked network develops, but also on how the hydroxyl reactivities change along the reaction coordinate.
Figure 8.
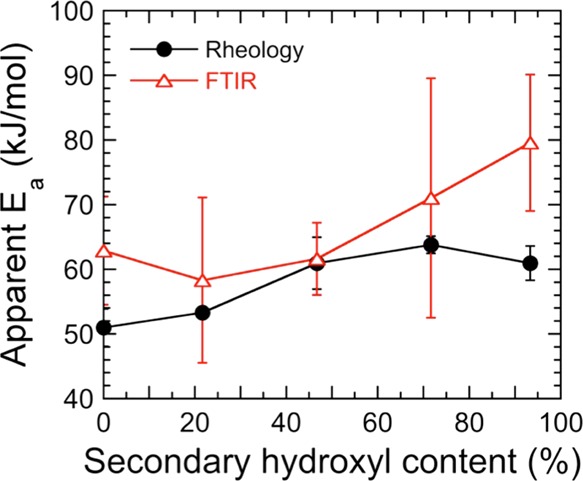
Comparison of apparent activation energies of gelation and reaction (see color-coded legend) as determined by rheological and spectroscopic analyses, respectively. The error bars correspond to the standard error, and the color-matched solid lines serve to connect the data.
3.3. Critical Extent of Conversion
Another important metric of the present thermosetting resins is the critical extent of isocyanate conversion calculated at the time required for modulus crossover, as discerned by dynamic rheology. This critical conversion evaluated at tc is presented in Figure 9. Two important observations are immediately evident in this figure. The first is that the critical conversion gradually increases from ∼71 to 93% with increasing secondary hydroxyl content. Moreover, for all the resins examined, the critical conversion at tc deviates significantly from predictions afforded by the Flory–Stockmayer theory.35,36 According to this theory, all reactive moieties in a chain possess the same reactivity that does not change as the reaction proceeds and microstructure develops. These results also deviate from Carothers’ theory under nonstoichiometric conditions when the statistical secondary hydroxyl content is above 50%.38−40 Moreover, these theories do not take into account any reactions that form network defects. Deviation from these theories increases further as the secondary hydroxyl content approaches 100%. Similar deviations of theoretical gel points reported in previous studies have been explained by such phenomena as intramolecular cyclization, intramolecular cross-linking, microgelation, and excluded volume effects especially at high molecular weights.41−44 We attribute such deviation in the present work to two different reasons. One is the catalyst choice, because dibutyltin dilaurate catalyzes the isocyanate reaction with primary hydroxyls and water much more effectively than it catalyzes the reaction of isocyanate with secondary hydroxyls.37 Although these resins are presumed to be dry, residual water from either the atmosphere or the solvent can react with the isocyanate to form urea. If present, every water molecule will react with two isocyanate functionalities to form a urea linkage.45
Figure 9.
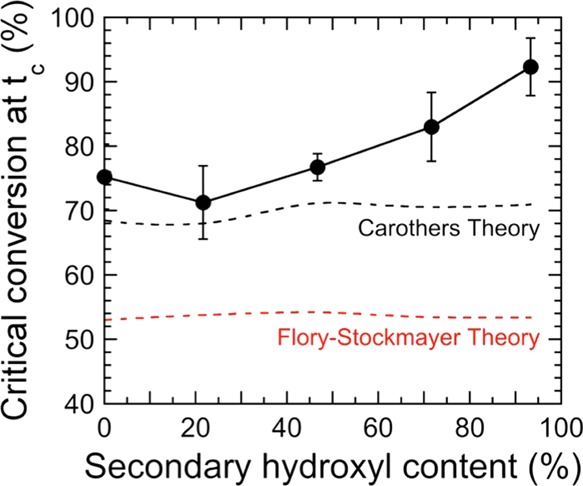
Critical isocyanate conversion levels evaluated by VT-FTIR spectroscopy at the G′–G″ crossover as a function of resin composition. Corresponding predictions from the Flory–Stockmayer theory35,36 and Carothers’ theory38−40 are also included for comparison (red and black dashed lines, respectively), and the solid line serves to connect the data.
A more significant and related consideration is the unequal reactivity between different types of hydroxyl groups, and the resulting change in Tg. The effect of TMCD addition on the Tg of comparable films is the subject of a companion study.999 These differences are believed to be responsible for heterogeneous cross-linking and corresponding network fluctuations within the system, as confirmed previously by both experimental and computational studies.46−49 Isocyanate groups on the cross-linking agent react much more rapidly with primary hydroxyls than with secondary hydroxyls. As a result, nearly all the primary hydroxyls react first, creating cross-linked microenvironments possessing a high cross-link density. Because of their size and irregular shape, these fluctuation regions diffuse more slowly and ultimately take a longer time to encounter one another and undergo further cross-linking. In the meantime, however, they continue to react within their local environments, thereby forming larger volumes of more highly cross-linked chains without the formation of a space-filling (percolated) network. Within these local environments, network defects do not promote network elasticity development and therefore do not contribute to mechanical properties measured by dynamic rheology up to tc. The chemical reaction continues to proceed, leading to a phenomenon previously reported as gel-point suppression.51,52 Resultant network defects take the form of loops (which behave as single-anchored polymer tails) instead of bridges (which serve as connecting units during network formation).28 The existence of loops has been recently quantified using experimental and computational techniques for several chemically cross-linked polymer systems.51,53−55 The propensity of loop defects is exacerbated by reaction medium concentration, as demonstrated56 for tetrafunctional reactants. With the presence of ∼40 wt % MAK in the present systems, we propose that such defects become increasingly prevalent as the TMCD content is increased, as evidenced by the results displayed in Figure 9. Fluctuations continue to grow until they ultimately encounter one another, at which time they can react to form a space-filling network.
4. Conclusions
In this work, the cross-linking behavior of model polyester–polyol systems has been investigated by both mechanical and chemical means, and the two characterization techniques have been used in conjunction to systematically identify material changes as the systems cross-link and ultimately reach the sol–gel transition. We have established that an incremental increase in the secondary hydroxyl content in the backbone (due to incorporation of TMCD) serves to increase both the reaction time and the critical conversion (measured by VT-FTIR) at the modulus crossover time (measured by dynamic rheology). Although the present resins do not strictly adhere to the Winter–Chambon criterion for gelation,29,30 the G′–G″ crossover is identified here as the effective gel point at which the resins undergo their sol–gel transition. Values of the effective activation energies of gelation and reactivity are in favorable quantitative agreement (within experimental error), directly confirming that the isocyanate reaction is coupled to the growing network. A conceptual rationalization has been proposed to explain deviations from theoretical models (such as the Carothers’ theory38−40 and classic Flory–Stockmayer theory35,36) that do not consider heterogeneities in cross-linking behavior or loop formation during cure. It lies at the intersection of two competing molecular-level processes: chemical cross-linking and chain vitrification. As the secondary hydroxyl content is increased in the present resins, the stiffness of the backbone also increases due to the sterically hindered nature of the TMCD monomer relative to NPG. This increased stiffness reduces chain mobility and increases cross-linking heterogeneity. Groups of chains are more likely to react with those functional groups in closer proximity, leading to the formation of loops as opposed to branches in the network. Figure 10 is a schematic illustration of this process. While computer simulations are currently unavailable to elucidate the conditions responsible for the formation of defects during cure, this explanation is consistent with previous studies that have identified heterogeneous network formation and loop development within network-forming polymers.54,55,57−59 The cure behavior reported in this study provides useful mechanochemical insight into the cure process of polyester-polyol resins and can be used to design and synthesize multicomponent resins for specific coating applications.
Figure 10.
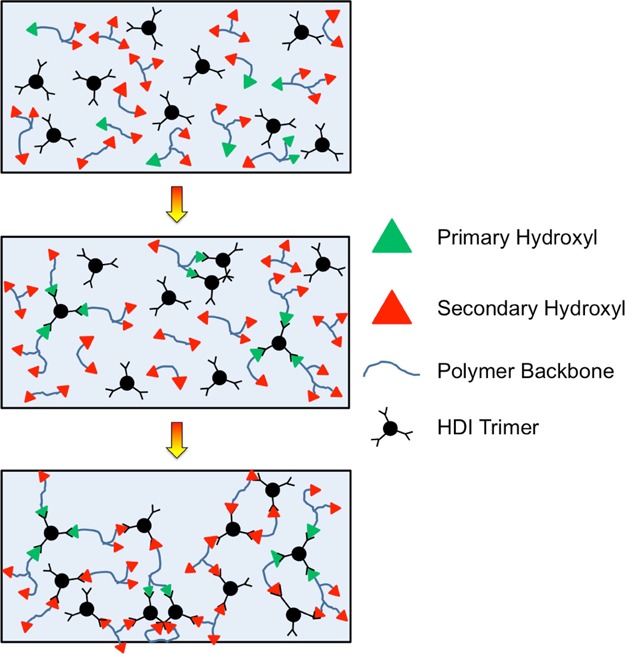
Schematic representation of the cross-linking reaction of polyester-polyols composed of monomer species with primary and secondary hydroxyl groups (see legend).
Acknowledgments
This work was supported by the Eastman Center of Excellence at NC State University. We thank Professor Stefan Franzen in the Department of Chemistry at NC State University for the use of the VT-FTIR spectrometer.
The authors declare no competing financial interest.
References
- Garcés J. M.; Moll D. J.; Bicerano J.; Fibiger R.; McLeod D. G. Polymeric Nanocomposites for Automotive Applications. Adv. Mater. 2000, 12, 1835–1839. . [DOI] [Google Scholar]
- Chattopadhyay D. K.; Raju K. V. S. N. Structural engineering of polyurethane coatings for high performance applications. Prog. Polym. Sci. 2007, 32, 352–418. 10.1016/j.progpolymsci.2006.05.003. [DOI] [Google Scholar]
- Yang Y.; Yu G.; Cha J. J.; Wu H.; Vosgueritchian M.; Yao Y.; Bao Z.; Cui Y. Improving the Performance of Lithium-Sulfur Batteries by Conductive Polymer Coating. ACS Nano 2011, 5, 9187–9193. 10.1021/nn203436j. [DOI] [PubMed] [Google Scholar]
- Twite R. L.; Bierwagen G. P. Review of alternatives to chromate for corrosion protection of aluminum aerospace alloys. Prog. Org. Coat. 1998, 33, 91–100. 10.1016/s0300-9440(98)00015-0. [DOI] [Google Scholar]
- Arora A.; Padua G. W. Review: Nanocomposites in Food Packaging. J. Food Sci. 2010, 75, R43–R49. 10.1111/j.1750-3841.2009.01456.x. [DOI] [PubMed] [Google Scholar]
- Raquez J.-M.; Deléglise M.; Lacrampe M.-F.; Krawczak P. Thermosetting (bio)materials derived from renewable resources: A critical review. Prog. Polym. Sci. 2010, 35, 487–509. 10.1016/j.progpolymsci.2010.01.001. [DOI] [Google Scholar]
- Bajat J. B.; Mišković-Stanković V. B. Protective properties of epoxy coatings electrodeposited on steel electrochemically modified by Zn-Ni alloys. Prog. Org. Coat. 2004, 49, 183–196. 10.1016/j.porgcoat.2003.09.019. [DOI] [Google Scholar]
- Sørensen P. A.; Kiil S.; Dam-Johansen K.; Weinell C. E. Anticorrosive coatings: a review. J. Coat. Technol. Res. 2009, 6, 135–176. 10.1007/s11998-008-9144-2. [DOI] [Google Scholar]
- Belder E. G.; Rutten H. J. J.; Perera D. Y. Cure characterization of powder coatings. Prog. Org. Coat. 2001, 42, 142–149. 10.1016/s0300-9440(01)00149-7. [DOI] [Google Scholar]
- Ramis X.; Cadenato A.; Morancho J. M.; Salla J. M. Curing of a thermosetting powder coating by means of DMTA, TMA and DSC. Polymer 2003, 44, 2067–2079. 10.1016/s0032-3861(03)00059-4. [DOI] [Google Scholar]
- Misev T. A.; van der Linde R. Powder coatings technology: new developments at the turn of the century. Prog. Org. Coat. 1998, 34, 160–168. 10.1016/s0300-9440(98)00029-0. [DOI] [Google Scholar]
- Decker C.; Masson F.; Schwalm R. Dual-Curing of Waterborne Urethane-Acrylate Coatings by UV and Thermal Processing. Macromol. Mater. Eng. 2003, 288, 17–28. 10.1002/mame.200290029. [DOI] [Google Scholar]
- Xu H.; Qiu F.; Wang Y.; Wu W.; Yang D.; Guo Q. UV-curable waterborne polyurethane-acrylate: preparation, characterization and properties. Prog. Org. Coat. 2012, 73, 47–53. 10.1016/j.porgcoat.2011.08.019. [DOI] [Google Scholar]
- Jones F. N.; Nichols M. E.; Pappas S. P.. Organic coatings: Science and Technology, 4th ed.; John Wiley & Sons: Hoboken, NJ, 2017. [Google Scholar]
- Marsh S.Raising Polyester Performance with TMCD Glycol. The Waterborne Symposium: Proc. 39th Ann. Int. Waterborne, High-Solids, Powder Coatings Symposium; DEStech Publications: Lancaster Penn., 2012; pp 263–276.
- Weiss K. D. Paint and coatings: A mature industry in transition. Prog. Polym. Sci. 1997, 22, 203–245. 10.1016/s0079-6700(96)00019-6. [DOI] [Google Scholar]
- Kelsey D. R.; Scardino B. M.; Grebowicz J. S.; Chuah H. H. High Impact, Amorphous Terephthalate Copolyesters of Rigid 2,2,4,4-Tetramethyl-1,3-cyclobutanediol with Flexible Diols. Macromolecules 2000, 33, 5810–5818. 10.1021/ma000223+. [DOI] [Google Scholar]
- Li S.; Vatanparast R.; Lemmetyinen H. Cross-linking kinetics and swelling behaviour of aliphatic polyurethane. Polymer 2000, 41, 5571–5576. 10.1016/s0032-3861(99)00785-5. [DOI] [Google Scholar]
- Li S.; Vatanparast R.; Vuorimaa E.; Lemmetyinen H. Curing kinetics and glass-transition temperature of hexamethylene diisocyanate-based polyurethane. J. Polym. Sci., Part B: Polym. Phys. 2000, 38, 2213–2220. . [DOI] [Google Scholar]
- Fernandez d’Arlas B.; Rueda L.; Stefani P. M.; de la Caba K.; Mondragon I.; Eceiza A. Kinetic and thermodynamic studies of the formation of a polyurethane based on 1,6-hexamethylene diisocyanate and poly(carbonate-co-ester)diol. Thermochim. Acta 2007, 459, 94–103. 10.1016/j.tca.2007.03.021. [DOI] [Google Scholar]
- Lipshitz S. D.; Macosko C. W. Rheological changes during a urethane network polymerization. Polym. Eng. Sci. 1976, 16, 803–810. 10.1002/pen.760161205. [DOI] [Google Scholar]
- Macosko C. W. Rheological changes during crosslinking. Br. Polym. J. 1985, 17, 239–245. 10.1002/pi.4980170228. [DOI] [Google Scholar]
- Kim D. S.; Macosko C. W. Reaction kinetics and chemorheology of a highly reactive PU system. Korea Polym. J. 1996, 4, 54–60. [Google Scholar]
- Burel F.; Feldman A.; Bunel C. Hydrogenated hydroxy-functionalized polyisoprene (H-HTPI) and isocyanurate of isophorone diisocyanates (I-IPDI): reaction kinetics study using FTIR spectroscopy. Polymer 2005, 46, 15–25. 10.1016/j.polymer.2004.10.080. [DOI] [Google Scholar]
- Maji P. K.; Bhowmick A. K. Influence of number of functional groups of hyperbranched polyol on cure kinetics and physical properties of polyurethanes. J. Polym. Sci., Part A: Polym. Chem. 2009, 47, 731–745. 10.1002/pola.23185. [DOI] [Google Scholar]
- Lucio B.; de la Fuente J. L. Rheological cure characterization of an advanced functional polyurethane. Thermochim. Acta 2014, 596, 6–13. 10.1016/j.tca.2014.09.012. [DOI] [Google Scholar]
- Fu X.-l.; Fan X.-z. Curing reaction kinetics of HTPE polymer studied by simultaneous rheometry and FTIR measurements. J. Therm. Anal. Calorim. 2016, 125, 977–982. 10.1007/s10973-016-5485-8. [DOI] [Google Scholar]
- Tuhin M. O.; Ryan J. J.; Sadler J. D.; Han Z.; Lee B.; Smith S. D.; Pasquinelli M. A.; Spontak R. J. Microphase-Separated Morphologies and Molecular Network Topologies in Multiblock Copolymer Gels. Macromolecules 2018, 51, 5173–5181. 10.1021/acs.macromol.8b00853. [DOI] [Google Scholar]
- Winter H. H.; Chambon F. Analysis of Linear Viscoelasticity of a Crosslinking Polymer at the Gel Point. J. Rheol. 1986, 30, 367–382. 10.1122/1.549853. [DOI] [Google Scholar]
- Chambon F.; Winter H. H. Linear Viscoelasticity at the Gel Point of a Crosslinking PDMS with Imbalanced Stoichiometry. J. Rheol. 1987, 31, 683–697. 10.1122/1.549955. [DOI] [Google Scholar]
- Chiou B.-S.; English R. J.; Khan S. A. Rheology and Photo-Cross-Linking of Thiol–Ene Polymers. Macromolecules 1996, 29, 5368–5374. 10.1021/ma960383e. [DOI] [Google Scholar]
- Raghavan S. R.; Chen L. A.; McDowell C.; Khan S. A.; Hwang R.; White S. Rheological study of crosslinking and gelation in chlorobutyl elastomer systems. Polymer 1996, 37, 5869–5875. 10.1016/s0032-3861(96)00446-6. [DOI] [Google Scholar]
- Weng L.; Chen X.; Chen W. Rheological Characterization of in Situ Crosslinkable Hydrogels Formulated from Oxidized Dextran andN-Carboxyethyl Chitosan. Biomacromolecules 2007, 8, 1109–1115. 10.1021/bm0610065. [DOI] [PMC free article] [PubMed] [Google Scholar]
- Madbouly S. A.; Xia Y.; Kessler M. R. Rheological Behavior of Environmentally Friendly Castor Oil-Based Waterborne Polyurethane Dispersions. Macromolecules 2013, 46, 4606–4616. 10.1021/ma400200y. [DOI] [Google Scholar]
- Flory P. J. Molecular Size Distribution in Three Dimensional Polymers. I. Gelation1. J. Am. Chem. Soc. 1941, 63, 3083–3090. 10.1021/ja01856a061. [DOI] [Google Scholar]
- Stockmayer W. H. Theory of Molecular Size Distribution and Gel Formation in Branched Polymers II. General Cross Linking. J. Chem. Phys. 1944, 12, 125–131. 10.1063/1.1723922. [DOI] [Google Scholar]
- Rand L.; Thir B.; Reegen S. L.; Frisch K. C. Kinetics of alcohol-isocyanate reactions with metal catalysts. J. Appl. Polym. Sci. 1965, 9, 1787–1795. 10.1002/app.1965.070090514. [DOI] [Google Scholar]
- Carothers W. H. Polymers and polyfunctionality. Trans. Faraday Soc. 1936, 32, 39–49. 10.1039/tf9363200039. [DOI] [Google Scholar]
- Pinner S. H. Functionality of non-equivalent mixtures. J. Polym. Sci. 1956, 21, 153–157. 10.1002/pol.1956.120219718. [DOI] [Google Scholar]
- Odian G. G.Principles of Polymerization, 4th ed.; John Wiley & Sons: New York, 2004. [Google Scholar]
- Matsumoto A.; Okuno S.; Aota H. Actual evaluation of flory-stockmayer gelation theory in free-radical monovinyl-divinylcopolymerization. Macromol. Symp. 2011, 93, 1–10. 10.1002/masy.19950930104. [DOI] [Google Scholar]
- Dotson N. A.; Macosko C. W.; Tirrell M.. Synthesis, Characterization, and Theory of Polymeric Networks and Gels; Plenum Press, 1992. [Google Scholar]
- Anseth K. S.; Bowman C. N. Kinetic Gelation model predictions of crosslinked polymer network microstructure. Chem. Eng. Sci. 1994, 49, 2207–2217. 10.1016/0009-2509(94)e0055-u. [DOI] [Google Scholar]
- Naghash H. J.; Okay O. Formation and Structure of Polyacrylamide Gels. J. Appl. Polym. Sci. 1996, 60, 971–979. . [DOI] [Google Scholar]
- Ni H.; Nash H. A.; Worden J. G.; Soucek M. D. Effect of catalysts on the reaction of an aliphatic isocyanate and water. J. Polym. Sci., Part A: Polym. Chem. 2002, 40, 1677–1688. 10.1002/pola.10245. [DOI] [Google Scholar]
- Pervaje A. K.; Tilly J. C.; Inglefield D. L. Jr.; Spontak R. J.; Khan S. A.; Santiso E. E. Modeling polymer glass transition properties from empirical monomer data with the SAFT-γ Mie force field. Macromolecules 2018, 51, 9526–9537. 10.1021/acs.macromol.8b01734. [DOI] [Google Scholar]
- Miller D. R.; Macosko C. W. Average Property Relations for Nonlinear Polymerization with Unequal Reactivity. Macromolecules 1978, 11, 656–662. 10.1021/ma60064a008. [DOI] [Google Scholar]
- Krakovský I.; Bubeníková Z.; Urakawa H.; Kajiwara K. Inhomogeneous structure of polyurethane networks based on poly(butadiene)diol: 1. The effect of the poly(butadiene)diol content. Polymer 1997, 38, 3637–3643. 10.1016/s0032-3861(96)00897-x. [DOI] [Google Scholar]
- Tanaka Y.; Stanford J. L.; Stepto R. Interpretation of Gel Points of an Epoxy-Amine System Including Ring Formation and Unequal Reactivity: Measurements of Gel Points and Analyses on Ring Structures. Macromolecules 2012, 45, 7197–7205. 10.1021/ma3009838. [DOI] [Google Scholar]
- Elliott J. E.; Bowman C. N. Kinetics of Primary Cyclization Reactions in Cross-Linked Polymers: An Analytical and Numerical Approach to Heterogeneity in Network Formation. Macromolecules 1999, 32, 8621–8628. 10.1021/ma990797i. [DOI] [Google Scholar]
- Wang R.; Lin T.-S.; Johnson J. A.; Olsen B. D. Kinetic Monte Carlo Simulation for Quantification of the Gel Point of Polymer Networks. ACS Macro Lett. 2017, 6, 1414–1419. 10.1021/acsmacrolett.7b00586. [DOI] [PubMed] [Google Scholar]
- Yan M.; Huang Y.; Lu M.; Lin F.-Y.; Hernández N. B.; Cochran E. W. Gel Point Suppression in RAFT Polymerization of Pure Acrylic Cross-Linker Derived from Soybean Oil. Biomacromolecules 2016, 17, 2701–2709. 10.1021/acs.biomac.6b00745. [DOI] [PubMed] [Google Scholar]
- Wang R.; Johnson J. A.; Olsen B. D. Odd-Even Effect of Junction Functionality on the Topology and Elasticity of Polymer Networks. Macromolecules 2017, 50, 2556–2564. 10.1021/acs.macromol.6b01912. [DOI] [Google Scholar]
- Kawamoto K.; Zhong M.; Wang R.; Olsen B. D.; Johnson J. A. Loops versus Branch Functionality in Model Click Hydrogels. Macromolecules 2015, 48, 8980–8988. 10.1021/acs.macromol.5b02243. [DOI] [Google Scholar]
- Zhong M.; Wang R.; Kawamoto K.; Olsen B. D.; Johnson J. A. Quantifying the impact of molecular defects on polymer network elasticity. Science 2016, 353, 1264–1268. 10.1126/science.aag0184. [DOI] [PubMed] [Google Scholar]
- Lin T.-S.; Wang R.; Johnson J. A.; Olsen B. D. Topological Structure of Networks Formed from Symmetric Four-Arm Precursors. Macromolecules 2018, 51, 1224–1231. 10.1021/acs.macromol.7b01829. [DOI] [Google Scholar]
- Wang J.; Lin T.-S.; Gu Y.; Wang R.; Olsen B. D.; Johnson J. A. Counting Secondary Loops Is Required for Accurate Prediction of End-Linked Polymer Network Elasticity. ACS Macro Lett. 2018, 7, 244–249. 10.1021/acsmacrolett.8b00008. [DOI] [PubMed] [Google Scholar]
- Dušek K.; Galina H.; Mikeš J. Features of network formation in the chain crosslinking (co)polymerization. Polym. Bull. 1980, 3, 19–25. 10.1007/bf00263201. [DOI] [Google Scholar]
- Mayne J. E. O.; Scantlebury J. D. Ionic conduction in polymer films: II. Inhomogeneous structure of varnish films. Br. Polym. J. 1970, 2, 240–243. 10.1002/pi.4980020407. [DOI] [Google Scholar]


