

Abstract
Regulatory T cells (Tregs) are key brakes on the visceral adipose tissue (VAT) inflammation that regulates local and systemic metabolic tenor. Breakdown of this regulation promotes type 2 diabetes. The cytokine, IL-33, expands and sustains the unique Treg population residing within VAT. Here, relying on single-cell RNA sequencing, we identified the major IL-33 producers in VAT to be particular mesenchymal stromal cell subtypes, related to but distinct from adipocyte progenitor cells. We explored modulation of the VAT stromal-cell landscape with physiologic variables such as age and sex, as well as its remodeling in pathogenic states like obesity. Lastly, we uncovered a VAT Treg:stromal-cell negative regulatory loop that keeps the potent effect of IL-33 under rein.
One sentence summary:
Adipose tissue Tregs dynamically dialogue with stromal cells via the ST2/IL-33 axis in homeostasis and disease.
INTRODUCTION
Innate and adaptive immune-system cells exert important positive or negative influences on the sterile inflammation of visceral adipose tissue (VAT) that shapes organismal metabolism (1, 2). VAT-dwelling anti-inflammatory macrophages (3, 4), Foxp3+CD4+ regulatory T cells (Tregs) (5) and Group 2 innate lymphoid cells (ILC2s) (6) are crucial brakes on local inflammation and metabolic dysfunction. In their absence, VAT takes on a pro-inflammatory tenor, and both local and systemic metabolic indices deteriorate, often culminating in type 2 diabetes. Diabetes and its comorbidities are amongst the 21st century’s most important health challenges.
The Treg and ILC2 populations operating within VAT – as well as those functioning in other non-lymphoid tissues – are highly dependent on the cytokine, interleukin (IL)-33 (6–12). It is generally agreed that the major source of IL-33 in murine VAT is non-hematopoietic in nature, but there has been debate over its precise identity, with different investigators invoking endothelial cells (10) or various phenotypes of fibroblast-like stromal cells (8, 13, 14). As a paradigm of non-hematopoietic cell control of tissular immune/inflammatory responses, we sought to gain a more profound understanding of the VAT IL-33:Treg axis. To that end, we combined multi-parameter flow cytometry, confocal microscopy, genetic ablation, and single-cell RNA sequencing (scRNAseq) to identify and isolate the critical IL-33+ cell-types in murine VAT; assessed their modulation with normal physiologic variation and with pathologic perturbation; and elucidated an IL-33-focused VAT Treg:stromal-cell regulatory loop.
RESULTS
Identification of IL-33+ cells in murine VAT
To inventorize IL-33-expressing cells in VAT, we prepared a stromal/vascular cut from the epididymal (e)VAT depot of 8–10-week-old male C57BL/6 (B6) mice, and distinguished four major cell fractions by flow cytometry: CD45+ hematopoietic cells, CD31+ endothelial cells, PDGFRα−Sca-1− double-negative (DN) cells, and PDGFRα+Sca-1+ VAT mesenchymal stromal cells (VmSCs) (Fig. 1A). IL-33+ cells within these fractions were visualized by staining with antibodies (Abs) against podoplanin (PDPN) and IL-33 (intracellularly) (Fig. 1B). Appropriate gating relied on parallel staining of B6 cells with an isotype-control Ab (Fig 1B, top panels) and of B6.ll33−/− cells with the anti-IL-33 Ab (Fig. 1C). mSCs were by far the major population of IL-33+ cells in VAT: about 20–40% of CD45−CD31−PDGFRα+Sca-1+ cells expressed IL-33 above background, and over 90% of IL-33-producing cells fell within this gate (Fig. 1D). Dominant expression of IL-33 by VmSCs was confirmed using an ll33Egfp reporter mouse (fig. S1). Furthermore, mSCs were the major II-33+ cells in a range of fat depots: omental (om)VAT, inguinal subcutaneous adipose tissue (iSAT) and brown adipose tissue (BAT) (fig. S2).
Fig. 1. PDGFRα+Sca-1+ mSCs are the major source of IL-33 in eVAT.
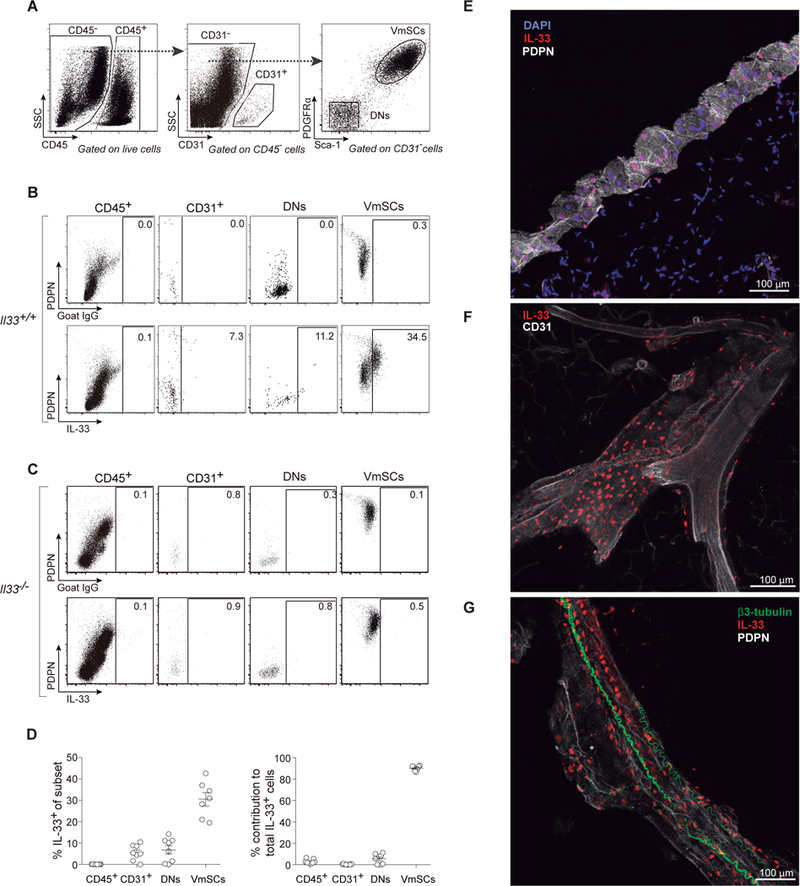
(A-D) Cytofluorimetric identification of IL-33-producing cells within eVAT of 8–10-week-old B6 mice using a polyclonal anti-IL-33 Ab. (A) Gating strategy to delineate cell fractions. (B) Representative dot-plots of control-Ab (top panels) or anti-IL-33 staining (bottom panels) of the cell fractions. (C) As per panel B except whole-body IL-33-deficient (II33−/−) mice were assessed. (D) Frequencies of IL-33+ cells in each cell fraction (left) and its contribution to total IL-33+ cells within the tissue (right). n≥7 from at least three experiments. (E-G) Confocal microscopic images of IL-33+ VmSCs. (E) The eVAT depot is circumferenced by a ring of high PDPN positivity, presumably the mesothelium. (F) IL-33+ cells locate in close proximity to CD31+ endothelial cells. (G) PDPN positivity outlines a large blood vessel surrounded by β3-tubulin+ nerves. Color code for Ab staining as indicated on top of each picture. PDPN, podoplanin; DNs, PDGFRα−Sca-1− cells; VmSCs, PDGFRα+Sca-1+ VAT mesenchymal stromal cells.
Confocal microscopy revealed IL-33-expressing cells at diverse sites in the epididymal fat depot. Many of them localized within a ring of connective tissue at the circumference of the depot, presumably the mesothelium (15) (Fig. 1E). [Note that IL-33 is constitutively expressed in the cell nucleus (16) and so its staining overlaps with that of DAPI.] Other IL-33+ cells were located in the interior of the depot – often, but not always, in close association with blood vessels (CD31 staining, Fig. 1F) and/or neurons (β3-tubulin staining, Fig. 1G).
As the identity of the critical IL-33+ cells in murine VAT has been somewhat contentious, we used conditional knock-out mice to confirm the importance of IL-33 expression by PDGFRα+ cells, i.e. mSCs in this context. A mouse strain carrying a “floxed” ll33 locus was mated with a strain expressing Cre under the dictates of Pdgfra promoter/enhancer elements. 12–16-week-old offspring were assayed as this is the age when the eVAT Treg population begins to expand and thus the proliferation-promoting effects of IL-33 (7, 8) are most likely to be evident. As anticipated, ablation of IL-33 expression specifically in PDGFRα+ eVAT cells had a major impact on whole-tissue ll33 transcript levels (Fig. 2A), while total VmSC numbers remained unperturbed (fig. S3A). Reflecting the dearth of IL-33, there was a partial diminution of the VAT Treg compartment in eVAT, but not iSAT (Fig. 2B). This reduction was quite similar to that provoked by whole-body ablation of the IL-33 receptor, ST2, encoded by ll1rl1 (Fig. 2C). In addition, and with both mutations, there were changes in expression of diagnostic eVAT Treg markers: fewer cells expressing ST2, KLRG1 and GATA3; lower ST2 and KLRG1 mean fluorescence intensities (MFIs) (fig. S3, B–D). There was also a trend towards fewer CD25+ Tregs in eVAT but it did not reach statistical significance (fig. S3E). Also anticipated was that neither the mSC-preferential loss of IL-33 nor the whole-body ablation of ST2 resulted in a difference in body or VAT weight (fig. S3F). Thus PDGFRα+Sca-1+ mSCs were the numerically and functionally important IL-33 expressers in VAT.
Fig. 2. PDGFRα+Sca-1+ mSCs are the biologically relevant IL-33 producers.
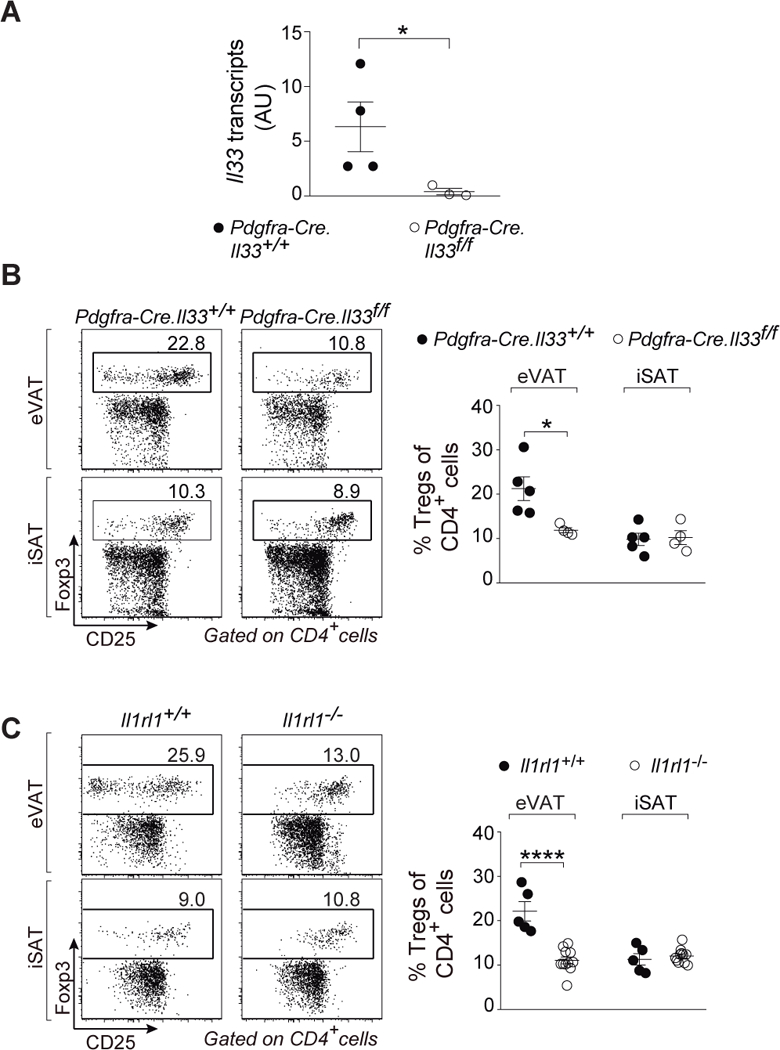
(A) Quantitative PCR on whole eVAT of ll33 transcripts in Pdgfra-Cre.ll33f/f and corresponding wild-type littermates aged 12–16 weeks. (B and C) Fractions of Tregs in Pdgfra-Cre.ll33f/f (B) and ll1rl1−/− mice (C) compared with their matching wild-type controls in eVAT (top panels) and iSAT (bottom panels). n≥3 from at least two independent experiments. Mean ± SEM. p- values: *, <0.05; **, <0.01; ***, <0.001 according to the one-tailed (A) and two-tailed (B and C) unpaired Student’s t-test. AU, arbitrary units. eVAT, epididymal visceral adipose tissue; iSAT, inguinal subcutaneous adipose tissue.
mSC heterogeneity in eVAT
PDGFRα+Sca-1+ populations of mSCs have been found in a number of mouse tissues [reviewed in (17)]. They have variously been termed fibroblast reticular cells, fibro/adipogenic progenitor cells, mesenchymal stromal cells or mesenchymal stem cells. They have been attributed a bewildering array of functions: engendering adipocytes, fibroblasts, myocytes, osteoblasts or chondrocytes; promoting myocyte differentiation from muscle satellite cells; migrating from surrounding adipose tissue to lymph nodes in order to expand reticular networks; inhibiting inflammation and, most recently, nurturing local innate and adaptive immunocyte populations. However, it is not known whether all of these functions are exerted by a single cell-type, nor to what extent there is intra- or inter-tissue heterogeneity within the PDGFRα+Sca-1+ population.
To address these points, we performed scRNAseq on cytofluorimetrically sorted CD45−CD31−PDGFRα+Sca-1+PDPN+ populations from eVAT, skeletal muscle and pooled lymph nodes of 8–10-week-old B6 mice using the InDrops protocol (18). In total, 3720 individual cells were analyzed; on average, 3926 unique mRNA molecules transcribed from 1513 different genes were sequenced per cell. We first displayed the combined data as a t-SNE (t-distributed Stochastic Neighbor Embedding) plot, permitting dimensionality reduction. Substantial intra- and inter-tissue heterogeneity was evident: each tissue hosted 5–7 mSC subtypes, which grouped largely according to tissue source (Fig. 3A). Unsupervised transcript clustering revealed the five VmSC subtypes to have readily distinguishable transcriptomes, with a distinct cluster of over-represented transcripts for each subtype plus three more complex clusters (Fig. 3B, table S1). Unexpectedly, Velocity analysis, which predicts differentiation pathways based on the ratio of spliced to unspliced introns in the totality of mRNAs (19), failed to reveal clear vectors of differentiation between the various VmSC subtypes (Fig. 3C), suggesting that they are likely to be independent entities whose transcriptomes have converged to some degree in response to local cues. As anticipated from the sorting strategy, all five VmSC subtypes expressed Pdgfra and Ly6a (encoding Sca-1) transcripts, though at variable frequencies (Fig. 3D, left panels). VmSCs 1–3 were the primary Il33-expressing subtypes, while Pparg transcripts, characteristic of adipocytes and their immediate precursors, showed a reciprocal pattern of expression (Fig. 3D, middle panels, and E).
Figure 3. mSCs exhibit extensive transcriptional heterogeneity.
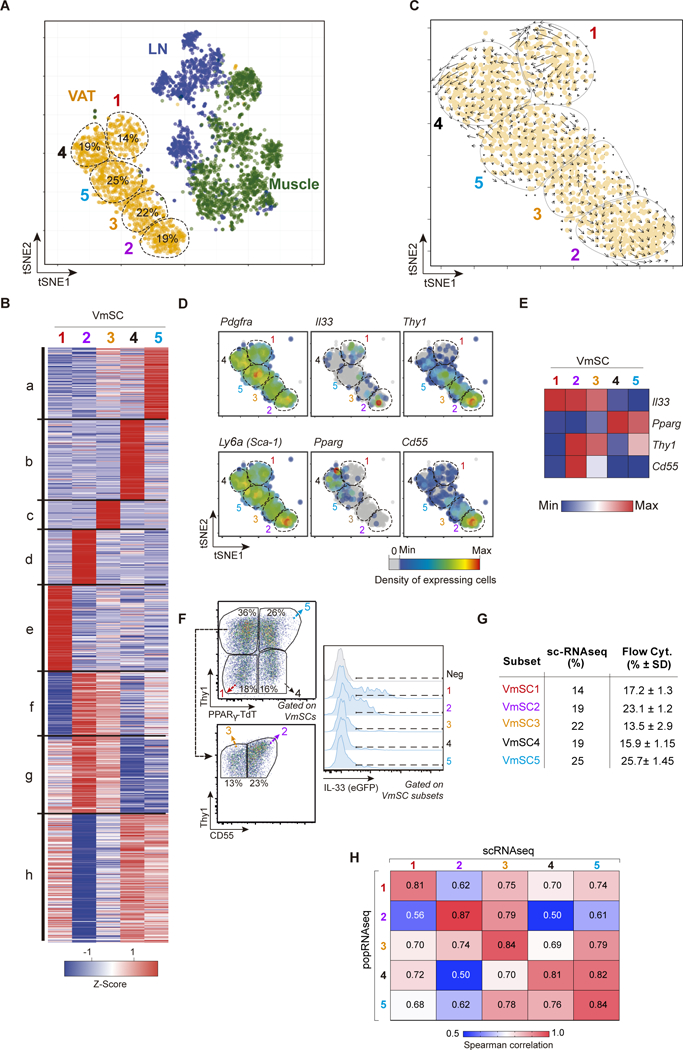
(A) Two-dimensional tSNE plot of scRNA data from VAT (orange), muscle (green) and lymph node (blue) PDGFRα+Sca-1+ mSCs. VmSC subtypes 1–5 were delineated by k- means clustering; their fractional contributions to total VmSCs are indicated. (B) Heat-map showing genes differentially expressed between the VmSC subtypes (FDR < 5%). k-means clustered. (C) VmSCs dynamics (velocity field). The projected next cell state for each single cell is represented by an arrow and projected on the tSNE plot. (D) Same tSNE plot as in panel A overlain with heat-maps of the density of cells expressing various transcript markers. (E) Heat-map of transcript expression within the combined single-cell data of each VmSC subtype. (F-G) Representative dot-plots delineating the VmSC subtypes (left) and indicating their IL-33 expression levels (right) in PpargTdtIl33Egfp double-reporter mice. (G) Comparison of VmSC subtype frequencies obtained by scRNAseq versus flow cytometry. (H) Matrix of Spearman correlation coefficients in head-to-head comparisons of ≥2-fold differentially expressed genes from the scRNAseq and matching population (pop)-level RNAseq datasets. LN, lymph node.
Mining of the transcriptomic data suggested a strategy for cytofluorimetric sorting of the individual VmSC subtypes based on Pparg, ll33, Thy1 and Cd55 transcript levels (Fig. 3D, right panels and E). Combining fluorescent reporters of PPARγ and/or IL-33 expression (described in the online Materials and Methods) with Abs recognizing Thy1 and CD55 did indeed permit isolation of the individual subtypes (Fig. 3F and fig. S4). This was an important advance because it allowed validation of the VmSC subtypes defined via scRNAseq analysis, enabled a deeper phenotypic comparison of these cell populations, and facilitated rapid, cost-effective evaluation of their modulation in diverse physiologic states.
As concerns validation, the relative proportions of the five VmSC subtypes defined according to single-cell transcriptomics and those delineated by cytofluorimetric assessment of marker expression were comfortingly similar, as were their IL-33 expression levels (as long as mice of the same sex, age and husbandry were analyzed) (Fig. 3F and G). In addition, Spearman correlation analysis of the genes differentially expressed ≥2-fold in the five VmSC scRNAseq datasets showed a strong correspondence with population-level RNAseq datasets derived from the analogous cytofluorimetrically sorted VmSC subtypes (Fig. 3H).
Functional features of the VmSC subtypes
The deeper sequencing coverage afforded by population-level analysis of the individual VmSC subtypes uncovered several additional points of interest. First, all five subtypes expressed high levels of transcripts encoding the pan-fibroblast markers collagen1a2, vimentin and collagen3a1 (Fig. 4A). Second, Principal Component Analysis (PCA) showed VmSC2 to be the most divergent of the five populations (Fig. 4B), consistent with the fact that VmSC2 had more genes ≥2-fold up- or down-regulated vis-à-vis the four other subtypes than did VmSCs 1 and 3–5 (>1100 vs <900). Third, Gene-Set Enrichment Analysis (GSEA) revealed an over-representation of the “epithelial-mesenchymal transition” pathway, a hallmark of tissue remodeling and fibrosis, in VmSCs 1 and 2; while VmSCs 4 and 5 showed enrichment for the “adipogenesis” pathway (Fig. 4C, table S2). Fourth, analysis of cardinal marker transcripts (20) indicated that VmSC subtype 1 had a clear mesothelial component (Fig. 4D, top, and table S3), and was thus likely to encompass the population of IL-33+ cells at the circumference of the epididymal fat pad (Fig. 1E). Consistent with the GSEA analysis, VmSC2 was enriched for transcripts encoding markers of proliferation (Fig. 4D, upper middle), perhaps driving its strong divergence from the other 4 subtypes. VmSCs 4 and 5 exhibited the pattern of cardinal transcript over- (Pdgfrb, Notch3, Mcam) and under- (Cd34 and Ncam1) expression expected of pericytes or mural cells (20) (Fig. 4D, lower middle, and table S3). (Note that subtypes 1 and 3 also showed pericyte signatures, but more weakly, likely corresponding to the vascular IL-33+ cells depicted in Fig 1F.) VmSCs 4 and 5 exhibited the strongest expression of diagnostic adipocyte transcripts as well, VmSC4 seeming to be the more mature of the two cell-types (Fig. 4D, bottom, and table S3).
Figure 4. mSCs subtypes exhibit different functional properties.
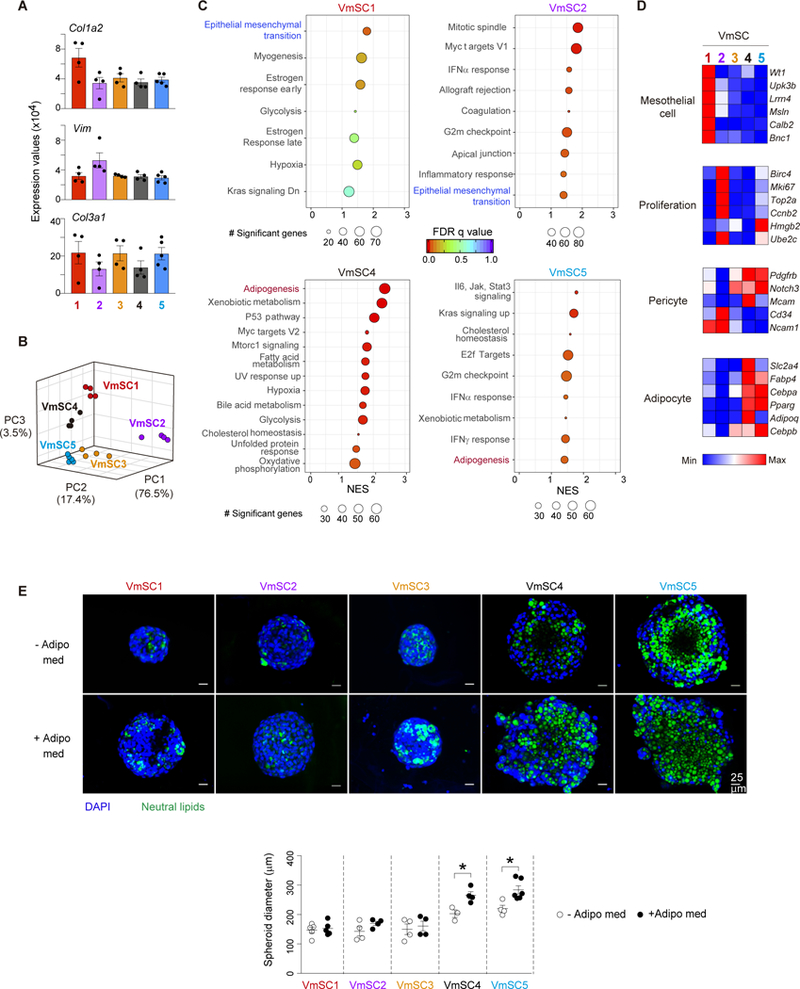
(A) Gene expression of pan-fibroblast genes across VmSC populations. (B) Three- dimensional PCA plot depicting the VmSC subsets. (C) GSEA-derived hallmarks for individual VmSC subtypes compared to the rest. Size of the circles denotes number of genes significantly enriched in each individual pathway, rainbow color code indicates FDR values, and NES is depicted on the x-axis of the plot. (D) Expression heat-maps for transcripts considered cardinal for the indicated cell-types. All should be over- expressed, except Cd34 and Ncam1 which were under-expressed in pericytes. Precise expression values appear in table S3. (E) Representative images of three-dimensional in vitro cultured VmSCs in the absence (−) or the presence (+) of an adipogenic medium (Adipo med) (top). Quantification of the spheroid diameter (bottom). All data from 8-10-week-old males, of B6 genotype unless indicated otherwise. GSEA, Gene set enrichment analysis. FDR, False discovery rate. NES, Normalized enrichment score. GSEA pathways were filtered based on a p-nominal value < 0.05. Other abbreviations as per Fig 1.
Hence, VmSC subtypes 4 and 5 had phenotypes highly reminiscent of a recently identified mural-cell adipocyte precursor residing in murine VAT (21), concordant with results from a three-dimensional in vitro assay of their adipogenic potential. Sorted VmSC 4 and 5 populations, but not the IL-33+ VmSC subtypes, robustly responded to culture in adipogenic medium by enlarging and accumulating neutral lipids in the cytoplasm; actually, these characteristics were already evident, if muted, without adipogenic stimuli (Fig. 4E). Notably, VmSCs 4 and 5 (as well as the other VmSC subtypes) did not express high levels of most adipokines at steady-state (fig. S5A), expected of their immature state. Lastly, the differential expression of extracellular matrix proteins (fig. S5B and table S4) and soluble mediators (fig. S5C and table S4) reinforced the notion of VmSC subtype heterogeneity. Note, for example, the particularly low expression of genes encoding extracellular matrix proteins by VmSC2.
So the picture that emerged was one of heterogeneous functional potential: of an Il33-producing subtype (1) that had a mesothelial component; another IL-33-producing subtype (2) that was proliferating; two Pparg-expressing subtypes (4 and 5) that could engender adipocytes; and a subtype (3) that was difficult to pigeon-hole.
VmSC subtype evolvement with physiologic variation: Treg:VmSC 1–3 correlations
Next, we exploited the marker panel to assess modulation of the five VmSC subtypes with normal physiologic variation. Concordant with previous reports (5, 8, 22), there were significant increases in the fraction and number of eVAT Tregs as male B6 mice matured from 6 to 32 weeks of age, particularly for the “true” eVAT-phenotype subpopulation expressing elevated levels of ST2 and GATA3 (8) (fig. S6A), paralleling rises in body and fat-pad weights (fig. S6B). There was also an enrichment in total (Fig. 5A) and IL-33+ (Fig. 5B) VmSCs as the mice aged, especially in numbers of VmSCs 1–3 numbers (Fig. 5C and D).
Fig. 5. Age strongly influences immunocyte-promoting VmSCs and thereby Treg accumulation.
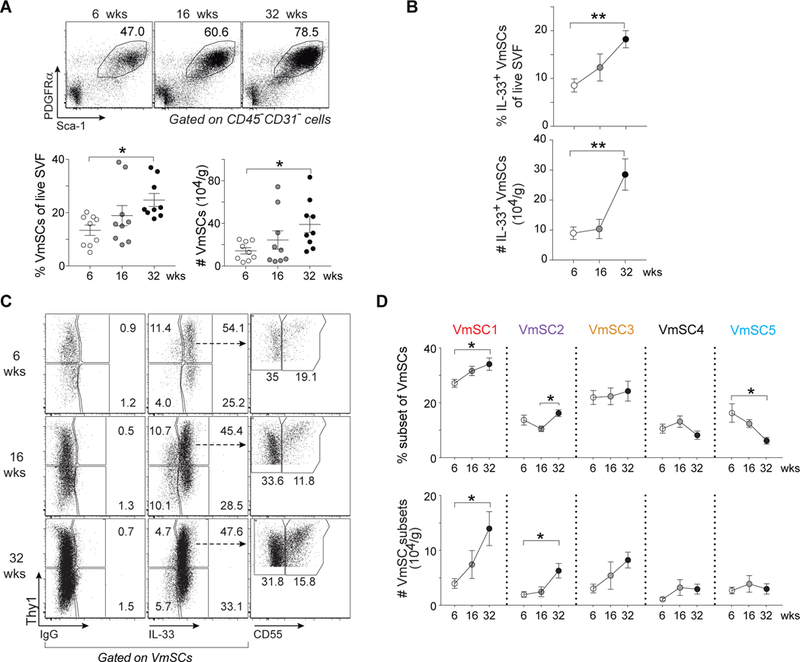
(A) Representative plots (top), frequencies and numbers (bottom) of total VmSCs from mice of different ages. (B) Frequencies (top) and numbers (bottom) of total IL-33+ VmSCs. (C and D) Cytofluorometric dot-plots of VmSC subtypes (C) and corresponding fractions (top) and numbers (bottom) (D) from lean B6 males of the indicated ages. Pooled data from three independent experiments. Numbers of cells were normalized per tissue weight. One-way ANOVA analysis was performed to compare three or more groups. For all relevant plots, mean ± SEM. p-values: *, ≤0.05; **, ≤0.01; ***, ≤0.001; ****, ≤0.0001. SVF, stromal vascular fraction. Other abbreviations as per Fig 1.
Intriguingly, female gonadal (g)VAT, i.e. ovarian (o)VAT, does not show the enrichment in Tregs typical of eVAT in males (9). The root of this divergence remains entirely unknown. Whether mice were 18–20 (fig. S7A) or 8–10 (fig. S7B) weeks old, we were able to recapitulate this difference, and to add that it applied to “true” gVAT Tregs enriched in cells expressing high levels of ST2 and GATA3. In contrast, there were no significant differences in Treg fractions or numbers in male and female iSAT depots (fig. S7, A and B). As in eVAT, the vast majority of IL-33-expressing cells in oVAT were PDGFRα+Sca-1+ mSCs (fig. S8A), as was also the case in female omVAT, iSAT and BAT depots (fig. S8B). Of note, oVAT in all females examined contained two cell populations with phenotypes hardly observed in eVAT: PDGFRα+Sca-1− and PDGFRα−Sca-1+ cells; however, these cells expressed few or no ll33 transcripts (fig. S8A and B). At both ages, but especially in older individuals, there were more IL-33+ mSCs in the male than female gVAT depot (Fig. 6A and fig. S8C). There was also a very different stromal landscape in the two sexes: more VmSCs1, 3 and 4 in males, coupled with many fewer VmSC5s (Fig. 6B and fig. S8D). To determine whether the reduction in gVAT Tregs in female mice might reflect limiting IL-33 levels, we injected 8–10-week-old females twice with IL-33, and examined Treg levels and phenotype 6 days after the initial injection. There was a strong increase in the fraction and number of Tregs in oVAT in response to IL-33 injection (fig. S8E), attaining levels at least as high as those observed for eVAT at steady-state (fig. S7A). The increase was also true of ST2+, KLRG1+ and GATA3+ Tregs, in particular (fig. S8F).
Fig. 6. Gender determines drastically distinct VmSC subtype distribution and VAT Treg abundance.
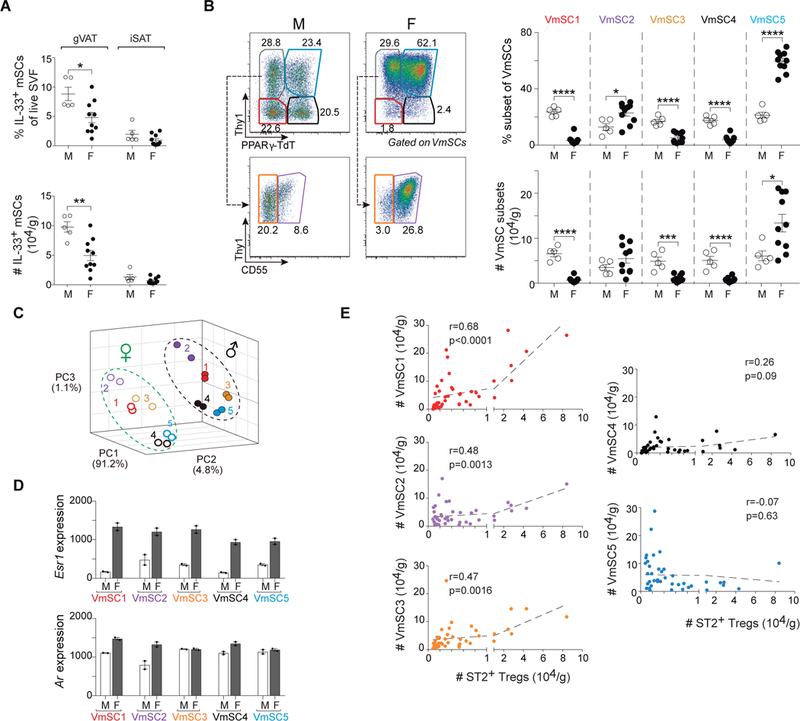
(A) Frequencies (top) and numbers (bottom) of total IL-33+ VmSCs. (B) Cytofluorimetric dot-plots (left) and corresponding quantification of subtypes thereof (right) in gonadal (g)VAT and iSAT of lean male (M) and female (F) mice aged 18–20 weeks old. Pooled data from at least two independent experiments. (C) Three-dimensional PCA plot of the transcriptomes (population-level RNAseq) from coincidently prepared male and female VmSC subtypes from B6 mice 8–10 weeks old. (D) Esr1 (top) and Ar (bottom) transcripts levels for the individual VmSC subtypes from male (white bars) and female (black bars) mice aged 8–10 weeks old. Each dot represents an individual biological replicate from two or more pooled mice. (E) Correlation curves for numbers of IL-33+ VmSCs versus ST2+ Treg numbers in gVAT using meta-data from all male mice of various ages (6, 16, 18–20 and 32 weeks) and female mice 18–20 weeks old, i.e. all mice of normal physiologic state. In all cases, numbers of cells were normalized to tissue weight. r and p from Pearson’s correlation coefficient. All other statistics and abbreviations as per Fig. 1 and 5.
While the dearth of IL-33+ mSCs in female gVAT might well explain the defect in local Treg accumulation, we performed head-to-head comparative transcriptomics for additional insights. PCA analysis revealed similar intra-sex clustering patterns for the five VmSC subtypes; however, for each subtype, the male and female transcriptomes clustered apart, largely along a single axis, PC2 (Fig. 6C). Pairwise comparisons highlighted the “Fatty Acid Metabolism” pathway in all cases and early and/or late “Estrogen Response” pathways in all but the VmSC2 subtype (table S5). Indeed, Esr1 transcripts, encoding the estrogen receptor, were much more highly expressed in all female than male VmSC subtypes (Fig. 6D). Such a gender difference in Esr1 transcription was not a forgone conclusion – for example, it is not seen with a diversity of immunocyte populations (www.immgen.org). Ar transcripts, encoding the androgen receptor, were also increased in the VmSC 1 and 2 populations of females (Fig. 6D).
Meta-analysis of the aging and gender results, i.e. all of the data from normal physiologic states, revealed highly significant correlations between numbers of ST2+ Tregs and VmSC numbers for each of the IL-33-expressing subtypes, above all for VmSC1 (Fig. 6E). In contrast, there was no correlation with VmSCs 4 and 5 numbers. This observation reinforces the notion of divergent VmSC subtypes primarily dedicated to promoting immunocytes versus generating adipocytes.
VmSC subtype evolvement with pathogenic perturbation: IL-33-mediated Treg:VmSC crosstalk
To determine whether and how VAT stroma is remodeled under pathogenic conditions, i.e. obesity, we exposed 14-week-old B6 male mice to a high-fat diet (HFD) for 4 (short-term) or 16 (long-term) weeks. As anticipated (5), the metabolic abnormalities induced by long-term HFD feeding (fig. S9, A and B) were accompanied by a striking reduction in the VAT Treg compartment, and the few remaining cells had a less VAT-like (i.e. less ST2+) phenotype (fig. S9C). Total and IL-33-expressing VmSCs were reduced shortly after introduction of the HFD, but by 16 weeks they had bounced back to supra-physiologic levels (Fig. 7A and fig. S9D). There was also major remodeling of the VmSC subtype landscape with prolonged HFD feeding, most notably an enrichment in the numbers of all three IL-33+ subtypes (fig. S9E and Fig. 7B). Transcriptome analysis indicated that this grouping is probably equivalent to the pro-fibrotic PDGFRα+CD9+ subset of mouse and human VAT stromal cells recently reported to expand with obesity (23) (table S1, cluster g).
Fig. 7. An IL-33-focused VAT-Treg:VmSC regulatory loop is uncovered in obese mice.
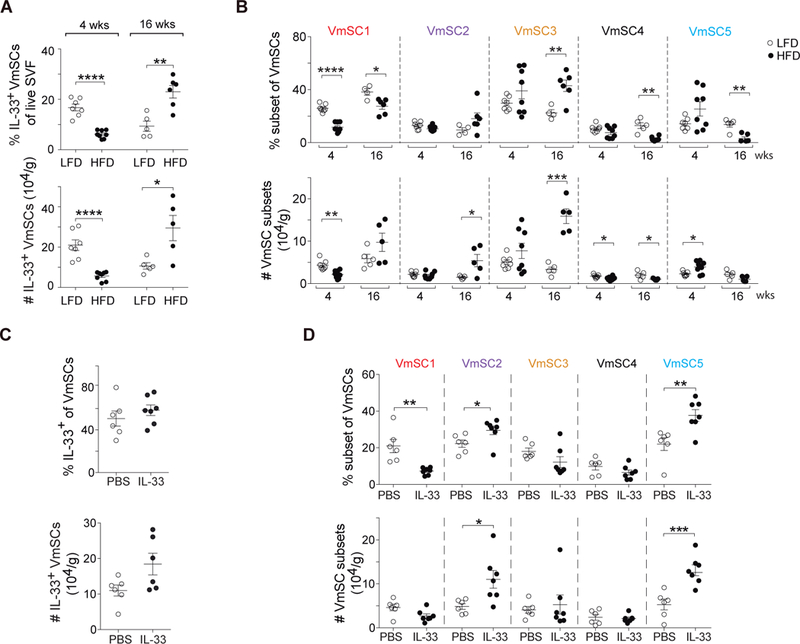
(A and B) Fractions (top) and numbers (bottom) of total IL-33+ VmSCs (A) and VmSC subtypes (B) subsequent to 4 or 16 weeks of high-fat feeding of 14-week-old B6 males. Data from at least two independent experiments. (C and D). Effects of IL-33 administration to 8–12-week-old B6 males. Frequency (top) and numbers (bottom) of total IL-33+ VmSCs (C) or of individual VmSC subtypes (D). Data shown corresponds to at least two pooled independent experiments. Numbers of cells were tissue weight-normalized in all cases. LFD, low-fat diet; HFD, high-fat diet; PBS, phosphate-buffered saline. All other statistics and abbreviations as per Figs. 1 and 5.
Thus, the positive correlation between VAT Treg numbers and IL-33+ VmSC subtype numbers broke down in HFD-induced obesity. An explanation for this observation might be that VAT Tregs normally keep IL-33-expressing stromal cells in check, in a negative feedback loop. HFD-induced defects in the size or phenotype of the VAT Treg compartment, as have been documented (5, 7, 22, 24), might thereby unleash VmSCs 1–3. To test the possibility of IL-33 participation in such a VAT-Treg:VmSC regulatory loop, we twice injected this cytokine, three days apart, into 10-week-old B6 males, and analyzed them six days after the initial injection. There was no significant increase in the fraction or number of total VmSCs expressing IL-33 in response to this acute treatment (Fig. 7C), but there was substantial remodeling of the subtype landscape, in particular a large relative decrease in the VmSC1 compartment with a concomitant strong increase in VmSC5 (Fig. 7D).
Since the mSCs in VAT do not express ll1rl1 transcripts, encoding ST2, at levels significantly above background (≤4), we surmised that the alterations in VmSC subtype distribution were due to indirect effects via another cell-type. Tregs and ILC2s express the highest levels of ST2 in VAT and, indeed, injection of IL-33 expanded both of these lymphocyte subsets in this context (Fig. 8, A and B). Given the ready availability of more specific reagents, in particular knockout mice, we focused on the contribution of Tregs (but do not rule out additional participation by ILC2s). Frequent proximity (≤50 μm) between Tregs and IL-33+ stromal cells was demonstrated by confocal microscopy of eVAT from mice with an enriched VAT Treg compartment (9) for ease of visualization (Fig. 8C). More importantly, injection of IL-33 into mice lacking ST2 specifically on Tregs, in comparison with parallel injections into wild-type littermates, showed muted expansion of the VAT-Treg population, in particular the “true” VAT-phenotype KLRG1+ component (8) (Fig. 8D); actually enhanced expansion of the ILC2 compartment (Fig. 8E); and allowed a greater increase in total IL-33+ VmSCs (Fig. 8F), especially in subtypes 2 and 3 (fig. S10). Taken together, then, the data on obese mice and IL-33-injected wild-type and ST2-deficient mice point to a control loop wherein VAT ST2+ Tregs, expanded and sustained by IL-33 in normal physiologic states, negatively regulate IL-33-expressing VmSCs; this loop breaks down in the obese state, with its compromised VAT Treg compartment (Fig. 8G).
Fig. 8. Specific ST2 expression on VAT Tregs is involved in their interaction with VmSC subtypes.
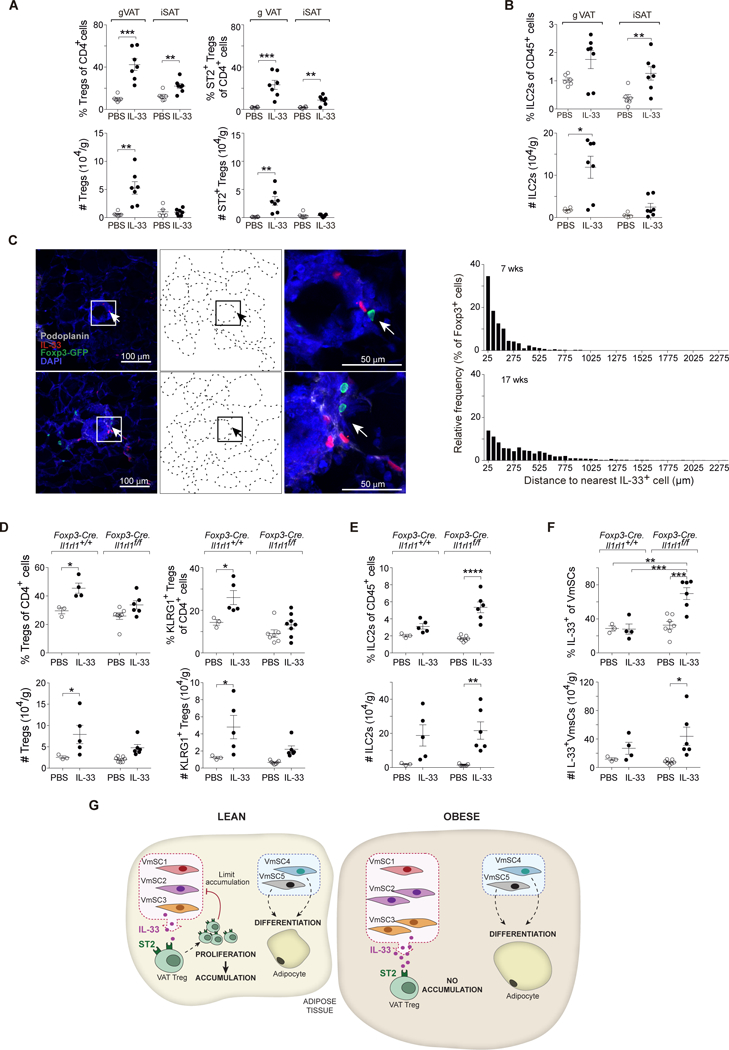
(A and B) IL-33 was administered to wild-type B6 males aged 8–12 weeks. Frequencies (top) and numbers (bottom) of total (left) and ST2+ (right) Tregs (A) or ILC2s (B). (C) Confocal images (group of left panels) showing Tregs and IL-33-expressing cells within eVAT at low-magnification (left), corresponding delineation of adipocyte edges based on autofluorescence of DAPI channel (middle) and high-magnification of the squared indicated area (right). Distance quantification between Foxp3+ Tregs and the nearest IL-33- expressing cell (group of right panels) from whole eVAT tissue sections taken from male VAT-Treg TCR- transgenic mice at 7 (top) and 17 (bottom) weeks of age. Arrows in panel C depict Treg:IL-33+ cell proximity. Color code for Ab staining as indicated within the picture. (D, E and F) IL- 33 was injected into mice lacking ST2 expression specifically by Tregs vs wild-type littermate controls. Frequencies (top) and numbers (bottom) corresponding to total and KLRG1+ Tregs (D), ILC2s (E) and IL-33+ VmSCs (F). All numbers were calculated relative to total tissue weight. (G) Graphic scheme of the proposed VmSC:Treg negative regulatory loop model. All other abbreviations and statistics as per Figs. 1, 5 and 7.
DISCUSSION
Our results highlight mSCs as key orchestrators of metabolic:immunologic cross-talk in adipose tissue. This stromal compartment turns out to be very heterogeneous, both within and between tissues. In healthy individuals, dedicated VAT mSC subtypes coordinately balance immunocyte numbers through secretion of IL-33 (VmSCs 1–3) and adipocyte numbers/activities through regulation of adipocyte precursors (VmSCs 4 and 5). Remodeling of the VmSC landscape associated with disease states such as obesity [and probably infection (25)] destroys this harmony, resulting in metabolic and/or immunologic aberrancies. For example, Tregs are unable to accumulate in VAT of obese mice (5), likely reflecting modulation of PPARγ activity (22, 24), and thus cannot rein in accumulation of and IL-33 production by VmSCs 1–3 as they do in lean mice. An increase in IL-33 production upon HFD feeding in consistent with the observation that the pro-inflammatory cytokines IL-17 and TNF-α synergize to induce IL-33 expression by VAT stromal cells (14).
We have attempted to integrate the VmSC subtypes delineated herein with adipose-tissue stromal cell populations recently defined on the basis of other scRNA-seq analyses. Schwalie et al (26) exclusively studied iSAT rather than the eVAT depots we focused on. The “regulatory” subset they highlighted most closely resembles our VmSC3 subtype on the basis of marker transcript expression [e.g. F3 (CD142) and Abcg1], low transcription of adipogenic genes (e.g. Pparg), and the inability to give rise to adipocytes in culture. However, it is dangerous to extrapolate between depots in this manner, as was also pointed out in the study of Burl et al (27). Our total VmSC constellation appears to correspond to what these latter authors termed “Adipocyte Stem Cells,” defined by the expression of PDGFRα. They also found heterogeneity within this grouping but did not split it into its immunocyte-promoting and adipocyte-generating steady-state components, instead concentrating on adipocyte beiging.
Also notable is the identification of mesothelial stromal cells as IL-33 expressers. Mesothelial cells form a cobblestone monolayer surrounding organs in the peritoneal, pleural and pericardial cavities, constituting a protective layer against physical damage (28). Hence, these cells would be well placed to exert IL-33’s well-established alarmin function (29). In the VAT context, one can imagine a rheostat role wherein normal expansion of the fat pad (as happens with aging, for example) would induce expression of IL-33, a mechanosensitive cytokine (30), in turn prompting an increase in the VAT Treg and ILC2 populations, and thereby keeping local inflammation in check. Interestingly, SAT is not surrounded by a layer of mesothelium (15), perhaps explaining the relatively paltry IL-33 and Treg levels in these depots (9). Whether mesothelium surrounding other organs produces IL-33 to promote adaptive (Tregs) or innate (ILC2s) immune-system surveillance of tissue homeostasis remains to be determined, but analogies in lung stromal cell compartments (20) suggest so.
An obvious question is how these observations relate to human adipose tissue. There are Foxp3-expressing cells in human omVAT, fewer in obese than lean individuals (5). Tregs in human VAT, but not blood, express ST2 (7). And human omVAT has a stromal cell population very similar to the PDGFRα+ IL-33-producing compartment in mice (13, 23). Thus, it is likely that our observations will prove true, to at least some degree, in humans as well.
MATERIALS AND METHODS
Study design
The aims of this study were to identify and further characterize the cellular sources of IL-33 within VAT and to determine how these cells correlate with local Tregs in diverse physiologic and pathologic states. We performed flow cytometric and confocal imaging experiments to detect IL-33-producing cells, followed by extensive transcriptional profiling at the single-cell population levels, in addition to functional characterization. We studied the abundance and phenotype of IL-33+ subpopulations and Tregs in lean mice of different ages and sexes as well as in obesity.
Mice
C57BL/6 (B6) and C57BL/6-Tg(Pdgfra-Cre)1Clc/J (Pdgfra-Cre) (31) mice were obtained from the Jackson Laboratory. ll1rl1−/− (32) ll33flox (33) mice were generously donated by Dr R. Lee (Brigham and Women’s Hospital); B6(129S4)-ll33tm1.1Bryc/J (ll33Egfp) mice by Dr P. Bryce (Northwestern U.) [now commercially available at Jackson (stock number 30619)]; Foxp3-IRES-Gfp (34), ll33−/− and ll1rl1flox mice by Dr V. Kuchroo (Brigham and Women’s Hospital); and Foxp3-CreYFP mice (35) by Dr A. Rudensky (Memorial Sloan Kettering Cancer Center). The VAT Treg TCR-transgenic (vTreg53) and PpargTdt lines were recently described (9). Mice lacking ST2 specifically in Tregs were generated by crossing the ll1rl1flox and Foxp3-CreYFP lines; double-reporter PpargTdt/ll33Egfp mice by crossing the PpargTdt and ll33Egfp lines; and mice lacking IL-33 in mSCs by mating the ll33flox and Pdgfra-Cre lines. In all cases, mouse lines have been backcrossed to the B6 genetic background for at least eight generations, and experiments were conducted with littermate controls. All animals were housed at the specific-pathogen-free facilities at Harvard Medical School (HMS). Experiments were performed under protocols approved by HMS’s Institutional Animal Care and Use Committee (protocol #IS00001257). Except where otherwise noted, mice were fed a low-fat diet (no. 5053, Picolab Rodent Diet 20; 13% kcal fat per gram).
Preparation and flow cytometry of adipose-tissue samples
Mice were sacrificed using CO2, eVAT, oVAT, omVAT, iSAT and BAT were removed, placed into Dulbelcco’s Modified Eagle’s Medium (DMEM) containing 2% fetal bovine serum (FBS), minced to mechanically disaggregate the tissue, and incubated with 1.5 mg/ml Collagenase type II (Sigma) at 37°C for 20 minutes with constant shaking in a water bath. Single-cell suspensions were washed with DMEM + 2% FBS, filtered through a 70 μm cell strainer, and further washed.
For flow cytometry involving surface staining only, cell preparations were subjected to red blood cell lysis by incubating with 0.5–1 ml ACK Buffer (Lonza) for 1 minute on ice, washed, and finally re-suspendend in DMEM + 2% FBS for surface cytofluorimetric analysis. Staining with Abs recognizing CD45 (#103125), CD31 (#102406), Sca-1 (#108124), PDGFRα (#135908) and PDPN (#127412) (all from BioLegend) was done for ~20 minutes at 4°C, followed by LIVE/DEAD Fixable Near-Infrared (IR) viability dye (Thermo Fisher) incubation for 10 minutes at room temperature (RT). Following standard surface staining, intracellular IL-33 was detected by fixation and permeabilization using True-Nuclear Transcription Factor Buffer Set (BioLegend) as per the manufacturer’s instructions, followed by incubation with a goat anti-IL-33 polyclonal primary Ab (R&D Systems; #AF326) and a donkey anti-goat Cy3 secondary Ab (Jackson Immunoresearch Laboratories; #705–166-147). To delineate mSC subsets, we used anti-CD55 (LSBio, #C62832) and anti-Thy1 (BioLegend, #105326) Abs, while for Tregs and ILC2s, we employed a set of Abs directed against CD45 (BioLegend #103126), CD4 (BioLegend, #100540), CD8 (BioLegend, #100706), ST2 (eBioscience, #25–9335-82), KRLG1 (Invitrogen, #61–5893-82) and CD25 (BioLegend, #102025), in addition to viability stain with LIVE/DEAD Fixable Yellow dye (Thermo Fisher). For staining of Foxp3, cell suspensions were fixed in eBioscience Fix/Perm buffer for 30 minutes at RT, followed by permeabilization in eBioscience permeabilization buffer and overnight incubation at 4° with anti-Foxp3 (eBioscience, #17–5773-82) and GATA3 (eBioscience, #12–9966-42). ILC2s were defined as CD45+CD4−CD8−GATA3+ST2+/KLRG1+ cells.
Confocal imaging of IL-33+ cells
eVAT samples were fixed in 4% paraformaldehyde (PFA) (Electron Microscopy Sciences, PFA 16% solution, EM grade) for 24 hours, then treated with 30% sucrose solution for an additional 24 hours. Samples were then preserved in O.C.T (Tissue-Tek) and stored at −80°C until cutting 100 μm sections with a cryostat. For tissue staining, samples were blocked with 2% bovine serum albumin (BSA) + 2% donkey serum + 0.5% triton X-100 in phosphate-buffered saline (PBS) solution (immunofluorescence staining buffer) for 30 minutes, stained with primary Abs for 1 hour, and incubated in the presence of a secondary Ab for 30 minutes at RT. After each primary or secondary Ab staining, slides were washed 3 times for 5 minutes in PBS. Finally, slides were mounted with Vectashield mounting medium (Vector Laboratories) or ProLong Diamond Antifade Mountant (Thermofisher). Primary Abs were goat anti-mouse IL-33 (R&D Systems, #AF3526, 1:50 dilution), APC-conjugated Syrian Hamster anti-mouse PDPN (Biolegend, #AF3526, 1:100), or rabbit anti-GFP (Abcam, 1:1000), rabbit anti-β3-tubulin (Cell Signalling, #D6584, 1:50) and rat anti-mouse CD31 (BioLegend, #102512, 1:50). Secondary Abs were Cy3 donkey anti-goat IgG (Jackson ImmunoResearch Laboratories, #705–166-147, 1:200), Alexa Fluor 488 donkey anti-rabbit IgG (Biolegend, #406416, 1:200) or donkey anti-rat IgG (Jackson ImmunoResearch Laboratories, #712–175-153). For β3 tubulin staining, eVAT from B6 retired breeder mice was used. Images were acquired on an Olympus FV1000 confocal microscope, and were representative of at least three independent experiments.
PCR quantification
RNA was isolated from a <100 mg fragment of whole eVAT from the distal region using RNeasy Lipid Tissue Mini Kit (Qiagen) and reverse-transcribed using SuperScript Polymerase 2 (Invitrogen) according to the manufacturer’s instructions. Real-time quantitative PCR was performed using gene-specific fluorogenic assays (TaqMan; Applied Biosystems). Total Il33 transcript values were normalized to those from the mouse Hprt gene.
Three-dimensional spheroid in vitro culture of individually isolated VmSC subsets
eVAT from at least two mice was pooled, dispersed and double-sorted using a Moflo Astrios cell sorter based on the VmSC markers mentioned above. 2–2.5×10³ cells were collected into a single well from a 384-well Ultra-Low Attachment Surface plate (Corning) containing 80 μl DMEM/F12 Glutamax (Gibco), 10% FBS, penicillin-streptomycin and Primocin. Cells were then spun down by centrifugation at 500 g for 1 minute and incubated in 5% CO2 at 37°C. After three days, culture medium was carefully aspirated and the cells exposed to either DMEM/F12 Glutamax + 10% FBS and penicillin-streptomycin (maintenance medium) or maintenance medium containing insulin from bovine pancreas (Sigma), 3-isobutyl-1methylxatine (IBMX) (Sigma), dexamethasone and rosiglitazone (Cayman Chemical Company) for an additional three days. Cells were washed with PBS, fixed using 4% PFA for 10 minutes and stained with HCS LipidTox Green (ThermoFisher), which has affinity for neutral lipids, for 30 minutes at RT. Cells were left in VectaShield Mounting Medium with DAPI at 4°C until acquisition. Spheroids were visualized and imaged using an Olympus FV1000 confocal microscope. Serial pictures covering the spheroids separated by 4 μm from one another, were taken, which were integrated into a single image using the Z-project function from ImageJ/Fiji software. Spheroid diameter was measured by tracing a line that covered the largest diameter.
Mouse manipulations
For the IL-33 administration experiments, 8-12-week-old B6, Foxp3-Cre.ll1rl1+/+ or Foxp3-Cre.ll1rl1fl/fl male mice were intraperitoneally (ip) injected either with PBS or recombinant mouse IL-33 (BioLegend) at 2 μg/dose on days 0 and 3 and were analyzed on day 6. At 14-wks of age, male B6 mice fed a low-fat diet containing 13% kcal fat per gram (no. 5053, Picolab Rodent Diet 20) were either continued on this regimen (LFD group) or were fed a high-fat diet composed of 60% kcal fat per gram (Open Source Diet-D12492, irradiated) (HFD group) for 4 and 16 weeks. These mice underwent metabolic studies beginning at approximately 8 days before the end of the experiment, when a glucose tolerance test (GTT) was performed. Animals were fasted for an overnight period, weighed, and then evaluated for blood glucose concentrations at 0, 20, 40, 60, 90 and 120 minutes after 1.0 or 2.0 g per kg body weight ip glucose administration, for short- or long-term experiments, respectively. The insulin tolerance test (ITT) was performed ~5 days after the GTT – in this case, mice were fasted for 4 hours and injected ip with 0.75U or 1.12U per kg body weight insulin (Humulin R, Lilly) for short- or long-term experiments, respectively. Glucose concentrations were determined at 0, 20, 40, 60, 90 and 120 minutes afterwards. For both GTTs and ITTs, the area under the curve (AUC) was calculated using GraphPad Prism 7.0.
Quantification of Treg:IL-33+-cell distances
eVAT from 7- or 17-week-old male VAT-Treg TCR- transgenic mice expressing the Foxp3-GFP reporter (9) were stained as described above and imaged on an Olympus FV3000 confocal microscope using the 20X objective. Z-stack images of individual 20X fields were stitched together using Fluoview software (Olympus) to generate images of whole eVAT sections, and were projected to obtain a two-dimensional image for quantification. For determination of the distance between IL-33+ cells and Tregs, individual cells were identified using the Analyze Particle function in ImageJ/FIJI and manually verified. The coordinates of IL33+ cells and Tregs (anti-GFP Ab staining) were obtained using the measurement function in Fiji, and the distances between these cells were calculated using a Euclidean distance formula. Quantifications were derived from 14 and 7 adipose-tissue sections from mice aged 7–17 weeks, respectively.
Statistical analyses
Data were routinely shown as mean ± SEM. Unless stated otherwise, statistical significance was determined by the Student’s t-test or ANOVA using GraphPad Prism 7.0. p=*, <0.05; **, <0.01; ***, <0.001; ****, <0.0001. A value of more than 3 standard deviations from the mean was adopted as criteria to exclude outliers.
Supplementary Material
ACKNOWLEDGMENTS
We thank Drs V. Kuchroo, R. Lee, A. Rudensky and A. McKenzie for providing mice; A. Ortiz-Lopez, K. Hattori, N. Asinovski, A. Rhoads, K. Seddu, A. Cook, G. Buruzula. C. Araneo, A. Wood and F. Lopez for experimental assistance; and Dr B. Spiegelman for discussions. Cell sorting was performed at the HSCI/DRC Flow Core of the Joslin Diabetes Center (NIH P30 DK036836), and InDrops was done at the HMS Single Cell Core. Paul Bryce generated the IL-33 conditional reporter mouse line while an employee at Northwestern University but is currently an employee of Sanofi US, which was not involved in this study.
Funding: This work was supported by NIH grants DK092451, RC2DK116691 and AR080334 and by a grant from the JPB Foundation to D.M. R.G.S is an American Diabetes Association Postdoctoral fellow (1–17-PMF-005). D.Z. was supported by a fellowship from the Boehringer Ingelheim Fonds, T.J. by NIH Training Grant T32GM007753, and C.L by a Cancer Research Institute Irvington fellowship.
Footnotes
Competing interests: The authors declare no competing interests.
Data and Materials Availability: Single cell-RNA sequencing (seq) datasets from visceral adipose tissue, muscle and LN mesenchymal stromal cells along with population-level RNAseq of individual VmSC subsets from both male and female mice aged 8–10 weeks old were deposited in Gene Expression Omnibus (GEO) under accession numbers GSE127005 and GSE126891, respectively. All other data needed to evaluate the conclusions in the paper are present in the paper or the Supplementary Material.
REFERENCES AND NOTES
- 1.Hotamisligil GS, Foundations of immunometabolism and Implications for metabolic health and disease. Immunity. 47, 406 (2017). [DOI] [PMC free article] [PubMed] [Google Scholar]
- 2.Lee YS, Wollam J, Olefsky JM, An integrated view of immunometabolism. Cell. 172, 22 (2018). [DOI] [PMC free article] [PubMed] [Google Scholar]
- 3.Weisberg SP, McCann D, Desai M, Rosenbaum M, Leibel RL, Ferrante AW Jr., Obesity is associated with macrophage accumulation in adipose tissue. J Clin Invest. 112, 1796 (2003). [DOI] [PMC free article] [PubMed] [Google Scholar]
- 4.Xu H, Barnes GT, Yang Q, Tan G, Yang D, Chou CJ, Sole J, Nichols A, Ross JS, Tartaglia LA, Chen H, Chronic inflammation in fat plays a crucial role in the development of obesity-related insulin resistance. J Clin Invest. 112, 1821 (2003). [DOI] [PMC free article] [PubMed] [Google Scholar]
- 5.Feuerer M, Herrero L, Cipolletta D, Naaz A, Wong J, Nayer A, Lee J, Goldfine AB, Benoist C, Shoelson S, Mathis D, Lean, but not obese, fat is enriched for a unique population of regulatory T cells that affect metabolic parameters. Nat Med. 15, 930 (2009). [DOI] [PMC free article] [PubMed] [Google Scholar]
- 6.Molofsky AB, Nussbaum JC, Liang HE, Van Dyken SJ, Cheng LE, Mohapatra A, Chawla A, Locksley RM, Innate lymphoid type 2 cells sustain visceral adipose tissue eosinophils and alternatively activated macrophages. J Exp. Med. 210, 535 (2013). [DOI] [PMC free article] [PubMed] [Google Scholar]
- 7.Vasanthakumar A, Moro K, Xin A, Liao Y, Gloury R, Kawamoto S, Fagarasan S, Mielke LA, Afshar-Sterle S, Masters SL, Nakae S, Saito H, Wentworth JM, Li P, Liao W, Leonard WJ, Smyth GK, Shi W, Nutt SL, Koyasu S, Kallies A, The transcriptional regulators IRF4, BATF and IL-33 orchestrate development and maintenance of adipose tissue-resident regulatory T cells. Nat. Immunol. 16, 276 (2015). [DOI] [PubMed] [Google Scholar]
- 8.Kolodin D, van PN, Li C, Magnuson AM, Cipolletta D, Miller CM, Wagers A, Germain RN, Benoist C, Mathis D, Antigen- and cytokine-driven accumulation of regulatory T cells in visceral adipose tissue of lean mice. Cell Metab. 21, 543 (2015). [DOI] [PMC free article] [PubMed] [Google Scholar]
- 9.Li C, Dispirito JR, Zemmour D, Spallanzani RG, Kuswanto W, Benoist C, Mathis D, TCR transgenic mice reveal stepwise, multi-site acquisition of the distinctive fat-Treg phenotype. Cell. 174, 285 (2018). [DOI] [PMC free article] [PubMed] [Google Scholar]
- 10.Molofsky AB, Van GF, Liang HE, Van Dyken SJ, Nussbaum JC, Lee J, Bluestone JA, Locksley RM, Interleukin-33 and interferon-gamma counter-regulate group 2 innate lymphoid cell activation during immune perturbation. Immunity. 43, 161 (2015). [DOI] [PMC free article] [PubMed] [Google Scholar]
- 11.Burzyn D, Kuswanto W, Kolodin D, Shadrach JL, Cerletti M, Jang Y, Sefik E, Tan TG, Wagers AJ, Benoist C, Mathis D, A special population of regulatory T cells potentiates muscle repair. Cell. 155, 1282 (2013). [DOI] [PMC free article] [PubMed] [Google Scholar]
- 12.Halim TYF, Rana BMJ, Walker JA, Kerscher B, Knolle MD, Jolin HE, Serrao EM, Haim-Vilmovsky L, Teichmann SA, Rodewald HR, Botto M, Vyse TJ, Fallon PG, Li Z, Withers DR, McKenzie ANJ, Tissue-restricted adaptive type 2 immunity is orchestrated by expression of the costimulatory molecule OX40L on group 2 innate lymphoid cells. Immunity. 48, 1195 (2018). [DOI] [PMC free article] [PubMed] [Google Scholar]
- 13.Chang SK, Kohlgruber AC, Mizoguchi F, Michelet X, Wolf BJ, Wei K, Lee PY, Lynch L, Duquette D, Ceperuelo-Mallafre V, Banks AS, Brenner MB, Stromal cell cadherin-11 regulates adipose tissue inflammation and diabetes. J Clin. Invest. 127, 3300 (2017). [DOI] [PMC free article] [PubMed] [Google Scholar]
- 14.Kohlgruber AC, Gal-Oz ST, LaMarche NM, Shimazaki M, Duquette D, Nguyen HN, Mina AI, Paras T, Tavakkoli A, von AU, Banks AS, Shay T, Brenner MB, Lynch L, gammadelta T cells producing interleukin-17A regulate adipose regulatory T cell homeostasis and thermogenesis. Nat Immunol. 19, 464 (2018). [DOI] [PMC free article] [PubMed] [Google Scholar]
- 15.Gupta OT, Gupta RK, Visceral adipose tissue mesothelial cells: living on the edge or just taking up space? Trends Endocrinol Metab. 26, 515 (2015). [DOI] [PubMed] [Google Scholar]
- 16.Pichery M, Mirey E, Mercier P, Lefrancais E, Dujardin A, Ortega N, Girard JP, Endogenous IL-33 is highly expressed in mouse epithelial barrier tissues, lymphoid organs, brain, embryos, and inflamed tissues: in situ analysis using a novel Il-33-LacZ gene trap reporter strain. J. Immunol. 188, 3488 (2012). [DOI] [PubMed] [Google Scholar]
- 17.Bernardo ME, Fibbe WE, Mesenchymal stromal cells: sensors and switchers of inflammation. Cell Stem Cell. 13, 392 (2013). [DOI] [PubMed] [Google Scholar]
- 18.Zilionis R, Nainys J, Veres A, Savova V, Zemmour D, Klein AM, Mazutis L, Single-cell barcoding and sequencing using droplet microfluidics. Nat Protoc. 12, 44 (2017). [DOI] [PubMed] [Google Scholar]
- 19.La MG, Soldatov R, Zeisel A, Braun E, Hochgerner H, Petukhov V, Lidschreiber K, Kastriti ME, Lonnerberg P, Furlan A, Fan J, Borm LE, Liu Z, van BD, Guo J, He X, Barker R, Sundstrom E, Castelo-Branco G, Cramer P, Adameyko I, Linnarsson S, Kharchenko PV, RNA velocity of single cells. Nature. 560, 494 (2018). [DOI] [PMC free article] [PubMed] [Google Scholar]
- 20.Xie T, Wang Y, Deng N, Huang G, Taghavifar F, Geng Y, Liu N, Kulur V, Yao C, Chen P, Liu Z, Stripp B, Tang J, Liang J, Noble PW, Jiang D, Single-cell deconvolution of fibroblast heterogeneity in mouse pulmonary fibrosis. Cell Rep. 22, 3625 (2018). [DOI] [PMC free article] [PubMed] [Google Scholar]
- 21.Vishvanath L, MacPherson KA, Hepler C, Wang QA, Shao M, Spurgin SB, Wang MY, Kusminski CM, Morley TS, Gupta RK, Pdgfrβ+ Mural preadipocytes contribute to adipocyte hyperplasia induced by high-fat-diet feeding and prolonged cold exposure in adult mice. Cell Metab. 23, 350 (2016). [DOI] [PMC free article] [PubMed] [Google Scholar]
- 22.Cipolletta D, Cohen P, Spiegelman BM, Benoist C, Mathis D, Appearance and disappearance of the mRNA signature characteristic of Treg cells in visceral adipose tissue: age, diet, and PPARgamma effects. Proc Natl Acad Sci U S A. 112, 482 (2015). [DOI] [PMC free article] [PubMed] [Google Scholar]
- 23.Marcelin G, Ferreira A, Liu Y, Atlan M, Aron-Wisnewsky J, Pelloux V, Botbol Y, Ambrosini M, Fradet M, Rouault C, Henegar C, Hulot JS, Poitou C, Torcivia A, Nail-Barthelemy R, Bichet JC, Gautier EL, Clement K, A PDGFRα-mediated switch toward CD9high adipocyte progenitors controls obesity-induced adipose tissue fibrosis. Cell Metab. 25, 673 (2017). [DOI] [PubMed] [Google Scholar]
- 24.Cipolletta D, Feuerer M, Li A, Kamei N, Lee J, Shoelson SE, Benoist C, Mathis D, PPAR-γ is a major driver of the accumulation and phenotype of adipose tissue Treg cells. Nature. 486, 549 (2012). [DOI] [PMC free article] [PubMed] [Google Scholar]
- 25.Han SJ, Glatman ZA, Andrade-Oliveira V, Collins N, Dzutsev A, Shaik J, Morais da FD, Harrison OJ, Tamoutounour S, Byrd AL, Smelkinson M, Bouladoux N, Bliska JB, Brenchley JM, Brodsky IE, Belkaid Y, White adipose tissue is a reservoir for memory T cells and promotes protective memory responses to infection. Immunity. 47, 1154 (2017). [DOI] [PMC free article] [PubMed] [Google Scholar]
- 26.Schwalie PC, Dong H, Zachara M, Russeil J, Alpern D, Akchiche N, Caprara C, Sun W, Schlaudraff KU, Soldati G, Wolfrum C, Deplancke B, A stromal cell population that inhibits adipogenesis in mammalian fat depots. Nature. 559, 103 (2018). [DOI] [PubMed] [Google Scholar]
- 27.Burl RB, Ramseyer VD, Rondini EA, Pique-Regi R, Lee YH, Granneman JG, Deconstructing adipogenesis induced by β3-adrenergic receptor activation with single-cell expression profiling. Cell Metab. 28, 300 (2018). [DOI] [PMC free article] [PubMed] [Google Scholar]
- 28.Mutsaers SE, The mesothelial cell. Int J Biochem. Cell Biol. 36, 9 (2004). [DOI] [PubMed] [Google Scholar]
- 29.Martin NT, Martin MU, Interleukin 33 is a guardian of barriers and a local alarmin. Nat Immunol. 17, 122 (2016). [DOI] [PubMed] [Google Scholar]
- 30.Kakkar R, Hei H, Dobner S, Lee RT, Interleukin 33 as a mechanically responsive cytokine secreted by living cells. J. Biol. Chem. 287, 6941 (2012). [DOI] [PMC free article] [PubMed] [Google Scholar]
- 31.Roesch K, Jadhav AP, Trimarchi JM, Stadler MB, Roska B, Sun BB, Cepko CL, The transcriptome of retinal Muller glial cells. J Comp Neurol. 509, 225 (2008). [DOI] [PMC free article] [PubMed] [Google Scholar]
- 32.Townsend MJ, Fallon PG, Matthews DJ, Jolin HE, McKenzie AN, T1/ST2-deficient mice demonstrate the importance of T1/ST2 in developing primary T helper cell type 2 responses. J Exp Med. 191, 1069 (2000). [DOI] [PMC free article] [PubMed] [Google Scholar]
- 33.Chen WY, Hong J, Gannon J, Kakkar R, Lee RT, Myocardial pressure overload induces systemic inflammation through endothelial cell IL-33. Proc Natl Acad Sci U S A. 112, 7249 (2015). [DOI] [PMC free article] [PubMed] [Google Scholar]
- 34.Bettelli E, Carrier Y, Gao W, Korn T, Strom TB, Oukka M, Weiner HL, Kuchroo VK, Reciprocal developmental pathways for the generation of pathogenic effector TH17 and regulatory T cells. Nature. 441, 235 (2006). [DOI] [PubMed] [Google Scholar]
- 35.Rubtsov YP, Rasmussen JP, Chi EY, Fontenot J, Castelli L, Ye X, Treuting P, Siewe L, Roers A, Henderson WR Jr., Muller W, Rudensky AY, Regulatory T cell-derived interleukin-10 limits inflammation at environmental interfaces. Immunity. 28, 546 (2008). [DOI] [PubMed] [Google Scholar]
- 36.Zemmour D, Zilionis R, Kiner E, Klein AM, Mathis D, Benoist C, Single-cell gene expression reveals a landscape of regulatory T cell phenotypes shaped by the TCR. Nat Immunol. 19, 291 (2018). [DOI] [PMC free article] [PubMed] [Google Scholar]
- 37.Kim D, Pertea G, Trapnell C, Pimentel H, Kelley R, Salzberg SL, TopHat2: accurate alignment of transcriptomes in the presence of insertions, deletions and gene fusions. Genome Biol. 14, R36 (2013). [DOI] [PMC free article] [PubMed] [Google Scholar]
- 38.van der Maaten L, Hinton G, Visualizing high-dimensional data using t-SNE. Journal of Machine Learning Research. 9, 2579 (2008). [Google Scholar]
- 39.Klein AM, Mazutis L, Akartuna I, Tallapragada N, Veres A, Li V, Peshkin L, Weitz DA, Kirschner MW, Droplet barcoding for single-cell transcriptomics applied to embryonic stem cells. Cell. 161, 1187 (2015). [DOI] [PMC free article] [PubMed] [Google Scholar]
- 40.Grun D, Lyubimova A, Kester L, Wiebrands K, Basak O, Sasaki N, Clevers H, van OA, Single-cell messenger RNA sequencing reveals rare intestinal cell types. Nature. 525, 251 (2015). [DOI] [PubMed] [Google Scholar]
- 41.R Development Core Team, R: a language and environment for statistical computing Vienna, Austria: the R Foundation for Statistical Computing; Available online at http://www.R-project.org (2017). [Google Scholar]
- 42.Love MI, Huber W, Anders S, Moderated estimation of fold change and dispersion for RNA-seq data with DESeq2. Genome Biol. 15, 550 (2014). [DOI] [PMC free article] [PubMed] [Google Scholar]
- 43.Picelli S, Faridani OR, Bjorklund AK, Winberg G, Sagasser S, Sandberg R, Full-length RNA-seq from single cells using Smart-seq2. Nat Protoc. 9, 171 (2014). [DOI] [PubMed] [Google Scholar]
- 44.Trapnell C, Roberts A, Goff L, Pertea G, Kim D, Kelley DR, Pimentel H, Salzberg SL, Rinn JL, Pachter L, Differential gene and transcript expression analysis of RNA-seq experiments with TopHat and Cufflinks. Nat Protoc. 7, 562 (2012). [DOI] [PMC free article] [PubMed] [Google Scholar]
- 45.Subramanian A, Tamayo P, Mootha VK, Mukherjee S, Ebert BL, Gillette MA, Paulovich A, Pomeroy SL, Golub TR, Lander ES, Mesirov JP, Gene set enrichment analysis: a knowledge-based approach for interpreting genome-wide expression profiles. Proc Natl. Acad Sci U S. A. 102, 15545 (2005). [DOI] [PMC free article] [PubMed] [Google Scholar]
Associated Data
This section collects any data citations, data availability statements, or supplementary materials included in this article.