Abstract
The underlying pathophysiology of myocardial ischemia is incompletely understood, resulting in persistent difficulty of diagnosis. This limited understanding of underlying mechanisms encourages a data driven approach, which seeks to identify patterns in the ECG data that can be linked statistically to disease states. Laplacian Eigen-maps (LE) is a dimensionality reduction method popularized in machine learning that we have shown in large animal experiments to identify underlying ischemic stress both earlier in an ischemic episode, and more robustly, than typical clinical markers. We have now extended this approach to body surface potential mapping (BSPM) recordings acquired during acute, transient ischemia episodes from animal and human PTCA studies.
Our previous studies, suggest that the LE approach is sensitive to the spatiotemporal electrocardiographic consequences of ischemia-induced stress within the heart and on the epicardial surface. In this study, we expand this technique to the body surface of animals and humans. Across 10 episodes of induced ischemia in animals and 200 human recordings during PTCA, the LE algorithm was able to detect ischemic events from BSPM as changes in the morphology of the resulting trajectories while maintaining the superior temporal performance the LE-metric has shown previously.
1. Introduction
Myocardial ischemia occurs when the coronary perfusion in the heart is outstripped by the metabolic demand of the cardiac tissue. This perfusion deficit results in a series of electrical changes that can be measured on the body surface. This electrical response is a reflection of the ischemic stress being induced on the heart and can be used as a noninvasive means of diagnosis. Diagnosis based on the ECG has both a long history and a compelling rationale. However, identification of robust markers of ischemia remains challenging. This is further motivated by the notion that ischemia is present long before it can be detected on the torso surface using traditional means. This delay in the time between when the cardiac tissue becomes ischemic and when those changes are visible on the torso surface motivate the need to develop better metrics which can detect ischemia earlier without sacrificing diagnostic performance. Ischemia affects more than any single region of the electrogram, suggesting that additional metrics could reveal ischemic stress earlier and with a greater robustness than current clinical standards. [1]
To leverage the changes across the entire QRST we employed a machine learning technique known as Laplacian Eigenmaps (LE)[2]. LE is an algorithm that utilizes the entire QRST over all available leads nonlinearly projected onto a lower dimensional parameter space from which differentiating features can be extracted. We applied LE to quantify changes in this lower dimensional space, or LE space, to produce what we call the LE metric. Our previous results with LE showed that LE-based metrics could detect ischemia earlier in an ischemic episode than traditional signal space metrics. [3]
This work extends the capability of LE to the body surface in both our closed chest animal experiments and BSPM data collected during PTCA. We also determined whether the LE space could be learned ahead of time so that any BSPM could be mapped into the space an have the severity of ischemia stratified. With this predefined LE space new subjects can be mapped into the space and the deviation away from the training manifold may be able to gauge the level of ischemic stress in the new subject.
2. Methods
2.1. Experimental Data Collection
The experimental cardiac electrograms and electrocardiograms used for this study were collected over a series of closed-chest canine experiments during which we induced episodes of acute myocardial ischemia. [4] Each ischemic episode, or intervention, lasted 15 minutes with a 30-minute downtime to allow the tissue to recover before subsequent episodes. Anywhere from 3–8 interventions were performed per animal, using ischemic protocols designed to produce a graded ischemia in the tissue perfused by the left anterior descending (LAD) artery. A total of 10 episodes across two animals were chosen for this study. Electrograms were captured during the experiment using 20 −30 plunge needles, each with ten electrodes along the shaft that measure the intramural potentials in addition to an epicardial sock with 247 electrodes. Body surface potentials were then captured using 72 – 100 electrodes across the anterior surface of the closed torso surface. Signals were captured simultaneously using a 1024 channel multiplexor at 1kHz. The signals were the processed and fiducialized using the PFEIFER signal processing platform. [5]
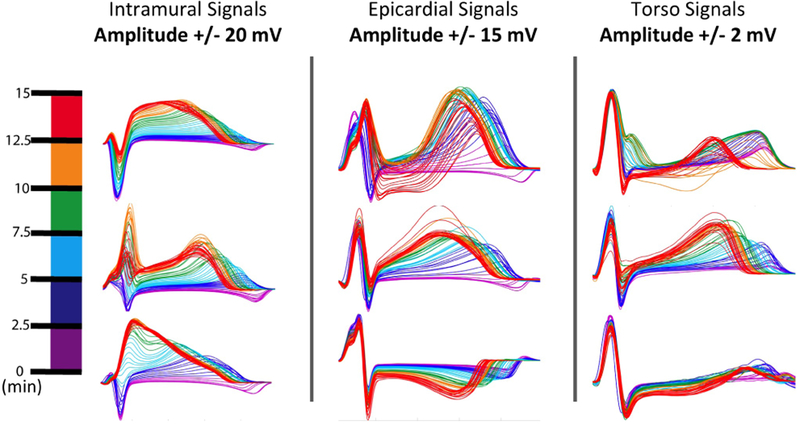
To visualize how these changes are manifested on an electrode by electrode resolution we created what we call “rainbow plots”, see Figure 1, which show a subset of time aligned beats extracted from throughout the ischemic episode. This visualization shows how the electrocardiographic consequences of ischemia are progressively delayed the further the measurement site moves away from the site of ischemic injury.
Figure 1.
Showing the temporal progression of ischemic stress as seen by electrodes within the intramural tissue, on the epicardial surface, and the torso surface. The colormap on the left shows how the color maps to progression into the ischemic episode. All plots are from the same episode of ischemia as measured across the three measurement sites studied.
2.2. BSPM Collection
During acute episodes of percutaneous transluminal coronary angioplasty (PTCA) 120 unipolar leads were placed on the body surface during episodes of complete coronary occlusion. For this study 200 episodes of ischemia were extracted from the Dalhousie University PTCA dataset.[6] During each of these episodes a baseline recording was taken and another recording was taken at the peak of the inflation. These recordings were captured using the Dalhousie leadset which allowed the 120 recordings to be interpolated to a 352 electrode leadset encompassing the entire torso surface. Some subjects have multiple inflations within the same vessel included in the dataset.
2.3. Laplacian Eigenmaps
Laplacian Eigenmaps (LE) is a dimensionality reduction method that is capable of reducing many simultaneous time signals into a trajectory on a manifold of lower dimensionality. In both the pre-trained and subject specific specific implementations, as described in detail in Erem et al.[2], each time point measured across the entire set of electrodes corresponds to a single location on the manifold. These trajectories were obtained by computing a matrix of inverse exponentials of pairwise Euclidean distances between all input points, and then taking its singular value decomposition (SVD). The inverse exponentials were scaled to emphasize local relationships in the data. The SVD determined and ranked the significance of the coordinates in the lower dimensional space. We defined three relevant coordinates to be the second through fourth columns of the right singular vector matrix (the first column was ignored because it is constant.) [7] [2]
2.3.1. LE using Experimental Recordings
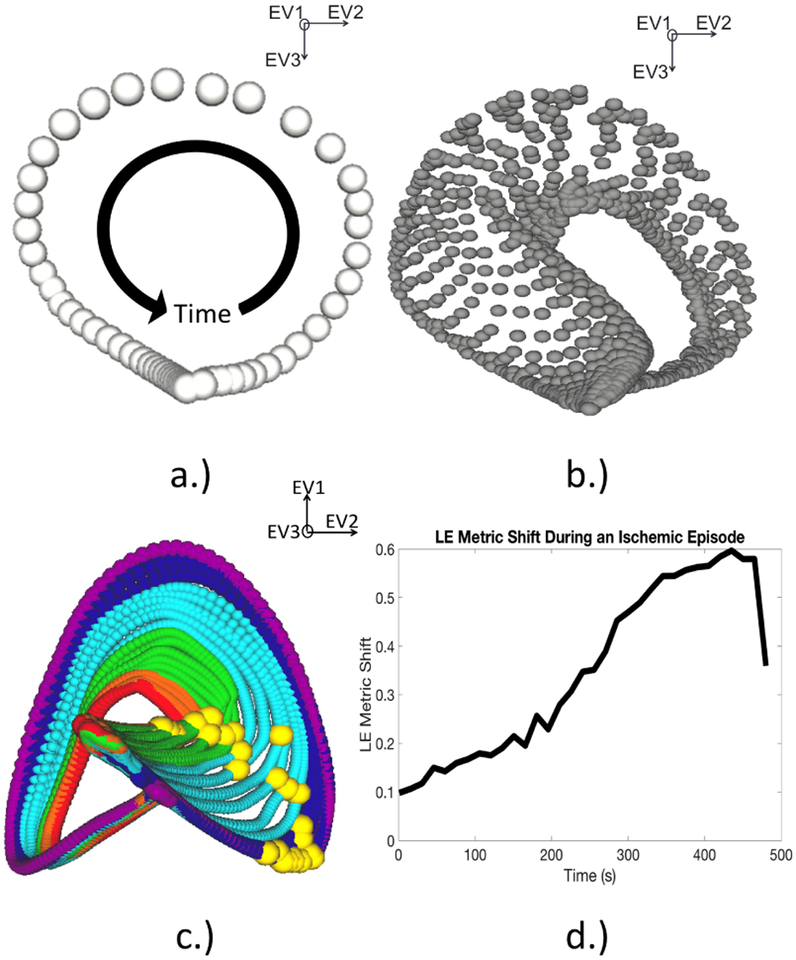
For the experimental recordings, the manifold coordinates were learned using the beats recorded during the initial rest period before the first intervention was induced using a similar scheme as in previous studies. [3] Once the coordinate space was identified, it was populated with subsequent beats over repeated episodes of induced ischemia, as seen in Fig. 2B. The manifold produced by this analysis consisted of a single trajectory for every beat in the experiment. As progressively ischemic beats were mapped into the manifold space, large regions of the trajectories responded to the underlying stress state. To determine which point on the trajectory responded most robustly, we measured the Euclidean distance between each point on the healthy trajectory and its corresponding point on each subsequent trajectory for each beat in the experiment. The trajectory point that showed the greatest CR was chosen as the LE metric for that intervention. The magnitude of distance between each point chosen, seen in Fig. 2C, was used as the LE metric. Measuring this distance over the course of the intervention results the plot seen in Fig. 2D. [3]
Figure 2.
Learning and utilizing the LE space to create a metric for ischemia. A.) This manifold consists of a single trajectory corresponding to a beat during the rest period, before the induction of ischemia. The progression of the ECG and its relation to the trajectory are shown by the black arrow. B.) This manifold shows several beats mapped into the same manifold space. Each trajectory corresponds to a single representative beat during the intervention. C.) This final manifold shows the previous trajectories now color coded using the same scheme in Figure 1. The yellow spheres represent the instants chosen from each trajectory. D.) This is a plot tracking the euclidean distance between each yellow sphere.
2.3.2. Pre-Trained LE space using BSPMs
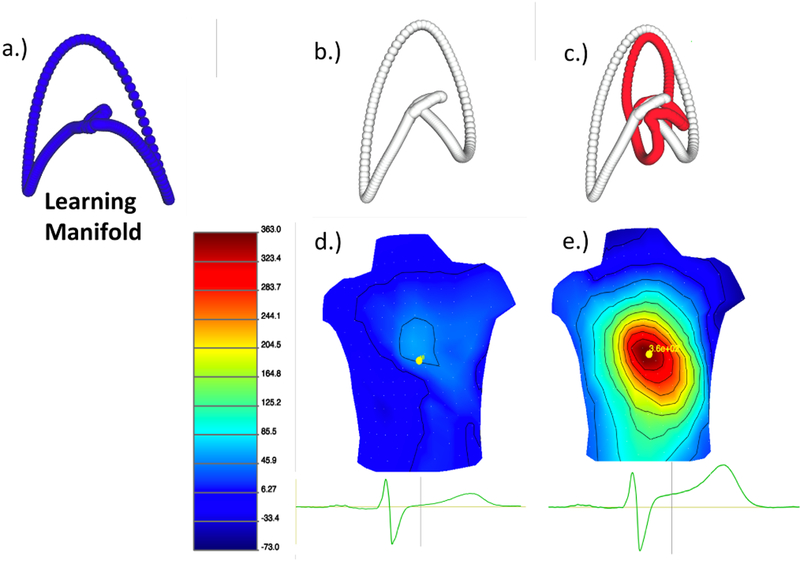
The manifold coordinates for the BSPMs were learned using a control dataset, this dataset was a patient whose pre-balloon recording showed very little ischemic stress. Once the LE space was defined all other ischemic episodes were then mapped into the predefined LE space. However, due to the limited measurements during the ballon inflation (one pre inflation and one at peak inflation) it is not possible to perform the temporal analysis and a qualitative analysis was performed to determine if the pre-inflation trajectories differed significantly than the peak inflation recordings. Figure 3 shows the training manifold (A.)) and the two trajectories B.) and C.) corresponding to the BSPMs in D.) and E.). These BSPMs were visualized using the map3d platform (http://www.sci.utah.edu/cibc-software/map3d.html).
Figure 3.
Pre-Training the LE manifold and then mapping a new patient into that pre-defined space. a.) The trajectory used to learn the LE space. b.) A beat taken before the balloon inflation mapped into the pre-trained space. c.) A trajectory corresponding to a representative beat before and after balloon inflation. d.) The corresponding BSPM of the representative beat before balloon inflation. e.) The BSPM after balloon inflation.
2.4. Evaluation of Ischemia Metrics
To compare the performance of the LE metric against the signal space metrics on the torso surface the quality metrics introduced in our previous studies were used. [3] These quality metrics, time to threshold (TTT) and contrast ratio (CR), were used to quantify the response time and robustness of that response. We have now extended these same measures to the torso surface recordings from our animal and human recordings.
where is the mean value at rest or control of any metric and Am is the maximum value of the metric.
3. Results
3.1. Time to Threshold and Contrast Ratio
Table 1 shows the values of TTT and CR for all the metrics we compared, the same metrics chosen in our previous study using LE. [3] Of the 10 interventions evaluated, the LE metrics detected ischemia earlier than all additional metrics considered while the ST-based metrics had the highest CR followed by the LE metric. This echoes similar results on a larger study population on the epicardial surface.
Table 1.
Evaluating the TTT and CR of Six Metrics on the Torso Surface Designed to Detect Ischemic Stress
| Metric | TTT (s) | CR |
|---|---|---|
| ST40% | 351 ± 104 | 6.1 ± 2.3 |
| ST60 | 374 ± 142 | 3.6 ± 1.86 |
| T-wave Peak | 353 ± 108 | 2.1 ± 0.82 |
| T-wave Integral | 395 ± 133 | 2.4 ± 0.95 |
| QRS Integral | 450 ± 130 | 1.15 ± 1.2 |
| LE | 284 ± 142 | 2.5 ± 0.71 |
3.2. Human BSPM stratification
The LE algorithm was able to distinguish between the baseline and peak recordings in the human BSPMs during balloon inflations. The delineation between the baseline and peak recordings proved to be statistically significant. While preliminary, this performance on the body surface is promising.
4. Discussion and Conclusions
The purpose of this study was to determine if the superior temporal performance seen using LE to detect ischemia on the epicardium also transferred to the torso surface. These preliminary results are promising and show a similar trend, in that the LE metric precedes T-wave-based metrics followed by ST-based metrics, and finally the QRS based metric. Furthermore, the ability to map trajectories into the pre-trained space is promising in transferring this tool into a setting where signals from healthy subjects are not available. The sensitivity of the LE approach to is chemic stress, even on the torso surface, shows great utility in using metrics derived from this low-order space.
While our results on the torso surface are preliminary, in both animals and humans, the ability to detect ischemia from the torso surface suggests that the heightened performance of the LE metric versus traditional metrics may be transferable to the clinical setting.
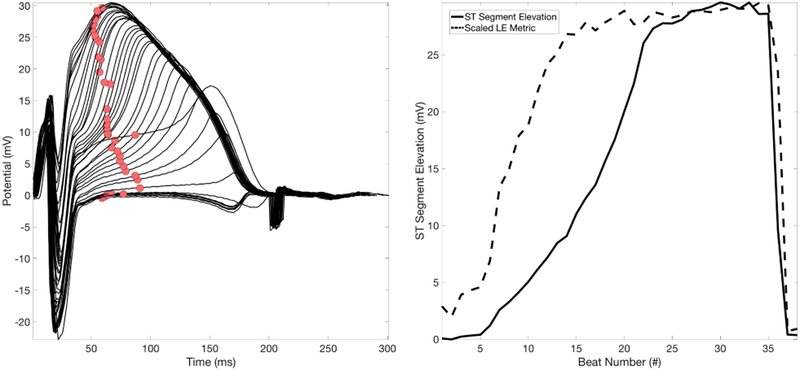
Figure 4.
ST Segment Elevation vs. the LE Metric. LEFT: A single electrode with consecutive beats overlaid over a single episode of ischemia. The red circles are tracking the ST40% metric. RIGHT: The ST40% run-metric (solid) overlaid with the LE run-metric(dashed).
Acknowledgements
Support for this research comes from the NIH NIGMS Center for Integrative Biomedical Computing (www.sci.utah.edu/cibc), NIH NIGMS grant no. P41GM103545, the Nora Eccles Treadwell Foundation for Cardiovascular Research.
References
- [1].Kleber AG, Janse MJ, Wilms-Schopmann F, Wilde A, Coronel R. Changes in conduction velocity during acute ischemia in ventricular myocardium of the isolated porcine heart. Circulation 1986;73(1):189–198. [DOI] [PubMed] [Google Scholar]
- [2].Erem B, Orellana RM, Hyde DE, Peters JM, Duffy FH, Stovicek P, Warfield SK, MacLeod RS, Tadmor G, Brooks DH. Extensions to a manifold learning framework for time-series analysis on dynamic manifolds in bioelectric signals. Physical Review E 2016;93(4):042218. [DOI] [PMC free article] [PubMed] [Google Scholar]
- [3].Good WW, Erem B, Zenger B, Coll-Font J, Brooks DH, MacLeod RS. Temporal performance of laplacian eigenmaps and 3d conduction velocity in detecting ischemic stress. Journal of Electrocardiology 2018;. [DOI] [PMC free article] [PubMed] [Google Scholar]
- [4].Zenger B, Good W, MacLeod RS. Electrocardiographic comparison of dobutamine and bruce cardiac stress testing with high resolution mapping in experimental models. Computing in Cardiology 2017;44:1. [DOI] [PMC free article] [PubMed] [Google Scholar]
- [5].Rodenhauser A, Good WW, Zenger B, Tate J, Aras K, Burton B, MacLeod RS. Pfeifer: Preprocessing framework for electrograms intermittently fiducialized from experimental recordings. The Journal of Open Source Software 2018; 3:472. [DOI] [PMC free article] [PubMed] [Google Scholar]
- [6].Horacek BM, Warren JW, Penney CJ, MacLeod RS, Gardner MJ, Feldman CL, et al. Optimal electrocardiographic leads for detecting acute myocardial ischemia. Journal of Electro-cardiology 2001;34(4):97–111. [DOI] [PubMed] [Google Scholar]
- [7].Belkin M, Niyogi P. Laplacian eigenmaps for dimensionality reduction and data representation. Neural Computation 2003;15(6):1373–1396. [Google Scholar]


