Abstract
Bacteria produce different amounts of their proteins in response to different conditions. The ability to accurately quantitate the rates of protein synthesis across the genome is an important step towards understanding both underlying regulation and bacterial physiology at a systems level. Ribosome profiling (deep-sequencing of ribosome protected mRNA fragments) enables accurate and high-throughput measurement of such synthesis rates. Ribosomes protect RNAs from nuclease digestion; thus, by collecting and sequencing protected footprints, one can obtain information on the position of every ribosome at the time of cell collection. Assuming ribosomes go on to translate full length proteins, the density of ribosomes across an ORF can be used to determine protein synthesis rates. Here we outline a step-by-step protocol and discuss the steps where variability and bias may be introduced, including ways to minimize it.
1. Introduction
Quantitating protein synthesis rates is important for understanding the physiological state of a cell. While mRNA levels provide a convenient proxy for measuring gene expression, they do not directly reflect protein output due to extensive post-transcriptional regulation. In bacteria, the components of multi-protein complexes provide a common example of genes for which mRNA levels do not accurately reflect the amount of proteins synthesized. The proteins that makeup a complex are often transcribed together as polycistronic operons and, although the mRNA level for each component is typically the same, differential translation ensures that subunits are synthesized in proportion with their stoichiometry within the complex (Li, Burkhardt, Gross, & Weissman, 2014). More broadly, translation efficiency of endogenous mRNAs varies by more than 100-fold in E. coli, further highlighting the importance of measuring the rates of protein synthesis directly (Li et al., 2014).
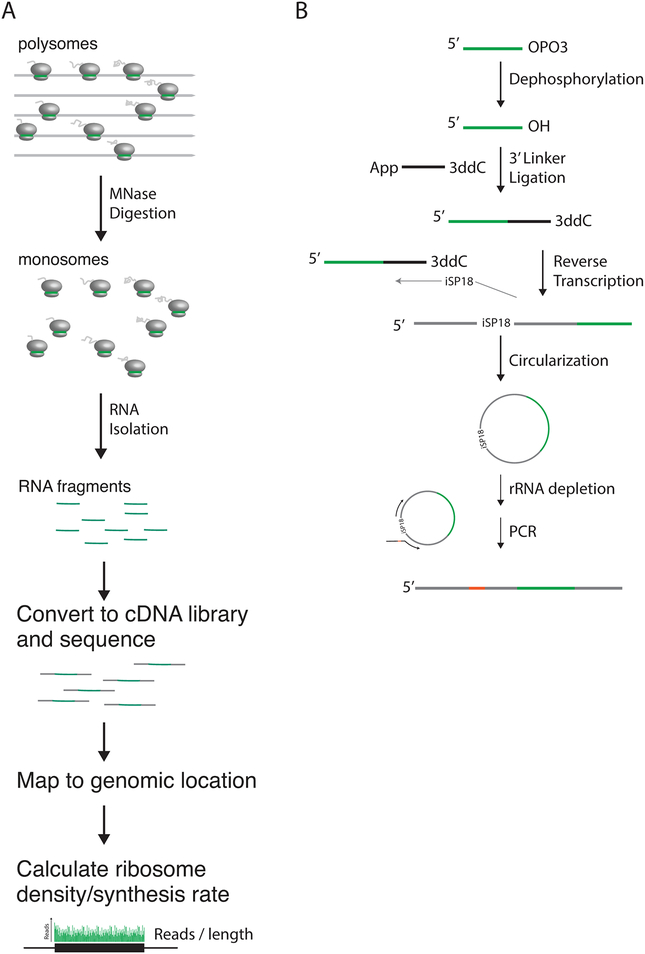
Ribosome profiling takes advantage of high-throughput sequencing technology to allow for global measurement of protein synthesis rates. As ribosomes protect mRNA from nuclease digestions, collecting and sequencing protected fragments yield a snapshot of the location of every ribosome at the time of cell harvesting (Ingolia, Brar, Rouskin, McGeachy, & Weissman, 2012; Ingolia, Ghaemmaghami, Newman, & Weissman, 2009; Oh et al., 2011) (Fig. 1A). If each ribosome is in the process of translating a full-length protein, the density of ribosomes over a gene, or footprint reads per unit length, is representative of the synthesis rate of that protein. Additionally, for proteins that are stable and therefore share the same half-life as the cell doubling time, their steady-state abundance is proportional to the synthesis rate, making this method a simple tool to estimate proteome composition.
Fig. 1.
(A) Overview of ribosome profiling. Polysomes are harvested and digested to monosomes with MNase. Monosomes are isolated and RNA fragments collected. These RNA fragments are then converted into cDNA libraries and sequenced, and mapped reads used to calculate ribosome density and protein synthesis rate. (B) Overview of Illumina sequencing library preparation. Briefly, following size selection, RNA is dephosphorylated, and a pre-adenylated DNA linker ligated to the 3’ end. RNA is then reverse transcribed and cDNA circularized. After rRNA is depleted, final libraries are generated through PCR amplification.
Relating ribosome density and synthesis rate requires two key assumptions. One, that there is little ribosome drop-off over the length of a transcript, and two, that the average elongation rates across genes are similar (Li, 2015). For bacteria in steady-state growth, a superb agreement between ribosome density in the first and second halves of transcripts indicates both that there is little ribosome drop-off and that potential ribosome pause sequences or codon dependent transit time do not substantially change average elongation rate over the length of the transcript (Li et al., 2014; Li, Oh, & Weissman, 2012; Subramaniam, Zid, & O’Shea, 2014). Small residual variations can be corrected for computationally.
Here, we outline a ribosome profiling protocol that can be used to measure protein synthesis rates in E. coli and other bacteria. We also discuss key considerations that must be made to ensure collection of high quality, quantitative information.
2. Cell Collection, Ribosome Footprinting, and Monosome Isolation
2.1. Overview
The first step of ribosome profiling involves collecting cells and preparing cell lysates from which polyribosomes can be prepared. Care must be taken during this step to ensure that the positions of ribosomes accurately represent a snapshot of the cells’ translational state. During cell harvesting, cultures are filtered and cells rapidly collected and flash frozen to minimize the time during which translation can be altered. Further, cell collection is performed at 37 °C with equipment that has also been pre-warmed to this temperature to minimize perturbations to cells that could induce changes to translation. Cells are then lysed in the presence of a translational inhibitor, chloramphenicol, and kept frozen to ensure minimal movement of ribosomes.
Several factors may contribute to artifacts and irreproducible results. If cells are not under steady-state growth, gene expression and translation are sensitive to both the exact time point of harvesting and the history of the culture, e.g. dilution factor and inoculum size. Further, cells transitioning between growth phases often experience sequential depletion of carbon sources and amino acids. The differences in the limiting nutrients can both directly and indirectly affect the kinetics of translation, leading to substantial ribosome drop-off and/or pausing that invalidate the assumptions required for estimating the rates of protein synthesis (Subramaniam et al., 2013; Mohammad, Woolstenhulme, Green, & Buskirk, 2016; Li et al., 2012). To ensure steady-state growth, we recommend careful measurement of a growth curve, and allowing for at least six cell doublings (and ideally ten) of exponential growth to minimize residual effects from the saturated culture. Another source of irreproducibility can occur during cell harvesting using vacuum filtration, in which cells must be rapidly scraped off from the filter as soon as medium is passed through. Repeated scraping from the same filter should be avoided to minimize the amount of time that cells are depleted of nutrients.
Polyribosomes collected from lysed cells are then treated with a ribonuclease to generate monosomes from which protected RNA fragments can be obtained. Ribosome profiling in yeast typically relies on RNase I for such footprinting, a nuclease that is inhibited by the E. coli 30S ribosomal subunit, and thus cannot be used for bacterial footprinting (Datta & Burma, 1972). Instead, Micrococcal nuclease (MNase) is used. MNase activity is biased by sequence, cleaving faster upstream of A and T residues, and contributing to more variability in footprint size than is typically seen with RNase I (Dingwall, Lomonossoff, & Laskey, 1981). Longer ribosome footprints are also due to slow translation elongation at Shine-Dalgarno-like sequences, which interact with the anti-Shine-Dalgarno sequence of the 16S rRNA for a few rounds of amino acid incorporation (Li et al., 2012; O’Connor, Li, Weissman, Atkins, & Baranov, 2013). Therefore, a wider range of fragments should be selected for inclusion in final cDNA libraries. MNase digestion must be run long enough to ensure polysomes are sufficiently collapsed to monosomes, but terminated before overdigestion results in cleavage of rRNA and loss of footprint integrity (Li et al., 2012).
2.2. Reagents
1 M Tris pH 8.0 (FisherSci, cat. no. AM9856)
Ammonium Chloride (Sigma, cat. no. A9434)
Magnesium Chloride (ThermoFisher, cat. no. AM9530G)
Triton X-100 (VWR, cat. no. 97062–208)
Nonidet P-40 Substitute (NP-40, SigmaAldrich, cat. no. 11332473001)
Chloramphenicol (VWR, cat. no. 97061–244)
RNase-free DNase I (Roche, cat. no. 04716728001)
DEPC-Treated, DNase- and RNase-free water (Fisher, cat. no. BP561–1)
Tris (1M), pH 7.0 (FisherSci, cat. no. AM9851)
Nuclease S7 (Micrococcal nuclease) (Roche, cat. no. 10107921001)
SUPERase•In™ RNase Inhibitor (TermoFischer, cat. no. AM2696)
Calcium chloride dihydrate (VWR, cat. no. 97061–904)
EGTA (Sigma, cat. no. E3889)
Sucrose, RNase/DNase free (VWR, 97061–428)
2.3. Equipment
2 L filter flask
GE Nitrocellulose-Mixed Esters of Cellulose Membrane Filters, E02WP09025 (GE)
Ultraware microfiltration assembly (90 mm) (Fisher Scientific)
Flat head stainless steel lab spatulas
Stainless steel reagent digger
50 ml Conical tubes
Liquid Nitrogen
10 ml mixer mill canister with 12 mm diameter ball charge (Retsch)
Mixer mill (Qiagen Tissuelyzer 2)
4 °C microcentrifuge
Seton Open-top Polyclear centrifuge tubes (Seton)
SW41 rotor (Beckman)
Ultracentrifuge
BioComp Instruments 153 Gradient Station ip (BioComp)
BioRad Econo UV Monitor (BioRad)
Cryovials
2.4. Buffer Preparation
Lysis Buffer
Prepare immediately before use
| Ingredient | Final conc. | Stock conc. | Volume |
|---|---|---|---|
| Tris pH 8.0 | 20 mM | 1 M | 30 μl |
| NH4Cl* | 100 mM | 1 M | 150 μl |
| MgCl2 | 10 mM | 1 M | 15 μl |
| Triton X-100* | 0.4 % | 25 % | 24 μl |
| NP-40* | 0.1 % | 20 % | 7.5 μl |
| Chloramphenicol** | 1 mM | 155 mM (50 mg/ml) | 10 μl |
| RNase-free DNase | 100 U/ml | 10 U/μl | 15 μl |
| DEPC H2O | 1248.5 μl | ||
| Total volume | 1500 μl |
Prepare in advance and store at room temperature
Prepare in advance and store at −20 ºC
1 M CaCl2
Prepare in advance and store at room temperature
0.5 M EGTA
Prepare in advance and store at room temperature
10%/55% sucrose solution
| Ingredient | Final conc. | Stock conc. | Volume (ex) |
|---|---|---|---|
| Sucrose | 10% / 55% | 1.5 g / 8.25 g | |
| Tris pH 8.0 | 20 mM | 1 M | 300 μl |
| NH4Cl | 100 mM | 1 M | 1.5 ml |
| MgCl2 | 10 mM | 1 M | 150 μl |
| Chloramphenicol | 1 mM | 155 mM | 97.5 μl |
| DEPC H2O | to 15 ml | ||
| Final volume | 15 ml | 15 ml |
- Prepare without Chloramphenicol at least one hour before use and allow sucrose to dissolve at room temperature
- Can be prepared the day before use
Add chloramphenicol immediately before use and mix well
2.5. Procedure
2.5.1. Cell Harvesting (Fig. 2)
Fig. 2.
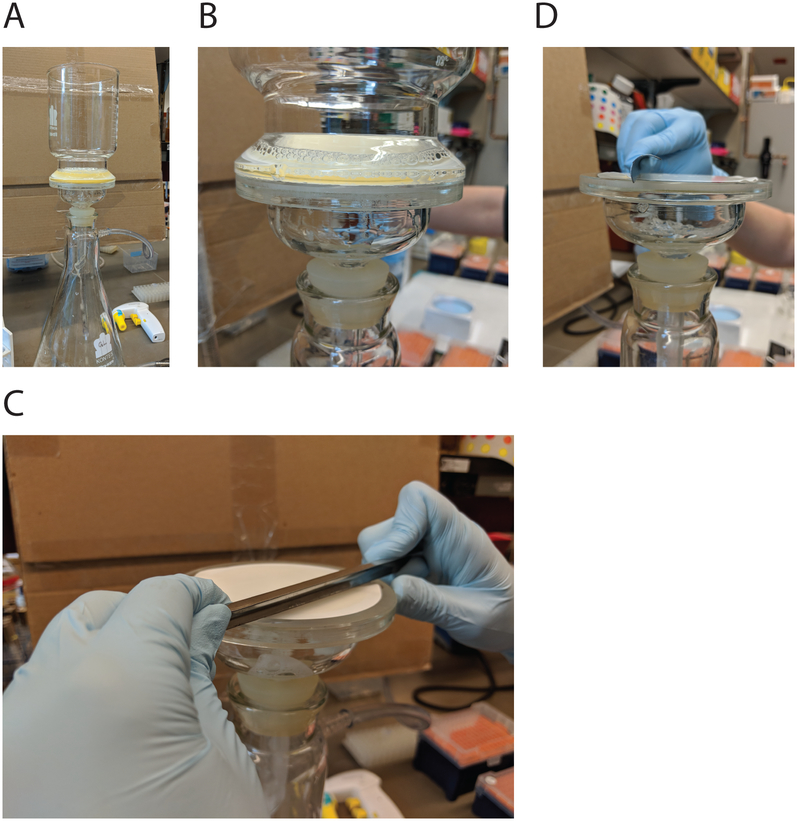
(A) Cell filtration set-up. (B) When liquid is almost finished filtering, immediately turn off vacuum, remove top and (C) scrape cells in one rapid motion. (D) A side view demonstrating the angle the reagent digger should be held at.
Estimated time: Variable; depends on cell growth
Inoculate medium from a single colony and grow overnight at 37 °C
- Back dilute overnight culture to OD600 = 0.001 in 200–250 ml pre-warmed medium and shake at 37 °C
- > 6 doublings before collection
Bring all equipment needed for cell harvesting to 37 °C
- Collect cells when density reaches OD600 = 0.3
- It is important to ensure cells are still in steady state growth at this OD in selected growth medium.
Rapidly filter liquid culture. When liquid has filtered through, immediately turn off vacuum and remove top of filtration apparatus. Scrape cells off filter in a single motion in << 1 second using the long edge of a pre-warmed reagent digger. Transfer immediately to a 50 ml conical tube pre-filled with and stored in liquid N2.
Use a pre-chilled flat head spatula to scrape cells into tube, keeping cells submersed in liquid N2 at all times. The frozen pellet should be at least 10 μl in volume.
Poke holes through cap of tube. Cap tube and tilt to dispense liquid N2
Store tube at −80 °C
2.5.2. Cell lysis
Estimated time: 1 hr.
Pellet lysis buffer by slowly pipetting 650 μL into a 50 ml conical tube filled with liquid N2. Wait for each pellet to sink before pipetting next pellet to prevent pellets from clumping.
Clean 10 ml mixer mill canister with Millipore water and EtOH. Use compressed air to blow dry. Make sure no residual water droplets are left. Fully cool in liquid N2
Combine the lysis pellets with the flash frozen cells in the canister.
Mixer mill 5 times at 15 Hz for 3 min. Cool in liquid N2 between each round.
Open the canister and keep in a shallow water bath to thaw. Transfer lysate to 1.5 ml tube as soon as thawed and keep on ice.
2.5.3. Footprinting
Estimated time: 1 h 40 min.
Centrifuge lysate at 20,000 rpm 10 min 4 °C.
Carefully transfer the supernatant to a new tube. The pellet will be very soft. Avoid transferring viscous DNA to the new tube.
Dilute the supernatant 1:100 in 10 mM Tris pH 7.0
- Measure A260 on Nanodrop and calculate the concentration of the undiluted sample. Blank with 1:100 dilution of lysis buffer.
- You should have ~ 1 mg RNA.
- To 0.5 mg RNA add:
- 750 U MNase
- 100 U SUPERaseIn
- 1 μl 1M CaCl2
- Lysis buffer to 200 μl
Incubate at 25 °C for 1 h
Quench the reaction by adding 2.4 μl of 0.5 M EGTA
Leave on ice
2.5.4. Monosome isolation
Estimated time: 3.5 h
Layer 55% sucrose (~6 ml) below 10% sucrose (~7 ml) in Seton tubes for SW41 rotor. Use marker block provided with gradient maker.
Make the gradient using preprogramed 10–50 short program on gradient station.
Pre-chill the gradients, tubes, buckets, rotor, and the ultracentrifuge to 4 °C.
Load the samples onto gradients at 4 °C.
Balance with lysis buffer.
Spin in ultracentrifuge at 35,000 rpm for 2.5 h at 4 °C
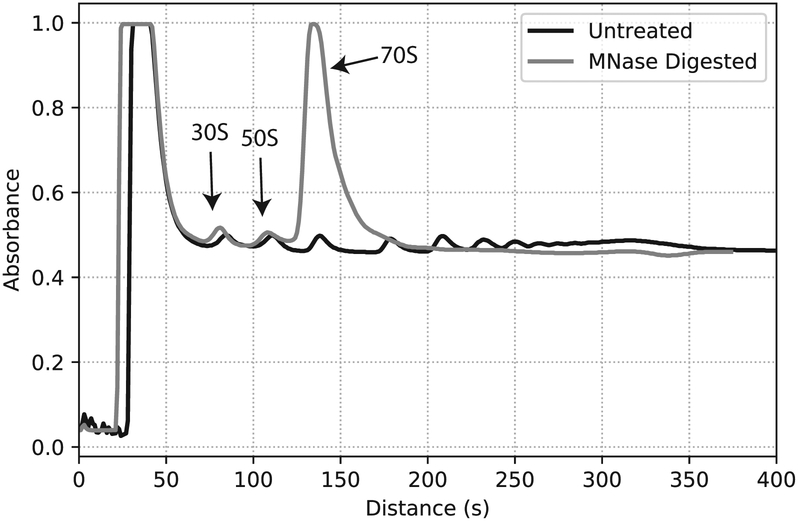
Fractionate at 0.2 mm/s. Measure A260 every second using BioRad Econo UV Monitor (Fig. 3)
Collect monosomes (~1.5 ml) in 2 ml cryovials.
Flash-freeze and store at −80 °C.
Fig. 3.
Traces for an undigested polysome (black) and MNase treated (gray) sample. Peaks corresponding to the 30S, 50S, and 70S monosome are marked.
3. Library Preparation
3.1. Overview
mRNA footprints must be converted into a cDNA library compatible for Illumina sequencing in a way that minimizes introduction of biases that can skew the final library composition. Here, cDNA libraries are generated by first ligating a DNA adapter to the 3’ end of the RNA fragments. Following reverse transcription from the ligated adapter, cDNA is circularized and the final library generated via PCR amplification (Fig. 1B).
Efficient ligation is critical for minimizing bias introduced during library preparation. It has been demonstrated that T4 RNA ligases have sequence and structure preferences, and that the efficiency of ligation is largely dependent on the stability of the structure formed between the RNA fragment and adapter (Zhuang, Fuchs, Sun, Zheng, & Robb, 2012). Here, several steps are taken to ensure effective and maximally efficient ligation. First, to reduce background ligation and circularization of RNA fragments that can prevent productive ligation, a truncated form of T4 RNA ligase that cannot adenylate the 5’ end of RNA/DNA is used in conjunction with a pre-adenylate DNA linker (linker-1) (Hafner et al., 2008; Ho, Wang, Lima, & Shuman, 2004; Yin, Ho, & Shuman, 2003). The 3’ end of the linker is blocked to prevent linker circularization. Second, a ligation reaction is performed with a control oligo (o199) in parallel to measure ligation efficiency. Ligated libraries should be used only if ligation is >80% efficient, though >90% efficiency is ideal. The control oligo additionally provides a control for all other library preparation reactions and helps to identify failed reactions that require further troubleshooting.
3.2. Reagents
Acid phenol chloroform, pH 4.5 (ThermoFisher, cat. no. AM9720)
20% SDS (ThermoFisher, cat. no. AM9820)
Chloroform (Sigma, cat. no. C2432)
Sodium Acetate (3 M), pH 5.5, RNase Free (ThermoFisher, cat. no. AM9740)
Isopropanol, molecular biology grade (FisherSci, cat. no. BP26181)
Ethanol, 200 Proof (VWR, cat. no. AC61509)
Tris (1 M), pH 7.0 (FisherSci, cat. no. AM9851)
Novex 15% TBE-Urea Gel, 10 well (Thermo, cat. no. EC6885)
Novex TBE-Urea Sample Buffer 2× (Thermo, cat. no. LC6876)
10× TBE Buffer (FisherSci, cat. no. AM9863)
10 bp DNA ladder (Invitrogen, cat. no. 10821015)
SYBR gold nucleic acid gel stain (Invitrogen, cat. no. S11494)
GlycoBlue (Invitrogen, cat. no. AM9516)
5 M NaCl (FisherSci, cat. no. AM9759)
T4 Polynucleotide Kinase (NEB, cat. no. M0201L)
SUPERase•In™ RNase Inhibitor (TermoFischer, cat. no. AM2696)
PEG 8000, 50% (Teknova, cat. No. P4180)
T4 RNA ligase 2 truncated K227Q and buffer (NEB, cat. no. M0351S)
DEPC-Treated, DNase, RNase free water (Fisher, cat. no. BP561–1)
Novex 10% TBE-Urea Gel, 10 well (Thermo, cat. no. EC6875BOX)
Deoxynucleotide (dNTP) solution set (NEB, cat. no. N0446S)
SuperScript III Reverse Transcriptase (Invitrogen, cat. no. 18080085)
DTT (Sigma, cat. no. 10708984001)
Sodium hydroxide pellets (Sigma, cat. no. 795429)
1 M Tris pH 8.0 (FisherSci, cat. no. AM9856)
0.5 M EDTA, pH 8.0 (Ambion, cat. no. AM9260G)
CircLigase ssDNA Ligase 5000 U (Illumina, cat. no. CL4115K)
20X SSC Buffer, molecular grade (Progmega, cat. no. V4261)
Tween-20, reagent grade (VWR, cat. no. 97062–332)
Dynabeads® MyOne™ Streptavidin C1 (Thermoscientific, cat. no. 65001)
Phusion polymerase (NEB, cat. no. M0530L)
6× DNA loading dye (Thermo, cat. no. R0611)
Novex TBE Gels, 8%, 10 well (Invitrogen, cat. no. EC6215BOX)
3.3. Common oligos
o199-P: 5’_AUGUACACGGAGUCGACCCGCAACGCGA3phos_3’
Dephosphorylated o199: 5’_AUGUACACGGAGUCGACCCGCAACGCGA_3’
Linker-1: 5’_App/CTGTAGGCACCATCAAT/3ddC_3’
oCJ485: /5Phos/AGATCGGAAGAGCGTCGTGTAGGGAAAGAGTGT/iSp18/CAAGCAGAAGACGGCATACGAGATATTGATGGTGCCTACAG
o1055: 5’_5Biosg/TCATCTCCGGGGGTAGAGCACTGTTTCG_3’
o1056: 5’_5Biosg/GGCTAAACCATGCACCGAAGCTGCGGCAG_3’
o1057: 5’_5Biosg/AAGGCTGAGGCGTGATGACGAGGCACT_3’
o1058: 5’_5Biosg/CGGTGCTGAAGCAACAAATGCCCTGCTT_3’
o231: 5’_CAAGCAGAAGACGGCATACGA_3’
Indexing primer: 5’_AATGATACGGCGACCACCGAGATCTACACGATCGGAAGAGCACACGTCTGAACTCCAGTCACNNNNNNACACTCTTTCCCTACAC_3’(NNNNNN corresponds to custom index.)
3.3. Equipment
Thermomixer
Table top microcentrifuge
Nonstick RNase free tubes, 1.5 mL
4 °C Microcentrifuge
Nanodrop
Standard PAGE Equipment
DynaMag-2 Magnet (Thermo Fisher)
PCR strip tubes
Needle, 18G × 1–1/2
0.5 mL tubes
2 mL screw cap tubes
Spin-X cellulose acetate column (Costar)
3.4. Buffer Preparation
80% EtOH
Prepare in advance and store at room temperature
10 mM Tris pH 7.0
Prepare in advance and store at room temperature
20 μM o199-P
Prepare in advance and store at −20 °C
10 mM dNTPs
Prepare in advance and store at −20 °C
25 μM oCJ485
Prepare in advance and store at −20 °C
1 M NaOH
Prepare in advance and store at room temperature
rRNA subtraction olgio mix
Prepare in advance and store at −20 °C
77 μL 100 μM o1055, 4 μL 100 μM o1056, 17 μL 100 μM o1057, 2 μL 100 μM o1058
1M Tris pH 7.5
Prepare in advance and store at room temperature
7:3 Tris pH 7.0:Tris pH 8.0
1× B&W Buffer
Prepare fresh day of rRNA subtraction
5 μl 1 M Tris 7.5
1 μl 0.5 M EDTA
200 μl 5 M NaCl
10 μl 1% Tween
784 μl H2O
2× B&W Buffer
Prepare fresh day of rRNA subtraction
10 μl 1 M Tris 7.5
2 μl 0.5 M EDTA
400 μl 5 M NaCl
10 μl 1% Tween
578 μl H2O
3.5. Procedure
Note: To minimize degradation of RNA, work in an RNase free lab space; use 70% Ethanol or RNAseZap (Invitrogen) to clean lab bench and equipment before use. Thaw and keep RNA samples on ice when possible. Work to convert RNA to cDNA as quickly as possible, and avoid storing the RNA for longer than one week.
3.5.1. RNA Isolation
Estimated time: 3 h
For each sample, pre-warm 1.5 ml acid phenol chloroform to 65 °C
Add 80 μl 20% SDS to ~1.4 ml fractionated monosomes and split into two tubes
Add 0.75 ml pre-warmed acid phenol chloroform to each tube
Incubate at 65 °C for 5 min at 1,400 rpm in a thermomixer
Chill on ice for 5 min
Spin at 20,000 g from 2 min at room temperature
Transfer top aqueous layer to fresh tube
Add 0.7 ml acid phenol chloroform and incubate at room temperature for 5 min, vortexing occasionally
Repeat steps 6–7
Add 600 μl chloroform and vortex 30 sec. at room temperature
Spin at 20,000 g for 1 min at room temperature
Transfer top aqueous layer to fresh tube
Precipitate by adding 78 μl 3M NaOAc and 0.75 ml isopropanol
Chill samples at −80 °C for ≥30 min
Spin at 20,000 g for 20 min at 4 °C
Remove supernatant and wash pellet in 750 μl 80% EtOH
Spin for 5 min at 4 °C
Remove supernatant; air-dry ≥5 min
Suspend in 11 μl 10 mM Tris pH 7, pool two tubes together for a total volume of 22 μL
3.5.2. Size Selection
Estimated time: 4 h
Pre-run a 15% TBE-Urea PAGE gel in 1× TBE at 200 V for 1 hr.
Measure the concentration of a 1:5 dilution of total RNA in 10 mM Tris pH 7 on Nanodrop
Dilute samples to 20 μg of RNA in 5 μL 10 mM Tris pH 7
Add 5 μL 2× TBE-Urea sample loading buffer to each sample
Set up o199-P control oligo by combining 1 μL 20 μM o199-P, 3 μL 10 mM Tris pH 7, and 5 μL 2X loading buffer
Set up ladder
Denature all samples at 80 °C for 2 min and return to ice
- Run samples on pre-run gel at 200 V for 65 min
- Note: If you are running multiple samples, leave at least one well empty between samples to minimize cross-contamination.
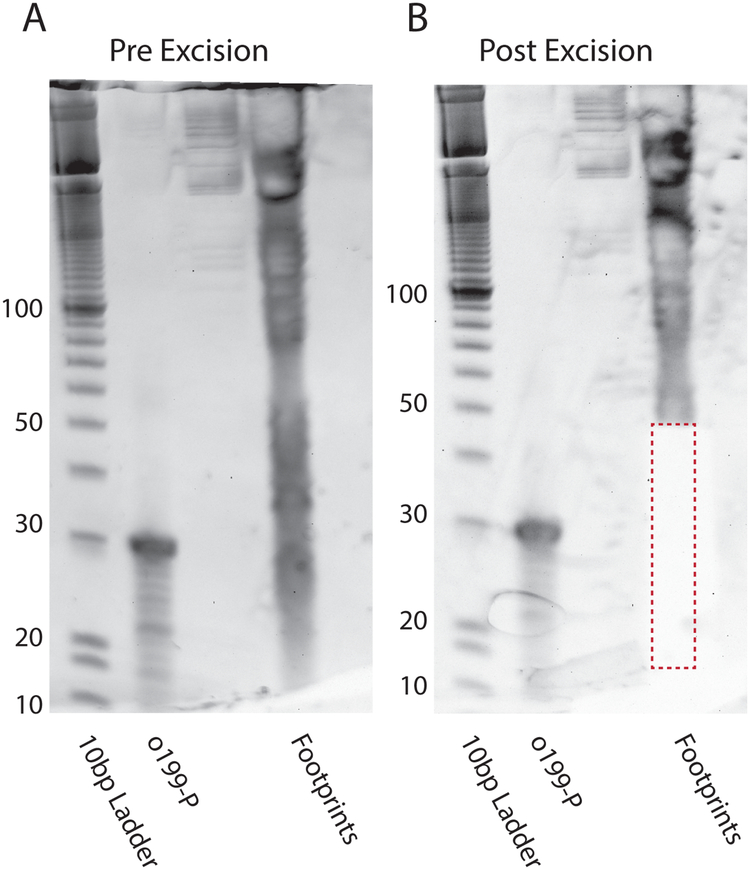
Stain with SYBR gold for 2 min and photograph gel (Fig. 4A)
- Excise between ~15–45 nt (Fig. 4B)
- Also excise o199-P control band
Extract from gel as described in 3.6.1
Precipitate as described in 3.6.2
Suspend in 15 μL 10 mM Tris pH 7
Fig. 4.
Size Selection Gel. (A) RNA footprints are run on a 15% TBE-Urea PAGE gel at 200 V for 1 h and stained with SYBR gold. In addition to mRNA fragments, distinct rRNA fragments can be observed. Also run are a 10 bp ladder (Lane 1), and phosphorylated o199 control oligo (Lane 2). (B) Fragments between 15–45 nucleotides are excised and extracted.
3.5.3. Dephosphorylation
Estimated time: 2.5 h
Make a master mix with 2 μl T4 PNK buffer without ATP and 1 μl SUPERaseIn
- Add 3 μl master mix to 15 μl sample
- Include a reaction with o199 control gel extracted in 3.5.2
Add 2 μl T4 PNK
Incubate at 37 °C for 1 h
Heat inactivate at 75 °C for 10 min
Precipitate as described in 3.6.2
Suspend in 11 μl 10 mM Tris pH 7
3.5.4. Ligation and Size Selection
Estimated time: 7 hours
Note: SuperaseIn is omitted from the reaction, as we have observed that it results in decreased ligation efficiency. However, this should only be done if you are confident that the reaction is free of RNase contamination.
Measure the concentration of RNA
- Prepare 2 pmol RNA in 5 μl 10 mM Tris 7. Also prepare 2 pmol of the following controls:
- o199 dephosphorylation reaction from 3.5.3
- Dephosphorylated o199 to control for failed dephosphorylation
Denature at 80 °C for 2 min and return to ice
- Make a master mix containing: (Make sure well mixed)
- 10 μl PEG 8000, 50%
- 2 μl 10× T4 RNA ligase 2 buffer
- 1 μl H2O
Combine 13 μl master mix with 1 μl 100 μM linker-1, 1 μL T4 RNA ligase 2 truncated K227Q, and 5 μl RNA
Incubate at 25 °C for 2.5 h
Precipitate as described in 3.6.2 and suspend in 6 μl 10 mM Tris pH 7
Pre-run a 10% TBE-Urea gel for 1 h at 200 V
Add 6 μl TBE-urea loading buffer and denature at 80 °C for 2 min followed by ice for 2 min
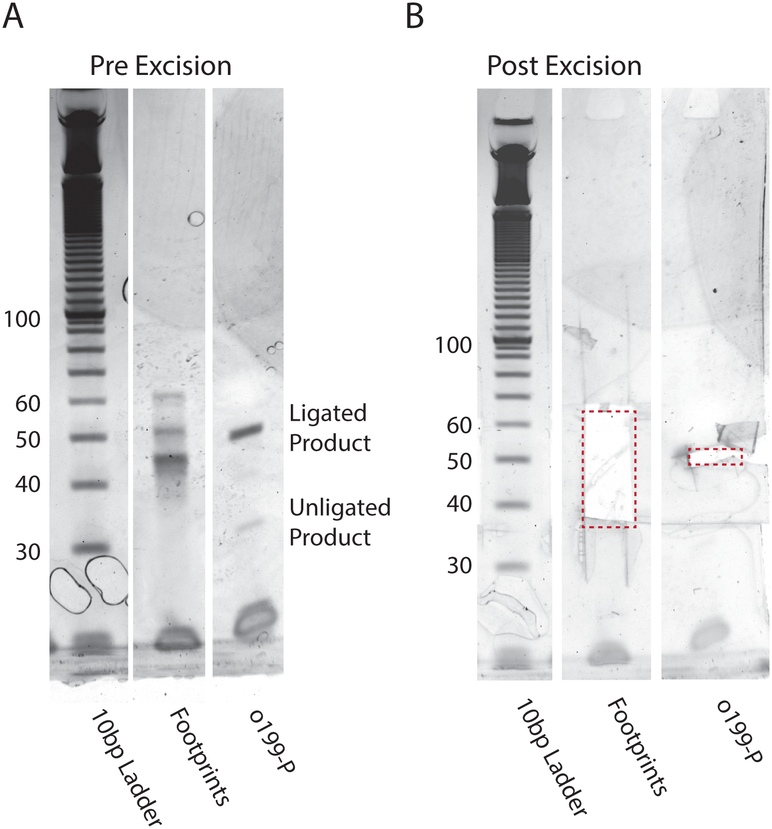
Run on 10% TBE-Urea gel for 50 min at 200 V. Excise 35–65 bases (Fig. 5)
Gel purify and precipitate as described in 3.6.1 and 3.6.2
Suspend in 10 μL 10 mM Tris pH 7.0 and transfer to a new tube
Fig. 5.
Ligation Size Selection Gel. (A) Products of the ligation reaction with the library and o199 control are run on a 10% TBE-Urea gel at 200 V for 50 min and stained with SYBR gold. The efficiency of ligation can be determined by comparing the intensity of unligated to ligated o199. Discrete bands in the footprint lane correspond to contaminants from rRNA fragments (B) Ligated products (35–65 nt) are excised and extracted. Note: This image was edited and lanes containing unrelated samples cut such that only pertinent information is displayed.
3.5.5. Reverse transcription and size selection
Estimated time: 4 h
Combine 10 μl RNA, 1 μl 10 mM dNTPs, 1 μl 25 μM oCJ485 and 1.5 μl H2O
Denature at 65 °C for 5 min
Make a master mix with 4 μl 5× First Strand Buffer, 1 μl SUPERaseIn, and 1 μl 0.1 M DTT
Add 6 μL master mix to each sample and mix by pipetting
Add 1 μL Superscript III
Incubate at 50 °C for 30 min.
Hydrolyze RNA by adding 2.3 μL 1M NaOH and incubate at 95 °C for 15 min.
Add 23 μL TBE-urea loading buffer and denature at 80 °C for 2 min followed by ice for 2 min.
Pre-run 10% TBE-Urea gel for 1 h at 200 V
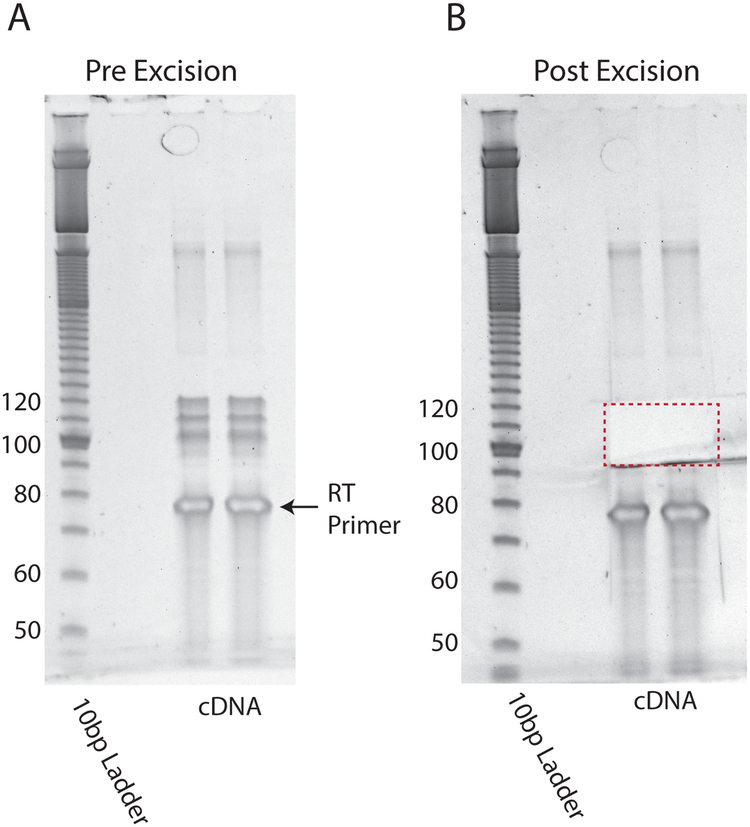
Run each sample over two wells on 10% TBE-Urea gel at 200 V for 80 minutes (Fig. 6A)
Excise 90–120 bases, avoiding excision of RT primer (Fig. 6B).
Gel purify and precipitate (DNA) as described in 3.6.1 and 3.6.2
Suspend in 15 μl 10 mM Tris pH 8 and transfer to a new tube.
Fig. 6.
RT Size Selection Gel. (A) RT product is run over two lanes of a 10% TBE-Urea gel for 80 min at 200 V and stained with SYBR gold. (B) RT product (~90–120 nt) is excised and extracted.
3.5.6. Circularization
Estimated time: 2.5 hr.
Make a master mix containing the following: 1 μL 1 mM ATP, 2 μl 10× CircLigase Buffer, 1 μL 50 mM MnCl2
Add 4 μl master mix to 15 μL DNA
Add 1 μl CircLigase
Incubate at 60 °C for 1 h
Spike in an additional 1 μl CircLigase into each sample
Incubate at 60 °C for 1 h
Inactive at 80 °C for 10 min. and return to ice
3.5.7. rRNA subtraction
Estimated time: 3 h
Note: The oligos used here are specific for E. coli rRNA contaminants and may not work in other bacterial species. When performing ribosome profiling on a new species for the first time, perform a low-depth sequencing run to identify the most common rRNA contaminants. Then design oligos to remove these contaminants; oligos should have the same sequence as the RNA contaminant.
Make a master mix containing the following: 1 μl rRNA subtraction oligo mix, 1 μl 20× SSC, 3 μl H2O
Add 5 μl master mix to 5 μl DNA
Incubate at 98 °C for 75 sec.
Ramp down to 37 °C over an hour.
Hybridize by incubating at 37 °C for 20 min.
- Prepare 25 μl MyOne Streptavidin C1 Dynabeads per sample as follows (prepare as master mix):
- Wash three times with 25 μl 1× B&W Buffer
- Suspend in 10 μl 2× B&W buffer
- Incubate at 37 °C
Add 10 μl beads to 10 μl hybridization reaction
Incubate at 37 °C for 15 min.
Recover elute to a new tube
Precipitate as described in 3.6.2
Suspend in 10 μl 10 mM Tris pH 8
3.5.8. PCR and size selection
-
1
Make a master mix containing the following: 16.7 μl 5× HF buffer, 1.7 μl 10 mM dNTPs, 0.4 μl 100 μM o231, 0.4 μl 100 μM indexing primer, 59.2 μl H2O, 0.8 μl HF Phusion
-
2
Add 79.2 μl to 5 μl DNA
-
3
Aliquot 17 μl PCR mix into 4 different PCR strip tubes
-
4
Run the following PCR reaction, removing each strip after 6, 8, 10, and 12 cycles, respectively
| Initial | 98 ºC | 30 s |
| Denature | 98 ºC | 10 s |
| Annealing | 60 ºC | 10 s |
| Extension | 72 ºC | 5 s |
-
5
Add 3.5 μl 6× DNA loading dye to each sample
-
6
Prepare ladder: 1 μl 10 bp ladder, 16 μl 10 mM Tris 8, 3.5 μl 6× DNA loading dye
-
7
Pre-run an 8% TBE PAGE Gel at 180 V for 1 h
-
8
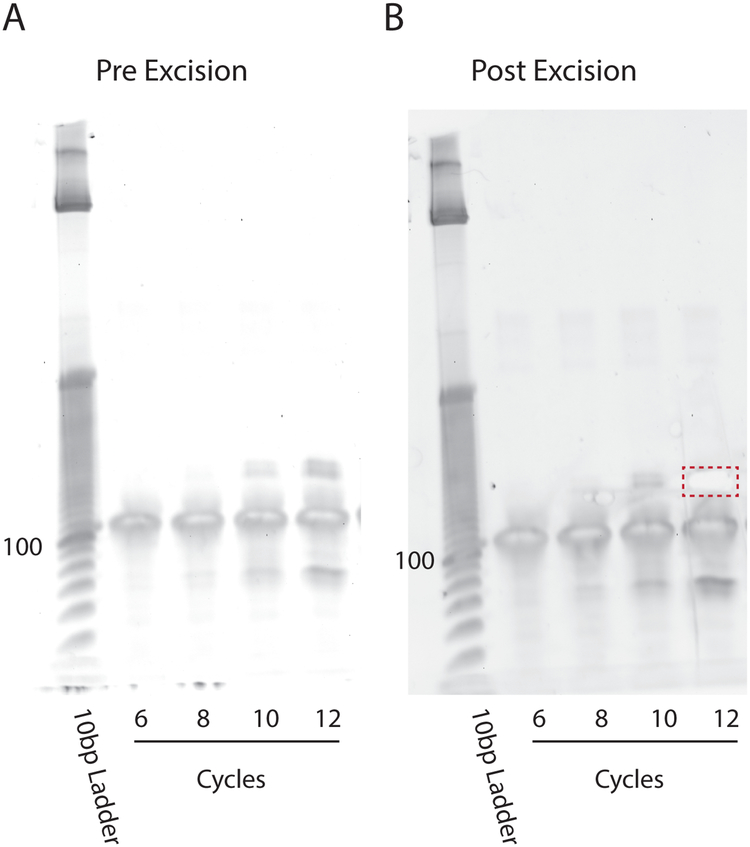
Run samples on 8% TBE PAGE Gel at 180 V for 50 min. (Fig. 7A)
-
9
Excise band at ~175 bp (Fig. 7B)
-
10
Gel extract and precipitate as described in 3.6.1 and 3.6.2
-
11
Suspend in 11 μl 10 mM Tris pH 8
Fig. 7.
PCR Gel. (A) PCR reactions run 6, 8, 10, and 12 cycles are run on an 8% TBE-PAGE gel at 180 V for 1 h and stained with SYBR gold. (B) The product amplified with the cycle number yielding the most product without excessive generation of non-specific products is excised and extracted.
3.5.9. Bioanalysis and Illumina Sequencing
Run samples on a high sensitivity DNA bioanalyzer chip to assess concentration, size, and purity.
Sequence using Illumina HiSeq or NextSeq
3.6. Common Procedures
3.6.1. Gel Extraction
Poke a hole into the bottom of a 0.5 ml tube with a needle and place in a 2 ml screw cap tube
Transfer the gel slice into 0.5 ml tube
Spin at 20,000 g for 3 min.
Collect remaining gel pieces and add 0.5 ml 10 mM Tris 7 (for RNA) or 10 mM Tris 8 (for DNA)
Shake at 14,000 rpm at 70 °C for 10 min on a thermomixer
Transfer to Spin-X cellulose acetate column. Cut the tip of the pipette tip off before transferring to ensure remaining gel pieces do not block tip
Spin at 20,000 g for 3 min and transfer eluate to new 1.5 ml tube
3.6.2. Precipitation
Bring volume to 500 μl by adding 10 mM Tris 7 (for RNA) or 10 mM Tris 8 (for DNA)
- Add the following:
- For RNA: 55 μl 3 M NaOAc (pH 5.5), 2 uL glycoblue, 550 μl isopropanol
- For DNA: 32 μl, 5 M NaCl, 1 μl 0.5 M EDTA, 2 μl glycoblue, 550 μl isopropanol
Vortex
Incubate at −80 °C for 30 min. (or overnight)
Spin at 20,000 g for 30 min. at 4 °C
Remove supernatant and wash pellet in 750 μl 80% EtOH at 4 °C
Spin for 5 min at 4 °C
- Remove supernatant; air-dry ≥5 min
- Note: It is important that pellets are fully dry, especially when RNA/DNA will be immediately used in an enzymatic reaction. Suspended pellet can also be transferred to a new tube to minimize salt contamination.
4. Analysis
4.1. Overview
Protein synthesis rates can be estimated from the density of reads mapping to a transcript. As described earlier, ribosome density is correlated with synthesis rate assuming no ribosome drop-off and constant elongation rate across transcripts. Here we provide quality control procedures to confirm that the data collected are mostly consistent with these assumptions, as well as methods to correct local variations that may be caused by small differences in elongation rate or ribosome processivity. Transcripts with strong ribosome pause sites or other non-typical features should be considered individually, as described below.
4.2. Software
Cutadapt v.1.16
Bowtie 1.2.2
4.3. Procedure
4.3.1. Alignment
- Remove adapters from reads using cutadapt with the command below, where m specifies the minimum allowed read length, u trims the 5’ end of reads to remove nucleotides added by non-template addition during RT, a specifies the adapter sequence and o the output file.
- -m 15 -u 1 -a CTGTAGGCACCATCAAT -o $OUTPUTNAME $INPUT_FASTQ
Discard reads that are not between 20–42 nt.
- Use bowtie to align reads to a reference file containing rRNA sequences using the command below and output unmapped reads using --un. Use –v 2 to allow two mismatches, and –m to only report reads that align to a single genomic location.
- bowtie rRNA_bowtie_reference -v 2 -m 1 $INPUT_FASTQ > $OUTPUT_BOWTIE --un $OUTPUT_UNMAPPED
Use bowtie to align unaligned reads from step 2 to reference genome as above. Use the reads aligned here for quantification of protein synthesis rates.
4.3.2. Quality Control Procedures
Ribosome drop-off can be assessed via a metagene analysis. First, for each gene, calculate the average number of reads in every 50-codon window normalized to the average number of reads in the first 50 codons. Exclude genes with fewer than 128 total reads per transcript. For a sequencing depth of 100 million reads, approximately 75% of genes will be above this cutoff for E. coli grown in a rich medium. Fit the median value calculated for each position across all genes to an exponential decay function to assess the read drop-off over the length of the transcript. This is often referred to as metagene profile. For E. coli, around 20% drop-off typically occurs (Li et al., 2014), but this value can differ between species.
If a substantial amount of ribosome drop-off is observed, the growth medium and harvesting condition should be carefully examined to avoid nutrient depletion. For example, cell cultures transitioning out of exponential phase may start to consume amino acids, leading to prolonged ribosome pausing and subsequent rescue and release. Signatures of pausing and ribosome drop-off at specific codons can be determined by aligning ribosome density profiles by the codon of interest. Another source of substantial drop-off relates to slow cell harvesting, in which cells are depleted for all nutrients. It is therefore important to carefully characterize the growth curve and move as quickly as possible during harvesting.
Confirm that reads map primarily to protein coding regions of genes, and few reads map to UTRs.
4.3.3. Quantifying Protein Synthesis Rates
The ribosome density profile for each gene is first normalized to the metagene profile to correct for small density decreases as a function of gene length. Another correction is then applied to account for small local variations in elongation rates. For example, slow elongation at Shine-Dalgarno-like sequences can lead to elevated ribosome density without affecting protein synthesis rates. The effects of such sequences can be first quantitated by averaging across all incidences, and the magnitude of the effects used to correct for each incidence.
Calculate protein synthesis rates as the sum of corrected ribosome density profile to an ORF divided by the length of the ORF. Exclude reads from the first and last five codons, as the read density at these codons is affected by translation initiation and termination.
Compare protein synthesis rates between samples by normalizing ribosome density by the total number of mapped reads, excluding reads that map to rRNA.
4.3.4. E. coli genes requiring further consideration
Genes that included a frameshift signal (prfB, dnaX). One can calculate ribosome density by considering only the length of transcript following the frameshift.
Selenoproteins (FdhF, FdoG, FdnG). As the selenocysteine codon terminates most ribosomes, ribosome density can be calculated using the length of the transcript following this codon.
Proteins without a stop codon (eg. arfA). Consider the last codon in the transcript the stop codon.
Genes with known ribosome stall sites (secM, tnaC). Exclude the ribosome density in the region surrounding the stall site
Genes with nearly identical sequence (tufA/tufB, gadA/gadB, ynaE/ydfK, ldrA/ldrC, ybfD/yhhI, tfaR/tfaQ, rzoD/rzoR, pinR/pinQ). Consider these pairs as the same protein and calculate synthesis by averaging ribosome density over both coding sequences.
5. Conclusion
Ribosome profiling can be used make global measurements of protein synthesis rates. To ensure such measurements are as accurate as possible and truly reflect the translational state of the cell, care must be taken to prepare samples in a way that minimizes variability and bias. When cells are collected, they must be rapidly flash frozen to ensure ribosome location does not change, and thus that footprints represent the location of ribosomes. When cDNA is prepared, the efficiencies of reactions must be optimized to ensure that minimal bias is introduced into the final library. Lastly, data processing is critical for confirming that key assumptions required to relate ribosome density to synthesis rate hold.
Quantitative measurements of protein synthesis rates have the ability to uncover interesting new biology. Protein synthesis accounts for 50% of energy consumption in exponentially growing bacterial cells and ribosome profiling can thus reveal how cells allocate this important resource. Determining differences in protein synthesis rates in different conditions or across species can help elucidate how bacterial cells regulate their proteome in response to different constraints and can help to uncover novel forms of translational regulation.
References
- Datta AK, & Burma DP (1972). Association of ribonuclease I with ribosomes and their subunits. The Journal of Biological Chemistry, 247(21), 6795–6801. [PubMed] [Google Scholar]
- Dingwall C, Lomonossoff GP, & Laskey RA (1981). High sequence specificity of micrococcal nuclease. Nucleic Acids Research, 9(12), 2659–2673. [DOI] [PMC free article] [PubMed] [Google Scholar]
- Hafner M, Landgraf P, Ludwig J, Rice A, Ojo T, Lin C, & Tuschl T (2008). Identification of microRNAs and other small regulatory RNAs using cDNA library sequencing. Methods (San Diego, Calif.), 44(1), 3–12. 10.1016/j.ymeth.2007.09.009 [DOI] [PMC free article] [PubMed] [Google Scholar]
- Ho CK, Wang LK, Lima CD, & Shuman S (2004). Structure and mechanism of RNA ligase. Structure (London, England: 1993), 12(2), 327–339. 10.1016/j.str.2004.01.011 [DOI] [PubMed] [Google Scholar]
- Ingolia NT, Brar GA, Rouskin S, McGeachy AM, & Weissman JS (2012). The ribosome profiling strategy for monitoring translation in vivo by deep sequencing of ribosome-protected mRNA fragments. Nature Protocols, 7(8), 1534–1550. 10.1038/nprot.2012.086 [DOI] [PMC free article] [PubMed] [Google Scholar]
- Ingolia NT, Ghaemmaghami S, Newman JRS, & Weissman JS (2009). Genome-Wide Analysis in Vivo of Translation with Nucleotide Resolution Using Ribosome Profiling. Science, 324(5924), 218–223. 10.1126/science.1168978 [DOI] [PMC free article] [PubMed] [Google Scholar]
- Li G-W (2015). How do bacteria tune translation efficiency? Current Opinion in Microbiology, 24, 66–71. 10.1016/j.mib.2015.01.001 [DOI] [PMC free article] [PubMed] [Google Scholar]
- Li G-W, Burkhardt D, Gross C, & Weissman JS (2014). Quantifying absolute protein synthesis rates reveals principles underlying allocation of cellular resources. Cell, 157(3), 624–635. 10.1016/j.cell.2014.02.033 [DOI] [PMC free article] [PubMed] [Google Scholar]
- Li G-W, Oh E, & Weissman JS (2012). The anti-Shine–Dalgarno sequence drives translational pausing and codon choice in bacteria. Nature, 484(7395), 538–541. 10.1038/nature10965 [DOI] [PMC free article] [PubMed] [Google Scholar]
- Mohammad F, Woolstenhulme CJ, Green R, & Buskirk AR (2016). Clarifying the Translational Pausing Landscape in Bacteria by Ribosome Profiling. Cell Reports, 14(4), 686–694. 10.1016/j.celrep.2015.12.073 [DOI] [PMC free article] [PubMed] [Google Scholar]
- O’Connor PBF, Li G-W, Weissman JS, Atkins JF, & Baranov PV (2013). rRNA:mRNA pairing alters the length and the symmetry of mRNA-protected fragments in ribosome profiling experiments. Bioinformatics, 29(12), 1488–1491. 10.1093/bioinformatics/btt184 [DOI] [PMC free article] [PubMed] [Google Scholar]
- Oh E, Becker AH, Sandikci A, Huber D, Chaba R, Gloge F, … Bukau B (2011). Selective Ribosome Profiling Reveals the Cotranslational Chaperone Action of Trigger Factor In Vivo. Cell, 147(6), 1295–1308. 10.1016/j.cell.2011.10.044 [DOI] [PMC free article] [PubMed] [Google Scholar]
- Subramaniam AR, DeLoughery A, Bradshaw N, Chen Y, O’Shea E, Losick R, & Chai Y (2013). A serine sensor for multicellularity in a bacterium. ELife, 2 10.7554/eLife.01501 [DOI] [PMC free article] [PubMed] [Google Scholar]
- Subramaniam AR, Zid BM, & O’Shea EK (2014). An Integrated Approach Reveals Regulatory Controls on Bacterial Translation Elongation. Cell, 159(5), 1200–1211. 10.1016/j.cell.2014.10.043 [DOI] [PMC free article] [PubMed] [Google Scholar]
- Yin S, Ho CK, & Shuman S (2003). Structure-Function Analysis of T4 RNA Ligase 2. Journal of Biological Chemistry, 278(20), 17601–17608. 10.1074/jbc.M300817200 [DOI] [PubMed] [Google Scholar]
- Zhuang F, Fuchs RT, Sun Z, Zheng Y, & Robb GB (2012). Structural bias in T4 RNA ligase-mediated 3’-adapter ligation. Nucleic Acids Research, 40(7), e54 10.1093/nar/gkr1263 [DOI] [PMC free article] [PubMed] [Google Scholar]


