Abstract
β-Glucosidase (EC 3.2.1.21) plays an essential role in the removal of glycosyl residues from disaccharide cellobiose to produce glucose during the hydrolysis of lignocellulosic biomass. Although there exist a few β-glucosidase that are tolerant to large concentrations of glucose, these enzymes are typically prone to glucose inhibition. Understanding the basis of this inhibition is important for the production of cheaper biofuels from lignocellulose. In this study, all-atom molecular dynamics simulation at different temperatures and glucose concentrations was used to understand the molecular basis of glucose inhibition of GH1 β-glucosidase (B8CYA8) from Halothermothrix orenii. Our results show that glucose induces a broadening of the active site tunnel through residues lining the tunnel and facilitates the accumulation of glucose. In particular, we observed that glucose accumulates at the tunnel entrance and near the catalytic sites to block substrate accessibility and inhibit enzyme activity. The reduction of enzyme activity was also confirmed experimentally through specific activity measurements in the presence of 0–2.5 M glucose. We also show that the increase in glucose concentrations leads to a decrease in the number of water molecules inside the tunnel to affect substrate hydrolysis. Overall, the results help in understanding the role of residues along the active site tunnel for the engineering of glucose-tolerant β-glucosidase.
1. Introduction
The production of biofuels from lignocellulosic biomass could be broadly divided into three steps—pretreatment of the biomass to reduce cellulose recalcitrance, enzymatic conversion of the polysaccharides in pretreated biomass to sugars, and the conversion of the sugars to fuels by the same or other microbes through fermentative processes. A group of enzymes, known as cellulase, break down the polysaccharides into sugars.1,2 These enzymes work synergistically to hydrolyze the biomass and are made up of the minimum set of endoglucanase, cellobiohydrolase, and β-glucosidase. Endoglucanase (EC 3.2.1.4) randomly cleave the β-1,4 glycosidic linkages of cellulose, cellobiohydrolase (EC 3.2.1.91) attack the cellulose chain ends to produce a dimer of glucose called cellobiose, which is linked by a β-1,4 glycosidic bond. β-Glucosidase (EC 3.2.1.21) hydrolyze the β-1,4 linkage in cellobiose to produce glucose.3−6 The final hydrolysis step is generally recognized as a limiting step in the conversion of lignocellulosic biomass to sugars as β-glucosidase are inhibited by its reaction product glucose.4,6,7 The efficient and economic hydrolysis by cellulase requires enzymes that are also active in high glucose concentrations. Understanding the basis of glucose inhibition and engineering toward relieving this product inhibition is, therefore, a major challenge.
Whereas the typical inhibition constant (Ki,app) of glucose on the β-glucosidase chromogenic substrate, p-nitrophenyl-β-d-glucoside (pNPGlc), is less than 50 mM, recently there have been reports of bacterial β-glucosidase that are either not inhibited by glucose or are stimulated in the presence of glucose.6,8,9 Thus, there exists a large difference in glucose inhibition amongst β-glucosidase. Though the molecular mechanism of glucose inhibition or tolerance is not well understood, experimental studies of glucose-tolerant β-glucosidase have attributed tolerance to narrower and deeper active site tunnels, specific residues in the tunnel, and the presence of allosteric sites on these enzymes.10−12 Molecular dynamics (MD) simulation is an important tool to characterize structural dynamics, flexibility, and mechanism of enzymes and help gain deeper insights into the structure–function relationship.13−16 Computational modeling and MD simulation have been reported toward understanding catalytic activity and thermostability of cellulases.15,17−23 However, there are no reports of theoretical studies for a molecular-level understanding of β-glucosidase inhibition or the effect of glucose on the structural stability of such enzymes.
As part of a program to understand how the β-glucosidase reaction product, glucose, interacts with the enzyme, we have been studying the effects of glucose on β-glucosidase across mesophilic and thermophilic organisms.6,9,24 One such enzyme is the highly active and thermostable GH1 β-glucosidase (B8CYA8) from Halothermothrix orenii.24,25 The higher stability of this enzyme has been shown to be a promising target toward industrial applications.26 In the present work, we report the effect of glucose on B8CYA8 activity and employed MD simulations to investigate the influence of glucose on B8CYA8 activity and stability. In order to understand the effect of different concentrations of glucose on protein structure and activity, we computed the root mean square deviation (rmsd) of amino acids, root mean square fluctuations (RMSFs) of Cα atoms, radial distribution functions, and distance distribution between the selected pair at different temperatures. The MD studies provide us a way to understand the basis of B8CYA8 glucose inhibition of catalytic activity at high glucose concentrations.
2. Methods
2.1. Protein Expression, Purification, and Assay
The synthetic gene corresponding to the β-glucosidase from H. orenii was constructed (BankIt1930137BG_Halotherm KU867899) as reported previously and expressed in Escherichia coli Top 10F′ cells (Life Technologies, La Jolla, CA).24 B8CYA8 was purified using a protocol detailed earlier and purity was confirmed by 10% sodium dodecyl sulfate polyacrylamide gel electrophoresis.24 The specific activity of enzymes in the presence of glucose was determined on the substrate p-nitrophenyl β-d-glucopyranoside (pNPGlc) after incubation in the buffer containing different concentrations of glucose under optimum conditions.
2.2. Computational Methodology and Simulation Details
The X-ray crystallographic structure of the β-glucosidase was obtained from the protein data bank (PDB ID: 4PTX).25 At first, the energy-minimized protein molecule (B8CYA8) was kept at the center of a cubic simulation box 120 Å long and then solvated with water. We used the TIP3P water model in all of our simulations.27 We added glucose molecules by using PACKMOL28 to obtain the following desired glucose concentration, Xglu of 0, 0.2, 0.5, 1.5, and 2.0 M. All the potential parameters were obtained from the CHARMM36 force field. The simulations were performed by NAMD-2.9 simulation tools.29−32 By taking initial configurations at different Xglu, the conjugate gradient method was applied for 300 000 steps to remove all the energetically unfavorable contacts. Three different temperatures were chosen to represent the room temperature (300 K), high catalytic activity (335 K), and maximum temperatures at which any catalytic activity could be measured (375 K). We have also performed simulation at 450 K at which the protein is denatured (450 K). The starting configurations were equilibrated for 3.0 ns in the NPT ensemble to fix the simulation box length. In NPT simulations, Nose–Hoover thermostat and barostat coupling constants were taken to be 0.5 and 2.0 ps, respectively.33,34 The pressure was kept constant at 1.0 atm. After the simulation box length was fixed, we equilibrated the system for 5.0 ns in the NVT ensemble. To analyze different properties of the system, a production run of 50 ns was performed in the NVT ensemble for all cases. At 335 K, a production run of 100 ns was also performed for all glucose concentrations and at 300 and 375 K, a longer production run was performed for 0.5, 1.5, and 2.0 M glucose concentrations to check the validity of the production run up to 50 ns. We observed that there were no qualitative differences in the results for 50 and 100 ns production runs. The temperature of the systems was kept constant at the respective temperature by using the damping coefficient (γ) of 1.0 ps–1 by Langevin dynamics. Long-range interactions are handled by the particle mesh Ewald method,35−37 with real space cut-off of 16 and 2 Å pair-list cut-off. We used a scaling factor of 1–4 in all our simulations. The time step was of 1.0 fs and all the properties were computed from the trajectories stored at an interval of 4.0 ps during the production run.
3. Results and Discussion
3.1. Validation of the Forcefield
We determined the rmsd of the energy-minimized B8CYA8 backbone at 300, 335, 375, and 475 K in the absence of glucose. Figure 1a shows that up to 50 ns, rmsd is less than 2.5 Å for temperatures up to 375 K. However, above 375 K, rmsd increased drastically, suggesting a temperature-induced denaturation of B8CYA8. This agreed well with the experimentally determined unfolding temperature of this protein24 and proved that the force field used in this study was capable of reproducing the experimentally observed stability of B8CYA8. Figure 1b shows the root-mean-square fluctuation (RMSF) of each amino acid residue at different temperatures. Up to 375 K, the residues have a maximum RMSF of less than 3.5 Å. However, at 475 K the RMSF of many B8CYA8 residues are more than 5.0 Å and indicates protein denaturation at that temperature.38 As the experimental data indicated that B8CYA8 displays maximum activity at 335 K and denatures at temperature close to 375 K, we will hereafter restrict our discussions to enzyme behavior at 300, 335, and 375 K.
Figure 1.
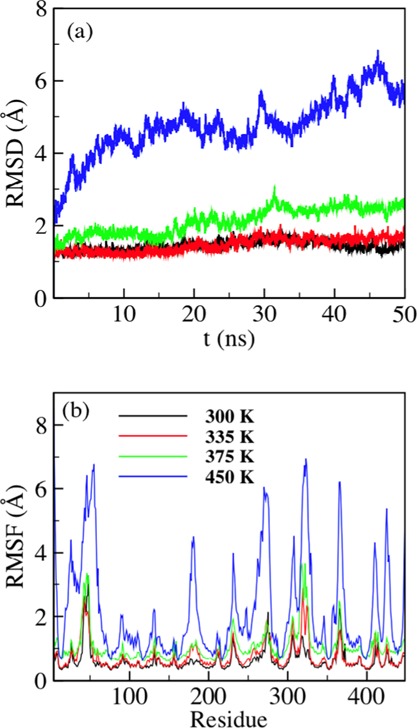
(a) rmsd and (b) RMSF of the B8CYA8 backbone in the absence of glucose at 300, 335, 375, and 450 K.
3.2. Structural Changes of B8CYA8 in the Presence of Glucose
The B8CYA8 crystal structure indicates the presence of a TIM barrel with a (α/β)8 fold and the active site located deep inside a tunnel.27 This enzyme active site tunnel is made up of catalytic residues E354 and E166 located at the glycone-binding site at the bottom of the tunnel, aglycone-binding site located toward the middle of the tunnel, and gatekeeper residues at the edge of the active site tunnel near the tunnel opening. The aglycone-binding site contains a diverse combination of residues and generally forms hydrophobic interactions as well as water-mediated H-bonds with the substrate.39 The glycone-binding sites contain a highly conserved combination of residues that can also form H-bonds with the substrate. Thus, the amino acids in the active site tunnel are thought to play an important role in β-glucosidase activity and glucose tolerance.39−44 The B8CYA8 glycone, aglycone, and gatekeeper residues are listed in Table S1.
In order to understand any structural changes caused by the reaction product glucose at different regions of the enzyme including the active site tunnel, we started by computing the rmsd of the B8CYA8 backbone in the presence of glucose. Figure 2a–c shows rmsd at 300, 335, and 375 K, respectively, in the presence of different concentrations of glucose. At 300 K, the rmsd is nearly independent of glucose concentrations. However, at 335 and 375 K subtle rmsd variations were observed across different glucose concentrations. To better understand the gross structural changes, we computed average rmsd (rmsdavg) from the last 20 ns production runs at different temperatures and glucose concentrations (Table 1). The columns under temperatures in Table 1 represent average rmsd. At 335 and 375 K, the rmsdavg of B8CYA8 increases at high glucose concentrations with a maximum rmsdavg of 3.51 Å. This suggests structural changes in B8CYA8 up to 375 K, when the protein remains folded. To visualize these structural changes, we took the last configuration of the enzyme from each simulation and aligned the backbone Cα atoms. Figure S1A–E shows the last B8CYA8 structure from each MD run at 335 K and Figure 3 shows their aligned structures.
Figure 2.
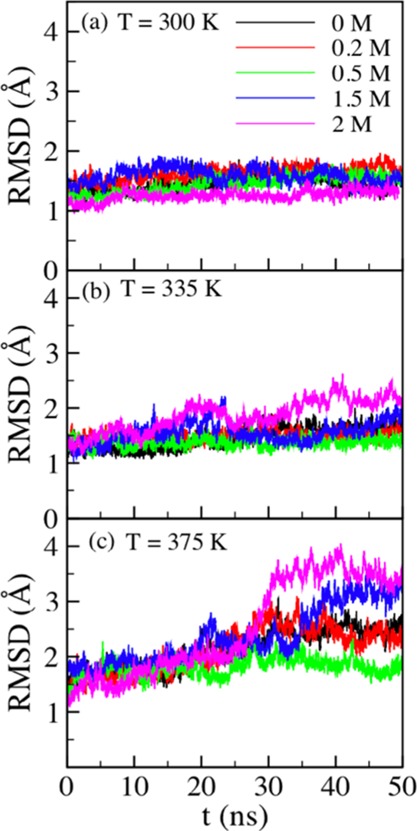
rmsd of the B8CYA8 backbone at (a) 300, (b) 335, and (c) 375 K at different glucose concentrations.
Table 1. Average rmsd (rmsdavg) of the B8CYA8 Cα Backbone at 300, 335, and 375 K in the Presence of 0, 0.2, 0.5, 1.5, and 2.0 M Glucosea.
| rmsdavg (Å) |
|||
|---|---|---|---|
| glucose concentration (M) | T = 300 K | T = 335 K | T = 375 K |
| 0 | 1.49 ± 0.11 | 1.63 ± 0.09 | 2.48 ± 0.12 |
| 0.2 | 1.69 ± 0.07 | 1.51 ± 0.09 | 2.47 ± 0.18 |
| 0.5 | 1.55 ± 0.06 | 1.38 ± 0.07 | 1.87 ± 0.13 |
| 1.5 | 1.54 ± 0.10 | 1.57 ± 0.16 | 2.87 ± 0.39 |
| 2.0 | 1.29 ± 0.07 | 2.11 ± 0.16 | 3.51 ± 0.17 |
The error bars in the table are the standard deviation of the rmsdavg value.
Figure 3.
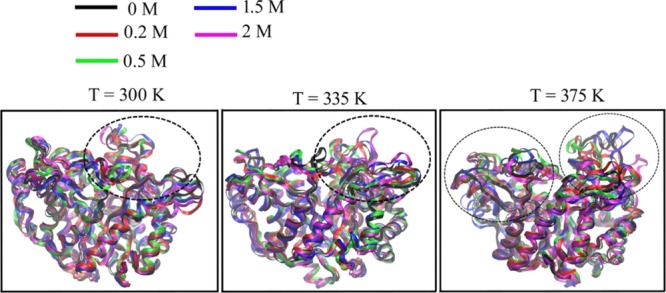
Alignment of the backbone Cα atoms of the last configuration of the enzyme after simulation in different glucose concentrations at T = 300, 335, and 375 K. The black dotted circles in the figure indicate the region (324, 325, 410, and 411 in the gatekeeper region and residue 415 at the glycone-binding site) where structural changes occur in the presence of glucose.
Significant structural changes at residues 324, 325, 410, and 411 in the gatekeeper region and residue 415 at the glycone-binding site in the active site tunnel were observed and are shown in the region within black dotted circles in Figure 3. It has been previously reported that residues in the glycone-binding and gatekeeper region may play an important role in the activity of B8CYA8.27 Thus, the residues causing structural changes in the presence of glucose may also have a significant effect on B8CYA8 activity.
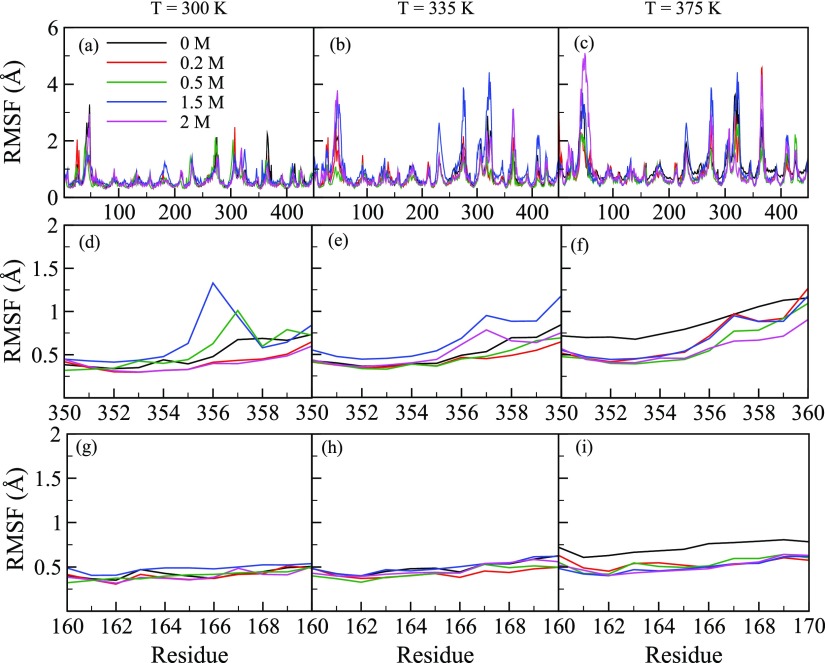
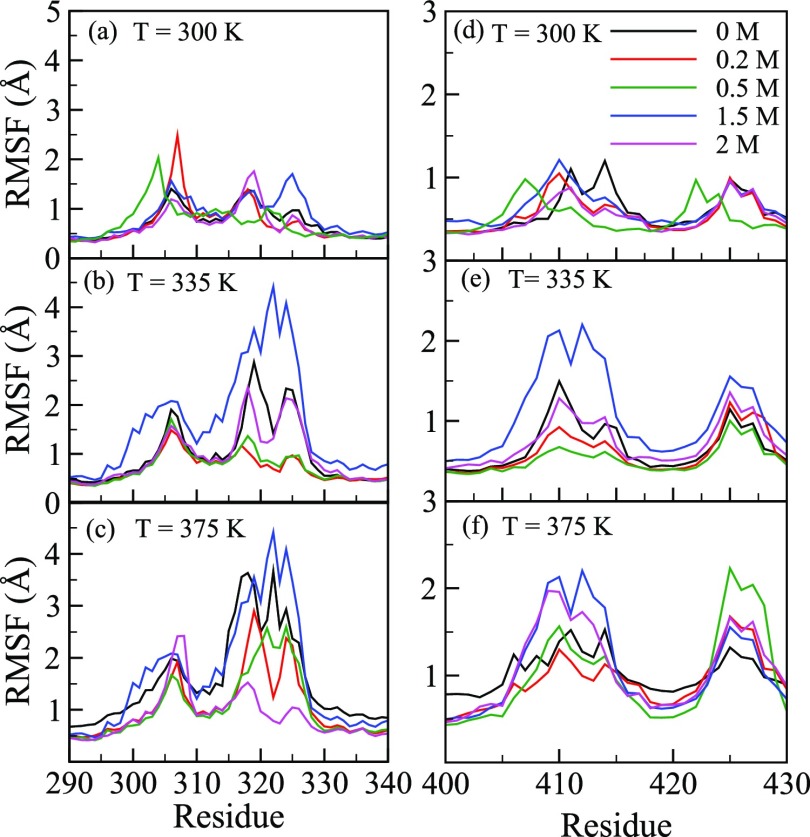
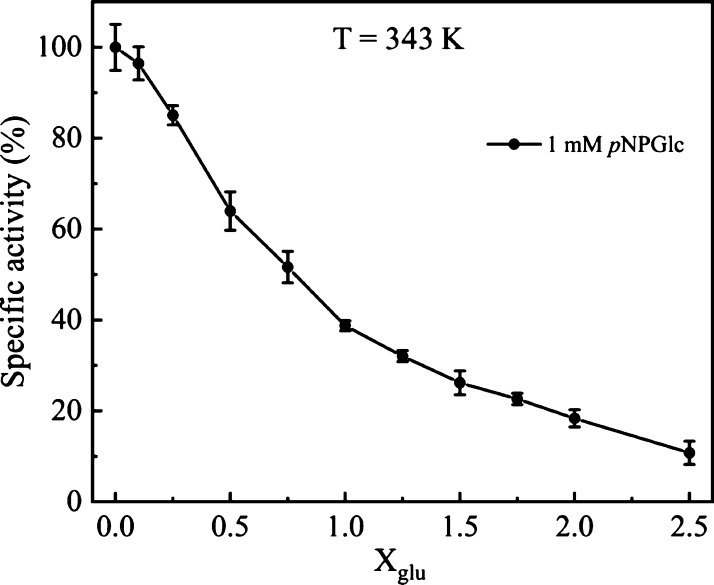
To further pinpoint the structural changes of all the residues, we first computed RMSF as a function of glucose concentration (Xglu). Figure 4a–c shows RMSF at T = 300, 335, and 375 K, respectively, in the presence of 0–2.0 M glucose. RMSF is mostly invariant with glucose concentration, except for the residues in the active site tunnel region. As structural changes around the catalytic sites (E354 and E166) are expected to play an important role in regulating protein activity, we zoomed Figure 4a–c to highlight the RMSF of residues between 160–170 and residues 350–360 containing the catalytic residues E166 and E354, respectively. These regions are shown in Figure 4d–f,g–i, respectively, with the RMSF measured at three different temperatures. We observed small changes in RMSF near the catalytic site residues in the presence of glucose. Previous reports in the literature implicate specific regions around the active site tunnel like a loop region, gatekeeper region, glycone-binding site residues, and aglycone-binding site to play an important role in regulating protein activity.27,39−44 We therefore zoomed Figure 4a–c to show RMSF of amino acid in the loop region (303–308), gatekeeper region (residues 314, 316, 324, 325, 326, 410, and 411), glycone-binding site (residues 401, 406, 408, 409, 415, and 417) and aglycone-binding site (327) in Figure 5a–f. We observed that RMSFs of all these residues are significantly altered in the presence of glucose. Fluctuations of these residues in the presence of glucose may affect substrate binding and lower enzyme activity. Indeed, the reduction of enzyme activity was confirmed upon experimental determination of B8CYA8 specific activity in the presence of 0–2.5 M glucose (Figure 6). Ongoing experimental studies have confirmed some of these results. For example, W327R mutant activity decreases sixfold compared to the wild-type enzyme (data not shown).
Figure 4.
RMSF of all B8CYA8 residues at T = (a) 300, (b) 335, and (c) 375 K in the presence of different Xglu (0 M—black, 0.2 M—red, 0.5 M—green, blue—1.5 M, purple—2 M). The RMSF of residues 350–360, near catalytic residue E354 at T = 300 (d), 335, (e) and 375 K (f) in the presence of different Xglu. The RMSF of residues 160–170 near catalytic residue E166, at T = 300 (g), 335, (h) and 375 K (i).
Figure 5.
RMSF for the residues 303–327 at T = (a) 300, (b) 335, and (c) 375 K, respectively. (d–f) show RMSF for the residues 400–417 at 300, 335, and 375 K, respectively.
Figure 6.
Effect of glucose (0–2.5 M) on the specific activity of B8CYA8 at 343 K on the substrate pNPGlc. Maximum fluctuation in the error bar is ∼15% of the specific activity.
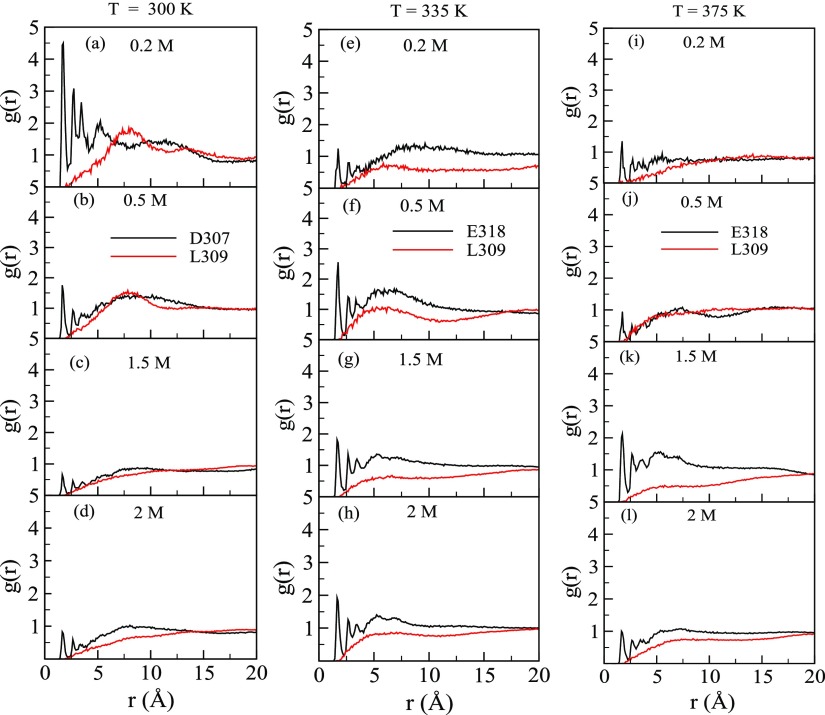
To further confirm that the fluctuations of the abovementioned amino acid residues are due to glucose, we computed the radial distribution function [g(r)], where r represents the distance between glucose and the solvent-exposed amino acid residue of the protein that can interact with glucose. We chose those solvent-exposed residues based on the maximum change in RMSF with Xglu and compared with the residues where there were no changes in the presence of glucose. At 300 K, we chose D307 and at 335 and 375 K, we chose E318 as these residues showed the maximum RMSF. We chose L309 as RMSF for this residue did not vary with glucose concentration. We measured g(r) between OH1 (see Figure S2a) of glucose, which can form hydrogen bonds with the protein, and Oδ1, Oε1, and Hδ12 of D307, E318, and L309, respectively (atom notations are defined in Figure S2b–d). Figure 7a–d,e–h,i–l shows g(r) at 300, 335, and 375 K, respectively, in the presence of different concentrations of glucose. At large distances, g(r) at different glucose concentrations do not tend to 1 (one) because the bulk density of glucose is different. At all temperatures when r ≤ 5.0 Å, we observed multiple distinct peaks in Oδ1–OH1 and Oε1–OH1g(r), whereas no such peak was observed for Hδ12–OH1g(r). The peak heights indicate that glucose accumulation near D307 and E318 is large as compared to L309. Other such chosen pairs also show similar results and confirm that the fluctuations of amino acid residues are indeed due to the presence of glucose. The relatively larger peak heights suggest that the amino acids with large RMSF interacts favorably with glucose. Moreover, glucose approaches closer to D307 and E318 (r ≤ 2.4 Å) than L309 at all temperatures and concentrations studied, suggesting the possibility of hydrogen bond interaction with D307 and E318. As the glucose concentration increases from 0.2 to 2.0 M, the peak height in g(r) mostly decreases because of the finite number of glucose molecules that can be accommodated within the steric limits imposed by D307 and E318 in the active site tunnel.
Figure 7.
(a–d) show g(r) between glucose (OH1 atom)—D307 (Oδ1 atom) and a glucose (OH1 atom)—L309 (Hδ12 atom) at 300 K in the presence of 0.2, 0.5, 1.5,, 2 M glucose. (e–h) show g(r) between glucose (OH1 atom)—E318 (Oε1 atom) and glucose (OH1 atom)—L309 (Hδ12 atom) at 335 K in the presence of 0.2, 0.5, 1.5,, 2 M glucose. (i–l) show g(r) between glucose (OH1 atom)—E318 (Oε1 atom) and a glucose (OH1 atom)—L309 (Hδ12 atom) at 375 K in the presence of 0.2, 0.5, 1.5,, 2 M glucose.
3.2.1. Broadening of the Active Site Tunnel Because of Glucose
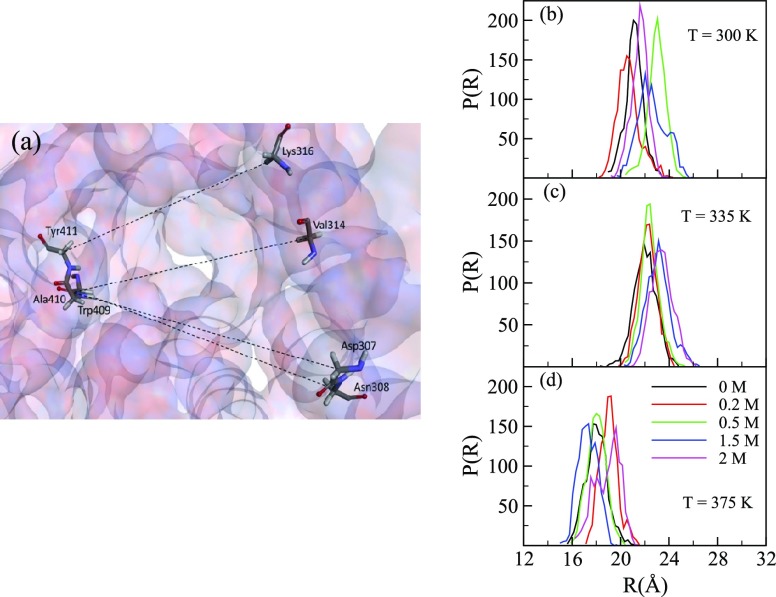
Enzyme activity typically depends on the concentration of solvent and substrate molecules near the active site residues. As the catalytic site in B8CYA8 is located at the bottom of the active site tunnel, the sterics of the tunnel entrance may affect the accessibility of substrate and solvent at the catalytic site. To measure any changes in the diameter of the active site tunnel, we measured the distances between different pairs of residues such as N308–A410, D307–A410, Y411–K316, and A410–V314 located nearly opposite to each other at the gatekeeper region near the tunnel entrance [Figure 8a]. We computed the distance distribution [P(R)], where R is the distance between the center of mass (c. o. m.) of the chosen residue pairs. The P(R) at 300, 335, and 375 K for the four pairs of residues are shown in Figures S3–S5, respectively. R varied up to 7.0 Å at 300, 335, and 375 K. Though R varies randomly with glucose concentrations at 300 K, the R increases with glucose concentrations at 335 and 375 K. In order to obtain the tunnel diameter, we computed the average distribution of the four chosen pairs of residues, as shown in Figures S3–S5. The average distributions at different temperatures are shown in Figure 8b–d. At 300 K, the tunnel diameter varies with glucose concentration from (19.0 ± 0.2) to (20.1 ± 0.4) Å whereas at 335 K, it varies from (22.0 ± 0.2) to (24.6 ± 0.3) Å. The tunnel diameter at 375 K varies from (16.5 ± 0.3) to (19.6 ± 0.3) Å. Though there is no significant change in tunnel diameter at 300 K, the diameter increased by around 2.6 Å at 335 K for Xglu = 1.5 and 2.0 M than at Xglu = 0–0.5 M, indicating a glucose-induced tunnel broadening. This increase in tunnel diameter at higher glucose concentrations may facilitate the accumulation of glucose inside the tunnel and impede substrate access to the active site. At 375 K, the diameter increased by around ∼2.7 Å for Xglu 2.0 M than at Xglu = 0–0.5 M. This tunnel broadening occurs randomly at other glucose concentrations because of large fluctuations of the gatekeeper residues.
Figure 8.
(a) Top view of the B8CYA8 active site tunnel entrance gate with Tyr409, Ala410, Tyr41, Lys316, Val314, Asp307, and Asn308 highlighted in sticks. Oxygen, nitrogen, and carbon atoms are represented by red, blue, and green colors, respectively. The average distance distributions [P(R)] across these residues were measured at T = (b) 300, (c) 335, and (d) 375 K, respectively, for different glucose concentrations.
3.2.2. Accumulation of Glucose at the Entrance and inside the Active Site Tunnel
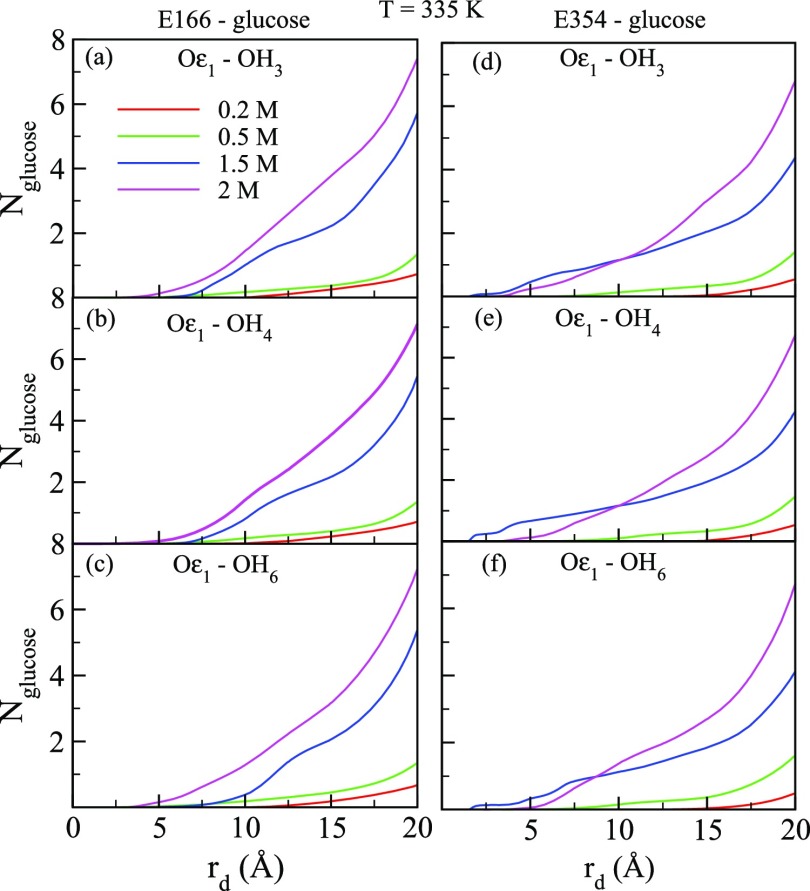
The experimentally observed inhibition of B8CYA8 activity by glucose [shown in Figure 6] may be caused by the accumulation of glucose at the gatekeeper region near the tunnel entrance and/or near the active site. To delineate between these two possibilities, we measured the number of glucose molecules (Nglucose) as a function of distance from the catalytic sites [rd] at all the glucose concentrations. To compute Nglucose, we considered three hydrogen atoms of glucose, namely HO3, HO4, and HO6 and oxygen atom (Oε1) of the catalytic site residues as shown in Figure 9. Figure 10 shows Nglucose as a function of rd at 335 K at different glucose concentrations. As the approximate length of the tunnel is 19.0 Å, we restricted rd up to 20 Å. rd = 0 Å represents the location of Oε1 atom of the two catalytic residues. We observed that at the gatekeeper region, Nglucose increases significantly with glucose concentration, in particular at Xglu = 1.5 and 2.0 M. Thus, the accumulation of glucose at the gatekeeper region probably hinders substrate entry into the tunnel. We also observed that the distance of closest approach of glucose to the catalytic residues decreases at high glucose concentrations. For example, at Xglu = 2.0 M the distance between Oε1 and hydrogen atoms of glucose is nearly 2.5 Å whereas at 0.2 M, the distance increases to around 7.5 Å. The increased presence of glucose near the active sites at high glucose concentration competes with substrate binding, hinders substrate accessibility, and inhibits B8CYA8 activity. At 300 and 375 K (shown in Figures S6 and S7), a similar trend was observed. Our studies therefore show that the presence of a high concentration of glucose induces tunnel broadening and glucose accumulation both at the catalytic site and the tunnel entrance.
Figure 9.
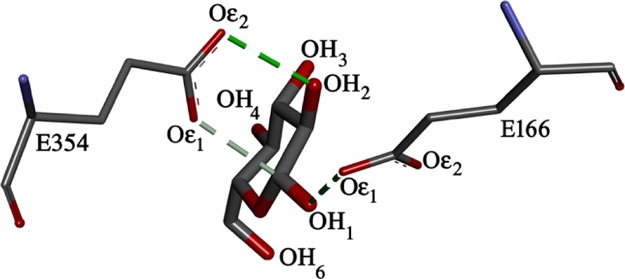
Interaction of the hydrogen atoms of glucose, OH3, OH4, and OH6 with the oxygen atom, Oε1, of the active site residues E166 and E354 of B8CYA8.
Figure 10.
(a–c) represent numbers of glucose (Nglucose) as a function of the distance (rd) between different hydroxyl groups of glucose (OH3, OH4, OH6) and the Oε1 of E166 at 335 K. (d–f) represents represent numbers of glucose (Nglucose) as a function of rd between the same hydroxyl groups as above and the Oε1 of E354 at 335 K.
3.3. Proton-Donating Capacity of the Active Site Residues in the Presence of Glucose
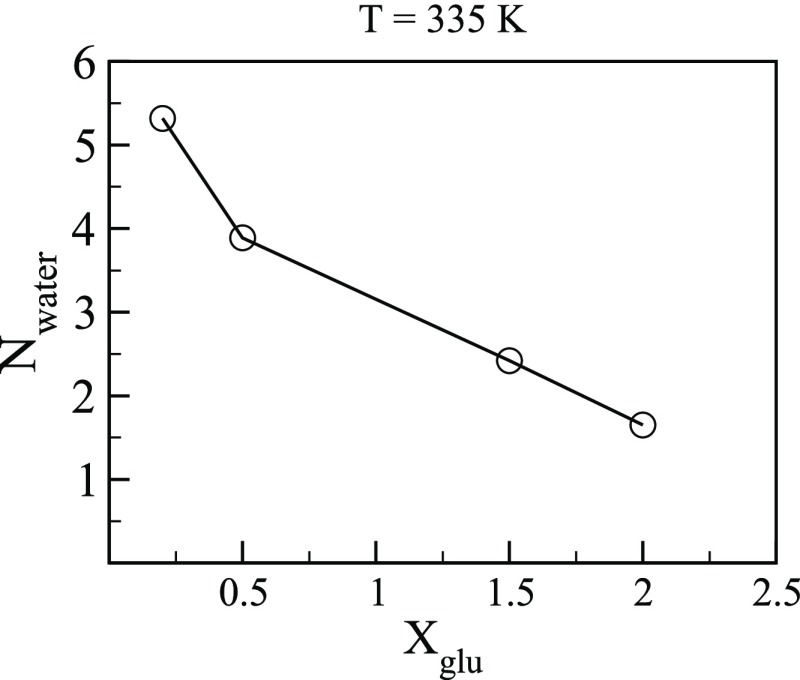
It is known that the catalytic site E166 acts as a proton donor and another catalytic residue E354 acts as a nucleophile.27 GH1 β glucosidase are typically hydrolyzed through the well-known retaining mechanism where E166 is first protonated by neighboring water and then acts as a proton donor.39 The proton-donating capacity of the catalytic residues should depend on the aqueous environment adjacent to the catalytic site. We, therefore, computed the average number of water molecules (Nwater) in the tunnel within 3.5 Å from the Oε1 atom of E166. Figure 11 shows Nwater at 335 K for different glucose concentrations. It is seen that the number of water molecules adjacent to E166 decreases significantly. The reduction of Nwater near E166 with glucose concentration may be due to increased accumulation of glucose near the catalytic site (see Figure 10) at a high glucose concentration. The fewer number of water molecules at high glucose concentrations might decrease the proton-donating ability of the catalytic site (E166) and/or affect the release of glucose from the intermediate state by the nucleophilic water and lead to decrease in specific activity of B8CYA8.
Figure 11.
Average number of water molecules (Nwater) in the tunnel within 3.5 Å from the Oε1 atom of E166 with the glucose concentration.
4. Conclusions
MD simulations at different temperatures and glucose concentrations assist us in understanding the effect of glucose on B8CYA8 activity. At high glucose concentrations, we observed significant fluctuations at residues corresponding to the loop region (303–308), gatekeeper residues (314, 316, 324, 325, 326, 410, and 411), aglycone-binding site residue (327), and glycone-binding site residues (401, 406, 408, 409, 415, and 417). The experimentally observed inhibition of B8CYA8 activity in the presence of increasing concentrations of glucose may be due to the effect of these fluctuations on substrate binding and enzyme activity. We found an increase in glucose accumulation at the tunnel entrance and near the active site which may compete with substrate accessibility and binding to the catalytic site. At 335 K when the enzyme shows high activity, glucose-induced tunnel broadening was observed that may further facilitate the accumulation of glucose at the tunnel entrance. Furthermore, in the vicinity of catalytic residues, the decrease in the number of water molecules in the presence of glucose could reduce proton donation to the substrate and inhibit enzyme hydrolytic activity. Our results implicate the role of the active site tunnel in maintaining glucose tolerance of B8CYA8 and argues against the role of any single residue. These results may guide a closer examination of the β-glucosidase active site tunnel toward understanding the role of protein–solvent interaction in the regulation of polysaccharide hydrolysis and engineering of improved enzymes.
Acknowledgments
S.K. would like to thank Indian Institute Science Education Research Kolkata (IISER Kolkata) for fellowship and P.K.G. thanks CSIR (project number: 01(2558)/12/EMR-II) for financial support. The research in the S.D. is supported in part by Energy Bioscience Overseas Fellowship, Department of Biotechnology, Government of India, BT/NBDB/22/06/2011 and Science & Engineering Research Board (SERB), Government of India, EMR/2016/003705. S.K.S. is supported by a Senior Research Fellowship from CSIR, Govt. of India.
Supporting Information Available
The Supporting Information is available free of charge on the ACS Publications website at DOI: 10.1021/acsomega.9b00509.
Glycone, aglycone, and gate-keeper residues of B8CYA8; B8CYA8 structures for different glucose concentrations at 335 K; atom notation for glucose, D307, E318, and L309 amino acids; distance distribution [P(R)] for chosen pair of amino acids at 300, 335, and 375 K; and numbers of glucose (Nglucose) as a function of the distance (rd) between different hydroxyl groups of glucose (OH3, OH4, OH6) and the Oε1 of E166 at 300 and 375 K (PDF)
The authors declare no competing financial interest.
Supplementary Material
References
- Datta S. Recent Strategies to Overexpress and Engineer Cellulases for Biomass Degradation. Curr. Metabol. 2016, 4, 14–22. 10.2174/2213235x03666150702155845. [DOI] [Google Scholar]
- Datta S.; Sapra R.. Cellulases and Hemicellulases for Biomass Degradation: An Introduction. Chemical and Biochemical Catalysis for Next Generation Biofuels; The Royal Society of Chemistry, 2011; Chapter 6, pp 115–135. [Google Scholar]
- Harris P. V.; Welner D.; McFarland K. C.; Re E.; Navarro Poulsen J.-C.; Brown K.; Salbo R.; Ding H.; Vlasenko E.; Merino S.; et al. Stimulation of Lignocellulosic Biomass Hydrolysis by Proteins of Glycoside Hydrolase Family 61: Structure and Function of a Large, Enigmatic Family. Biochemistry 2010, 49, 3305–3316. 10.1021/bi100009p. [DOI] [PubMed] [Google Scholar]
- Payne C. M.; Knott B. C.; Mayes H. B.; Hansson H.; Himmel M. E.; Sandgren M.; Ståhlberg J.; Beckham G. T. Fungal Cellulases. Chem. Rev. 2015, 115, 1308–1448. 10.1021/cr500351c. [DOI] [PubMed] [Google Scholar]
- Zhang B.; Qiangba Y.; Shang P.; Wang Z.; Ma J.; Wang L.; Zhang H. A Comprehensive MicroRNA Expression Profile Related to Hypoxia Adaptation in the Tibetan Pig. PLoS One 2015, 10, e0143260 10.1371/journal.pone.0142107. [DOI] [PMC free article] [PubMed] [Google Scholar]
- Goswami S.; Gupta N.; Datta S. Using the β-Glucosidase Catalyzed Reaction Product Glucose to Improve the Ionic Liquid Tolerance of β-Glucosidases. Biotechnol. Biofuels 2016, 9, 72. 10.1186/s13068-016-0484-3. [DOI] [PMC free article] [PubMed] [Google Scholar]
- Sørensen A.; Lübeck M.; Lübeck P.; Ahring B.; Sørensen A.; Lübeck M.; Lübeck P. S.; Ahring B. K. Fungal β-Glucosidases: A Bottleneck in Industrial Use of Lignocellulosic Materials. Biomolecules 2013, 3, 612–631. 10.3390/biom3030612. [DOI] [PMC free article] [PubMed] [Google Scholar]
- Sinha S. K.; Datta S. β-Glucosidase from the hyperthermophilic archaeon Thermococcus sp. is a salt-tolerant enzyme that is stabilized by its reaction product glucose. Appl. Microbiol. Biotechnol. 2016, 100, 8399–8409. 10.1007/s00253-016-7601-x. [DOI] [PubMed] [Google Scholar]
- Goswami S.; Das S.; Datta S. Understanding the role of residues around the active site tunnel towards generating a glucose-tolerant β-glucosidase from Agrobacterium tumefaciens 5A. Protein Eng. Des. Sel. 2017, 30, 523–530. 10.1093/protein/gzx039. [DOI] [PubMed] [Google Scholar]
- Nascimento C. V.; Souza F. H. M.; Masui D. C.; Leone F. A.; Peralta R. M.; Jorge J. A.; Furriel R. P. M. Purification and biochemical properties of a glucose-stimulated β-D-glucosidase produced by Humicola grisea var. thermoidea grown on sugarcane bagasse. J. Microbiol. 2010, 48, 53–62. 10.1007/s12275-009-0159-x. [DOI] [PubMed] [Google Scholar]
- Souza F. H. M.; Inocentes R. F.; Ward R. J.; Jorge J. A.; Furriel R. P. M. Glucose and xylose stimulation of a β-glucosidase from the thermophilic fungus Humicola insolens: A kinetic and biophysical study. J. Mol. Catal. B Enzym. 2013, 94, 119–128. 10.1016/j.molcatb.2013.05.012. [DOI] [Google Scholar]
- Souza F. H. M.; Meleiro L. P.; Machado C. B.; Zimbardi A. L. R. L.; Maldonado R. F.; Souza T. A. C. B.; Masui D. C.; Murakami M. T.; Jorge J. A.; Ward R. J.; et al. Gene cloning, expression and biochemical characterization of a glucose- and xylose-stimulated β-glucosidase from Humicola insolens RP86. J. Mol. Catal. B Enzym. 2014, 106, 1–10. 10.1016/j.molcatb.2014.04.007. [DOI] [Google Scholar]
- Jaeger V. W.; Pfaendtner J. Structure, Dynamics, and Activity of Xylanase Solvated in Binary Mixtures of Ionic Liquid and Water. ACS Chem. Biol. 2013, 8, 1179–1186. 10.1021/cb3006837. [DOI] [PubMed] [Google Scholar]
- Jaeger V.; Burney P.; Pfaendtner J. Comparison of Three Ionic Liquid-Tolerant Cellulases by Molecular Dynamics. Biophys. J. 2015, 108, 880–892. 10.1016/j.bpj.2014.12.043. [DOI] [PMC free article] [PubMed] [Google Scholar]
- Schutt T. C.; Bharadwaj V. S.; Granum D. M.; Maupin C. M. The Impact of Active Site Protonation on Substrate Ring Conformation in Melanocarpus Albomyces Cellobiohydrolase Cel7B. Phys. Chem. Chem. Phys. 2015, 17, 16947–16958. 10.1039/c5cp01801c. [DOI] [PubMed] [Google Scholar]
- Burney P. R.; Pfaendtner J. Structural and Dynamic Features of Candida Rugosa Lipase 1 in Water, Octane, Toluene, and Ionic Liquids BMIM-PF6 and BMIM-NO3. J. Phys. Chem. B 2013, 117, 2662–2670. 10.1021/jp312299d. [DOI] [PubMed] [Google Scholar]
- Bernardi R. C.; Cann I.; Schulten K. Molecular Dynamics Study of Enhanced Man5B Enzymatic Activity. Biotechnol. Biofuels 2014, 7, 83. 10.1186/1754-6834-7-83. [DOI] [PMC free article] [PubMed] [Google Scholar]
- Flannelly D. F.; Aoki T. G.; Aristilde L. Short-time dynamics of pH-dependent conformation and substrate binding in the active site of beta-glucosidases: A computational study. J. Struct. Biol. 2015, 191, 352–364. 10.1016/j.jsb.2015.07.002. [DOI] [PubMed] [Google Scholar]
- Granum D. M.; Vyas S.; Sambasivarao S. V.; Maupin C. M. Computational Evaluations of Charge Coupling and Hydrogen Bonding in the Active Site of a Family 7 Cellobiohydrolase. J. Phys. Chem. B 2014, 118, 434–448. 10.1021/jp408536s. [DOI] [PubMed] [Google Scholar]
- Knott B. C.; Crowley M. F.; Himmel M. E.; Ståhlberg J.; Beckham G. T. Carbohydrate-Protein Interactions That Drive Processive Polysaccharide Translocation in Enzymes Revealed from a Computational Study of Cellobiohydrolase Processivity. J. Am. Chem. Soc. 2014, 136, 8810–8819. 10.1021/ja504074g. [DOI] [PubMed] [Google Scholar]
- Badieyan S.; Bevan D. R.; Zhang C. A Salt-Bridge Controlled by Ligand Binding Modulates the Hydrolysis Reaction in a GH5 Endoglucanase. Protein Eng. Des. Sel. 2012, 25, 223–233. 10.1093/protein/gzs010. [DOI] [PubMed] [Google Scholar]
- Zhou J.-M.; Zhou J.-H.; Meng Y.; Chen M.-B. Molecular Dynamics Simulation of Iminosugar Inhibitor–Glycosidase Complex: Insight into the Binding Mechanism of 1-Deoxynojirimycin and Isofagomine toward β-Glucosidase. J. Chem. Theory Comput. 2006, 2, 157–165. 10.1021/ct050168g. [DOI] [PubMed] [Google Scholar]
- Yang Y.; Zhang X.; Yin Q.; Fang W.; Fang Z.; Wang X.; Zhang X.; Xiao Y. A Mechanism of Glucose Tolerance and Stimulation of GH1 β-Glucosidases. Sci. Rep. 2015, 5, 17296. 10.1038/srep17296. [DOI] [PMC free article] [PubMed] [Google Scholar]
- Sinha S. K.; Goswami S.; Das S.; Datta S. Exploiting non-conserved residues to improve activity and stability of Halothermothrix orenii β-glucosidase. Appl. Microbiol. Biotechnol. 2017, 101, 1455–1463. 10.1007/s00253-016-7904-y. [DOI] [PubMed] [Google Scholar]
- Hassan N.; Nguyen T.-H.; Intanon M.; Kori L. D.; Patel B. K. C.; Haltrich D.; Divne C.; Tan T. C. Biochemical and structural characterization of a thermostable β-glucosidase from Halothermothrix orenii for galacto-oligosaccharide synthesis. Appl. Microbiol. Biotechnol. 2015, 99, 1731–1744. 10.1007/s00253-014-6015-x. [DOI] [PMC free article] [PubMed] [Google Scholar]
- Mukherjee I.; Sinha S. K.; Datta S.; De P. Recyclable Thermoresponsive Polymer−β-Glucosidase Conjugate with Intact Hydrolysis Activity. Biomacromolecules 2018, 19, 2286–2293. 10.1021/acs.biomac.8b00258. [DOI] [PubMed] [Google Scholar]
- Jorgensen W. L.; Chandrasekhar J.; Madura J. D.; Impey R. W.; Klein M. L. Comparison of Simple Potential Functions for Simulating Liquid Water. J. Chem. Phys. 1983, 79, 926–935. 10.1063/1.445869. [DOI] [Google Scholar]
- Martínez L.; Andrade R.; Birgin E. G.; Martínez J. M. PACKMOL: A Package for Building Initial Configurations for Molecular Dynamics Simulations. J. Comput. Chem. 2009, 30, 2157–2164. 10.1002/jcc.21224. [DOI] [PubMed] [Google Scholar]
- Kalé L.; Skeel R.; Bhandarkar M.; Brunner R.; Gursoy A.; Neal K.; Phillips J.; Shinozaki A.; Krishnan V.; Schulten K. NAMD2: Greater scalability for parallel molecular dynamics. J. Comput. Phys. 1999, 151, 283–312. 10.1006/jcph.1999.6201. [DOI] [Google Scholar]
- MacKerell A. D.; Bashford D.; Bellott M.; Dunbrack R. L.; Evanseck J. D.; Field M. J.; Fischer S.; Gao J.; Guo H.; Ha S.; et al. All-Atom Empirical Potential for Molecular Modeling and Dynamics Studies of Proteins†. J. Phys. Chem. B 1998, 102, 3586–3616. 10.1021/jp973084f. [DOI] [PubMed] [Google Scholar]
- Phillips J. C.; Braun R.; Wang W.; Gumbart J.; Tajkhorshid E.; Villa E.; Chipot C.; Skeel R. D.; Kalé L.; Schulten K. Scalable Molecular Dynamics with NAMD. J. Comput. Chem. 2005, 26, 1781–1802. 10.1002/jcc.20289. [DOI] [PMC free article] [PubMed] [Google Scholar]
- Brooks B. R.; Bruccoleri R. E.; Olafson B. D.; States D. J.; Swaminathan S.; Karplus M. CHARMM: A Program for Macromolecular Energy, Minimization, and Dynamics Calculations. J. Comput. Chem. 1983, 4, 187–217. 10.1002/jcc.540040211. [DOI] [Google Scholar]
- Martyna G. J.; Klein M. L.; Tuckerman M. Nosé-Hoover chains: The canonical ensemble via continuous dynamics. J. Chem. Phys. 1992, 97, 2635–2643. 10.1063/1.463940. [DOI] [Google Scholar]
- Evans D. J.; Holian B. L. The Nose-Hoover thermostat. J. Chem. Phys. 1985, 83, 4069–4074. 10.1063/1.449071. [DOI] [Google Scholar]
- Darden T.; York D.; Pedersen L. Particle mesh Ewald: An N·log(N) method for Ewald sums in large systems. J. Chem. Phys. 1993, 98, 10089. 10.1063/1.464397. [DOI] [Google Scholar]
- Martyna G. J.; Tobias D. J.; Klein M. L. Constant Pressure Molecular Dynamics Algorithms. J. Chem. Phys. 1994, 101, 4177–4189. 10.1063/1.467468. [DOI] [Google Scholar]
- Feller S. E.; Zhang Y.; Pastor R. W.; Brooks B. R. Constant Pressure Molecular Dynamics Simulation: The Langevin Piston Method. J. Chem. Phys. 1995, 103, 4613–4621. 10.1063/1.470648. [DOI] [Google Scholar]
- Lian P.; Yuan C.; Xu Q.; Fu W. Thermostability Mechanism for the Hyperthermophilicity of Extremophile Cellulase TmCel12A: Implied from Molecular Dynamics Simulation. J. Phys. Chem. B 2016, 120, 7346–7352. 10.1021/acs.jpcb.6b03782. [DOI] [PubMed] [Google Scholar]
- Badieyan S.; Bevan D. R.; Zhang C. Probing the Active Site Chemistry of β-Glucosidases along the Hydrolysis Reaction Pathway. Biochemistry 2012, 51, 8907–8918. 10.1021/bi300675x. [DOI] [PubMed] [Google Scholar]
- de Giuseppe P. O.; de Arruda Campos Brasil Souza T.; Souza F. H. M.; Zanphorlin L. M.; Machado C. B.; Ward R. J.; Jorge J. A.; Furriel R. d. P. M.; Murakami M. T. Structural basis for glucose tolerance in GH1 β-glucosidases. Acta Crystallogr. Sect. D Biol. Crystallogr. 2014, 70, 1631–1639. 10.1107/s1399004714006920. [DOI] [PubMed] [Google Scholar]
- Brodkin H. R.; Novak W. R. P.; Milne A. C.; D’Aquino J. A.; Karabacak N. M.; Goldberg I. G.; Agar J. N.; Payne M. S.; Petsko G. A.; Ondrechen M. J.; et al. Evidence of the Participation of Remote Residues in the Catalytic Activity of Co-Type Nitrile Hydratase fromPseudomonas putida. Biochemistry 2011, 50, 4923–4935. 10.1021/bi101761e. [DOI] [PMC free article] [PubMed] [Google Scholar]
- Taylor C. B.; Payne C. M.; Himmel M. E.; Crowley M. F.; McCabe C.; Beckham G. T. Binding Site Dynamics and Aromatic-Carbohydrate Interactions in Processive and Non-Processive Family 7 Glycoside Hydrolases. J. Phys. Chem. B 2013, 117, 4924–4933. 10.1021/jp401410h. [DOI] [PubMed] [Google Scholar]
- Sidhu G.; Withers S. G.; Nguyen N. T.; McIntosh L. P.; Ziser L.; Brayer G. D. Sugar Ring Distortion in the Glycosyl-Enzyme Intermediate of a Family G/11 Xylanase. Biochemistry 1999, 38, 5346–5354. 10.1021/bi982946f. [DOI] [PubMed] [Google Scholar]
- Parsiegla G.; Reverbel-Leroy C.; Tardif C.; Belaich J. P.; Driguez H.; Haser R. Crystal Structures of the Cellulase Cel48F in Complex with Inhibitors and Substrates Give Insights into Its Processive Action. Biochemistry 2000, 39, 11238–11246. 10.1021/bi001139p. [DOI] [PubMed] [Google Scholar]
Associated Data
This section collects any data citations, data availability statements, or supplementary materials included in this article.


