Abstract
Poly(vinyl alcohol) (PVA)–ZnS composite films were prepared by varying the composition of PVA ranging from 1–5 wt % through a simple solvent casting method. The photocatalytic enactment of the composites was evaluated along with the investigations of their photoluminescence (PL), optical transparency, morphology, and thermal properties. The firm interaction between the ZnS and PVA was confirmed by Fourier transform infrared, UV–vis, and PL spectroscopies. PVA–ZnS composites showed enhanced luminescence property than PVA. The composites exhibited very good optical transparency regardless of the amount of PVA addition. The thermogravimetric analysis data indeed exhibited better thermal stability of the composites. The glass transition temperature (Tg), melting temperature (Tm), enthalpy of melting (ΔHm), and crystallinity were evaluated for such composites. The composites demonstrated morphological variations depending on the amount of PVA addition, although the particle size of ZnS remained similar in the nanometer range (50–120 nm) for all composite samples. The prepared composite films exhibited superior photocatalytic performance in the degradation of methylene blue compared with the bare ZnS and PVA. This study may give a new insight into the fabrication of PVA–ZnS photocatalysts for the treatment of organic pollutants.
1. Introduction
The presence of harmful organic dyes in water affects the aquatic environment and human health and decreases the drinking water quality. To alleviate this problem, several methods and materials have been employed to remove organic dyes from the wastewater.1−4 Among the several methods, photocatalysis is considered to be one of the most promising technology because of its simplicity, low cost, and relatively high efficiency.1,5 In this context, the design and fabrication of new materials similar to polymer composites for the removal of organic dyes is a matter of great practical importance. Polymers consisting of inorganic nanoparticles embedded in a transparent host matrix have the ability to fabricate unique properties such as optical, thermal, and high dielectric constant properties for precise applications such as sensors, photoelectric conversion, and photocatalysts.6−8 Among the organic polymers, polyvinyl alcohol (PVA) has been used extensively for the preparation of nanocomposites because of its easy processability, an extremely hydrophilic nature, good film-forming capability, and optical transparency. Besides, the solubility of PVA in an aqueous medium makes the incorporated nanoparticles be easily dispersed in the solvent, thus making the nanocomposite preparation almost nontoxic. PVA was widely employed as a host matrix for various nanofillers.9,10 PVA was successfully used as a suitable polymeric substrate for the photocatalytic wastewater treatment.11 The synthesis of PVA in the film form with promising functionalities can be easily performed by a simple solvent casting method.12 Such a synthesis technique is very useful for the introduction of various dopant materials into the PVA matrix to improvise properties such as optical, morphological, thermal, photoluminescence (PL), and photocatalytic activity. So far, different photocatalytic materials including semiconductors such as TiO2, ZnO, AgBr, and AgCO3 have been efficiently used to degrade organic dyes.13−15 Among the semiconductors, ZnS is a very promising material and it has been applied as a compelling catalyst for the photodegradation of organic dyes.16 Further, ZnS has a wide band gap (3.91 eV) and has a very good photocarrier generation capability. Such properties of ZnS may improve the efficiency of a catalyst when it forms composites with polymers. Relating to other applications of ZnS, it has already been used in the field of electroluminescence, biodevices, optical coatings, light-emitting diodes, photoconductors, and so on.17
Thus, the addition of ZnS into a host material similar to PVA can increase the properties such as morphological, thermal, optical, luminescence, and photocatalytic activity of newly formed composites than its polymer. Additionally, the presence of ZnS on the PVA as a host matrix may have the ability to inhibit the recombination of electron–hole pairs which turn to be a good photocatalyst as a composite.18 However, only very few research studies can be seen in the literature, where ZnS was used with PVA to modify the mechanical, structural, and optical properties without demonstrating any applications.19,20 In this context, the addition of ZnS onto PVA to prepare PVA–ZnS composites may be interesting for its dye degradation properties to use in wastewater treatment along with improvising properties such as thermal, PL, optical transparency, morphological, and their interaction study.
To the best of our knowledge, there have been no reports on the synthesis of PVA–ZnS composite films by a simple solvent casting method for photocatalytic dye degradation in wastewater treatment application. The present study reports the photodegradation of methylene blue (MB) as a model pollutant under solar illumination. Further, there has been no report on the modification of luminescence, optical transparency, and thermal properties along with the morphological variations of PVA with the help of ZnS. Here, we report a simple solvent casting method for the preparation PVA–ZnS nanocomposite films at room temperature, and their photocatalytic activity toward the degradation of MB under sunlight irradiation for wastewater treatment application. The enhanced PL, optical transparency, and thermal properties of the prepared composites along with their morphological variations have also been reported in the present work.
2. Results and Discussion
2.1. FTIR Spectra and Analysis
The incorporation of ZnS into PVA matrix can be attributed with Fourier transform infrared (FTIR) spectroscopic analysis of the PVA and PVA–ZnS composite samples, as presented in Figure 1. The detailed labeling of the peaks of PVA and a composite sample (for instance, PVA–ZnS-3) are shown in Figure S1. A broad and strong absorption peak observed between 3000 and 3600 cm–1, peaking at 3385 cm–1, is the characteristic of the −OH functional group present in PVA. Such a vibrational peak originates from the intermolecular and intramolecular hydrogen bonds in PVA. The peak observed at 2942 cm–1 corresponds to the C–H stretching vibrations of −CH2– skeleton. The C=C stretching and C=O stretching mode peaks are identified at 1734 and 1654 cm–1, respectively. A strong band at 1093 cm–1 is attributed to the stretching vibration of the oxygen-containing functional group C–O in the C–O–H groups. The bands at 1437 and 1377 cm–1 are assigned to the bending and wagging vibrations of CH2 groups, respectively. Thus, all of the characteristic peaks of PVA (Table 1) match well with the previous reports.6,21 Similar characteristic peaks of PVA is also visible for all of the PVA–ZnS composite samples; however, the frequency of the symmetrical stretching vibration of the −OH group shifted to a higher wave number (3401–3414 cm–1) than that of the PVA film. Such a shifting indicates the insertion of ZnS particle into PVA which had a significant influence on the bonding interactions within the PVA structural framework.22 The possible mode of interaction between ZnS and polymer can be the hydrogen bonding between −OH group of PVA and the sulfur (S) in ZnS. The probable hydrogen bonding pattern is shown in Figure S2. The modification of spectra of the symmetrical stretching vibration of hydroxyl group for all PVA–ZnS composite samples shifted to a higher wave number (3401–3414 cm–1) than that of the PVA film (Figure 1). The position appears to be shifted because of the slight elongation of the O–H bond because of its hydrogen bond formation with the sulfur of ZnS. All of these results designate the incorporation of ZnS in the PVA structure.
Figure 1.
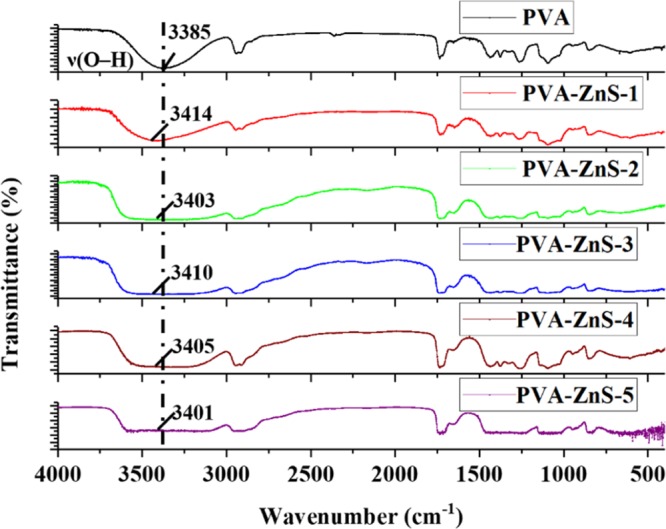
FTIR spectra of PVA and PVA–ZnS composite films.
Table 1. Characteristic FTIR Peaks of PVA and PVA–ZnS Composite Films.
| peak values
of the corresponding samples (cm–1) |
||||||
|---|---|---|---|---|---|---|
| peak designation | PVA | PVA–ZnS-1 | PVA–ZnS-2 | PVA–ZnS-3 | PVA–ZnS-4 | PVA–ZnS-5 |
| O–H stretching | 3385 | 3414 | 3403 | 3410 | 3405 | 3401 |
| C–H stretching | 2942 | 2944 | 2946 | 2944 | 2943 | 2943 |
| C=C stretching | 1734 | 1731 | 1734 | 1735 | 1734 | 1733 |
| C=O stretching | 1654 | 1647 | 1653 | 1654 | 1654 | 1652 |
| C–O stretching | 1093 | 1095 | 1093 | 1095 | 1096 | 1093 |
| CH2 bending | 1437 | 1432 | 1435 | 1436 | 1436 | 1435 |
| CH2 wagging | 1377 | 1376 | 1374 | 1377 | 1376 | 1378 |
2.2. UV–Vis and XRD Studies
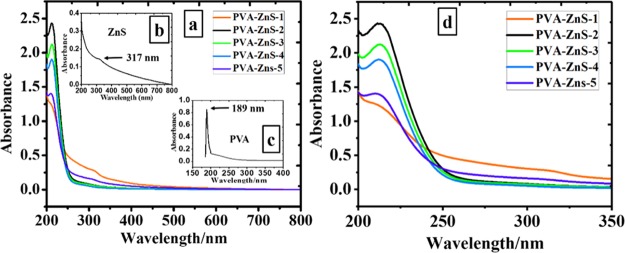
The interaction of ZnS with PVA in PVA–ZnS composite films and their corresponding band gap were computed through UV–vis studies (Figure 2). The composite films demonstrate absorption band around at 212 nm, whereas PVA shows its characteristic band at 189 nm.6 Such differences of the absorption band between PVA and its composite with ZnS can be attributed to the bathochromic shift or red shift of PVA and imply the strong interactions between them. Similar absorption peaks because of the interaction of PVA with other inorganic materials were also previously observed in ref (23). Relating to the band gap calculation of PVA–ZnS composite films and bare ZnS, the absorption maxima were identified in the range of 211.5–213 and 215 nm, respectively. The band gap of all samples was computed using the following equation
where E, h, c, and λ denote the band gap energy, Planck’s constant, the velocity of light, and the corresponding wavelength of absorption maxima, respectively.
Figure 2.
UV–vis spectra of (a) PVA–ZnS composite films; inset (b) ZnS and (c) PVA film. (d) Corresponding magnified spectra of PVA–ZnS composites in the wavelength range between 200 and 350 nm.
The calculated band gap of the composite samples was 5.82–5.86 eV, whereas the value for ZnS is 3.91 eV. Such a band gap of ZnS corresponds well with the literature reported value.24 It can be assumed from the band gap of composite samples that the interaction of ZnS with PVA had a considerable effect on the absorption of light. The absorption maxima of PVA–ZnS composite films increase and consequently their band gap upturns. For composite films, the increase of absorption maxima to the visible region may be attributed to the increment of light absorption by ZnS.25 Such a phenomenon directs to the assumption that the inducement of ZnS may help to improve the photodegradation of capability of PVA–ZnS composite films than PVA only.
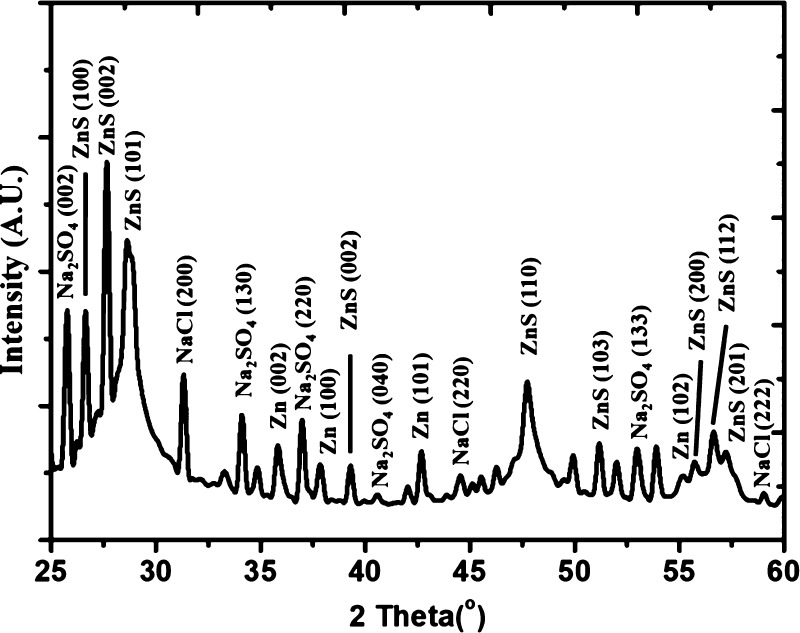
To determine the crystal structure, the X-ray diffraction (XRD) analysis of the synthesized ZnS was conducted, and the corresponding XRD pattern is shown in Figure 3. The crystal structure of the ZnS was found to be matching to the reported ZnS (JCPDS card no 36-1450). The diffraction planes (100), (002), (101), (102), (110), (103), (200), (112), and (201) correspond to hexagonal crystalline ZnS.26 The cell parameters and the volume obtained from the XRD pattern of the ZnS samples are a = 3.984(1) Å, b = 6.264(2) Å, and V = 79.684 Å3. Thus, the component phase of the sample was resolute to be wurtzite-type ZnS with a trace amount of Zn, NaCl, and Na2SO4. Such a hexagonal structure of ZnS corresponds well with its calculated band gap.27
Figure 3.
XRD pattern of synthesized ZnS sample.
2.3. PL Properties
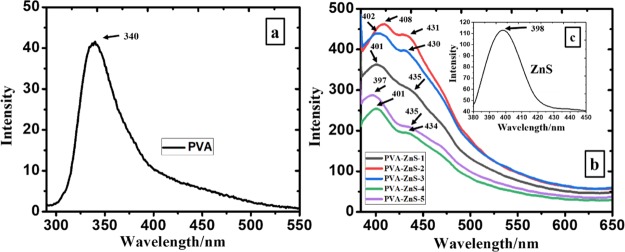
Further evidence of the interaction between ZnS and PVA can be ascertained by PL measurements. Figure 4 shows the room-temperature PL spectra of PVA and PVA–ZnS composite films at an excitation wavelength of 350 nm. PVA exhibited a sharp PL emission in the visible region of 320–400 nm, peaking at 340 nm [Figure 4, inset (a)]. Such an emission can be attributed to the π* → n electronic transition of the −OH groups for isotactic, syndiotactic, and atactic modes of PVA, which likely depends on their spatial arrangement within the PVA molecules.23,28 The emission spectrum of ZnS appears as broadened and centered around 398 nm as can be seen from the inset (b) of Figure 4. This emission originates from the sulfur vacancies located at the surface of ZnS.29 Similar emission of ZnS because of surface defect states such as sulfur vacancies was reported by other researchers.30,31 In the case of PVA–ZnS composites, two prominent peaks observed at 397–408 and 430–435 nm can be attributed to the transitions in syndiotactic (s) and isotactic (i) PVA, respectively. Thus, a red-shifting of peak emission is observed for all composite samples compared to PVA, which reveals broadband blue emission. These results evidenced the incorporation of ZnS into PVA, and such a presence of ZnS comprehensively reorder the delocalized n-electrons of −OH groups in the PVA backbone. These results are consistent with the previous reports.6,22 The observed blue emission in the composites could be related to the recombination process of electrons between the sulfur vacancy donor level and the holes trapped at the zinc vacancy acceptor level.32 Such donor–acceptor-type materials (ZnS) also effect on the Stokes shift of PVA–ZnS composites. It was found that the Stokes shifts of PVA and PVA–ZnS composites are 151 and 185.5–196 nm, respectively. Similar larger Stokes shift of the PVA and PVA-based materials were observed and explained in ref (33). Furthermore, looking at the PL spectra, it can be seen that the intensity increases for all composite samples compared to PVA (Figure 4). Such a raise could be because of the fact that the n-type ZnS can trap electrons as well as permit more holes to recombine through the interface of PVA and ZnS. From the above results, it is possible to speculate that the prepared PVA–ZnS composite films can be a promising material for light-emitting diode and solar cell.
Figure 4.
PL spectra of (a) PVA, (b) PVA–ZnS composite films, and ZnS (inset c).
2.4. Optical Transparency
The optical transparency of the PVA–ZnS composite films was assessed from their UV–vis spectra (see Figure 2). To understand the optical transmission, the samples were investigated in the wavelength range of 200–800 nm. It was found that the absorbance started to become zero after 400 nm (Figure 2). These results reveal a very good optical transparency for all composites in the visible light range.34 Such a high clearness may allow the PVA–ZnS composite films to be used as polarizer films in electrical devices.
To deepen the study of optical transparency, the optical photograph of all of the composite films was captured, as shown in Figure 5. The film thickness is around 140 μm and was positioned on the color characters printed on a paper. It can be seen that the composite films are very good andf optically transparent regardless of the amount (wt %) of PVA addition.
Figure 5.
Optical images of the PVA–ZnS composite films. Panels a–e correspond to the composite samples synthesized at different additions of PVA (1–5 wt %).
2.5. Thermal Properties
The thermal degradation possessions of PVA and PVA–ZnS composites were determined using thermogravimetric analysis (TGA), as shown in Figure 6. Both PVA and PVA–ZnS composites exhibited a four-stage decomposition process, resulting in four separate stages of weight loss under the nitrogen atmosphere (Table 2). The initial degradation was identified at 27–144 and 25–174 °C, and their corresponding weight losses were observed at 7.3 and 8.1–12.6% for PVA and composite samples, respectively. Such a loss is attributable to the evaporation of moisture and partial dehydration of PVA chains.35
Figure 6.
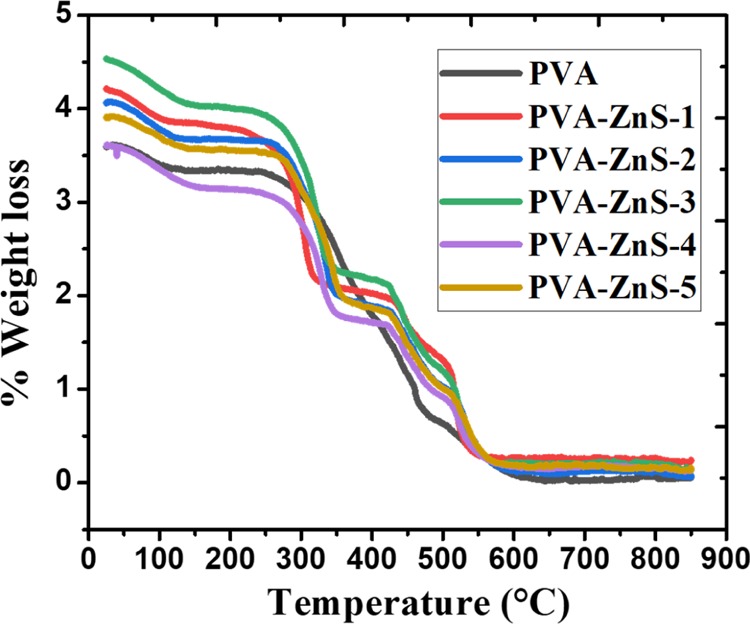
TGA curves of PVA and PVA–ZnS composite films.
Table 2. Thermal Analysis of PVA and PVA–ZnS Composite Films Obtained from TGAa.
| temperature (T) and
% of weight loss (WL) at three decomposition steps |
|||||||||
|---|---|---|---|---|---|---|---|---|---|
| step 1 |
step 2 |
step 3 |
step 4 |
||||||
| samples | T (°C) | WL (%) | T (°C) | WL (%) | T (°C) | WL (%) | T (°C) | WL (%) | residual weight (%) |
| PVA | 27–144 | 7.3 | 218–406 | 44.6 | 408–492 | 29.8 | 495–812 | 17.1 | 0.9 |
| PVA–ZnS-1 | 26–114 | 8.1 | 143–338 | 41.3 | 348–480 | 15.9 | 483–815 | 28 | 6.7 |
| PVA–ZnS-2 | 25–134 | 9.9 | 205–372 | 42.5 | 380–492 | 21.4 | 495–826 | 24.1 | 2.1 |
| PVA–ZnS-3 | 30–150 | 10.6 | 186–356 | 39 | 367–491 | 21.6 | 493–835 | 24.1 | 4.7 |
| PVA–ZnS-4 | 28–174 | 12.6 | 200–370 | 38.5 | 367–491 | 21.7 | 493–835 | 24.2 | 3.0 |
| PVA–ZnS-5 | 28–160 | 8.9 | 205–370 | 41.8 | 374–494 | 22.7 | 496–829 | 22.4 | 4.2 |
The samples, decomposition temperature, % of weight loss, and residual weight for different samples are listed.
The second degradation is located between 218 and 406 and between 143 and 372 °C, and the weight losses are 44.6 and 39–42.5% for PVA and composites, which is caused by the heating arrangement of the polymer structure.36 The third disintegration temperature of PVA and composites is 408–492 and 348–494 °C corresponding to the decomposition temperature of the PVA structure.37 The mass loss for this step is 29.8% for PVA, and it significantly decreased for all of the composite samples providing the values 15.9–22.7% which indicate a better thermal stability of composites than that of PVA. The reason for better thermal stability is due to the incorporation of ZnS with PVA in the case of composite samples. The inclusion of ZnS into the PVA matrix may restrict the motions of polymer chains resulting in the decrease of weight loss in the composites and undergoes a slow degradation process.38 These results match well with the improvement of the thermal stability nature of composites because of the interaction of inorganic oxides and polymer.6 Among the composite samples, no significant variation of weight losses was observed, except for the sample (PVA–ZnS-1) prepared from the lowest addition of PVA (1 wt %). Therefore, the PVA–ZnS-1 shows the highest thermal stability than other composites. For PVA, the final weight loss occurred at 495–812 °C. However, for the composites, the temperature range is 483–835 °C and the decomposition ends at a comparatively higher temperature than PVA. The disintegration of such a step was caused by the further decomposition of polymer structure which subsequently undergoes decomposition resulting in the formation of carbonaceous matter and remains constant giving the plateau approach in the TGA curve.39
The residual mass of the PVA–ZnS composites was observed from their TGA data, which was assessed to be 2.1–6.7%, whereas for the PVA films, the identified mass was extremely low at 0.9%. The residual mass shows the presence of alkenes, other organic compounds, and nondegraded polymer chains.36 The higher residual mass present in the case of composite samples may be because of the fact that inorganic ZnS can act as a catalyst surface which prevents the degradation process or simply the interaction of ZnS with PVA chain made the composites prohibited to the condensation–degradation reaction. Thus, the TGA results suggest that the incorporation of ZnS has significantly improved the thermal stability of PVA–ZnS composites. Among the composite samples, the higher residual mass of 6.7% was observed for PVA–ZnS-1 composites, further indicating its higher thermal stability nature.
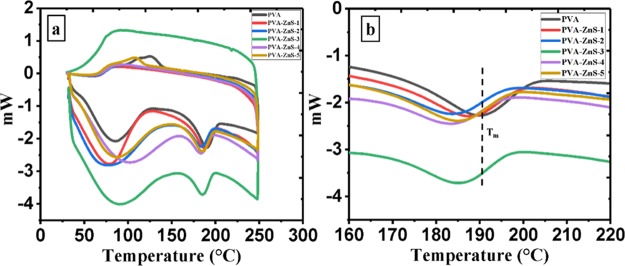
Figure 7 shows the differential scanning calorimetry (DSC) curves (heating and cooling cycle) of PVA and PVA–ZnS composites, emphasizing their glass transition temperature (Tg), melting temperature (Tm), melting enthalpy (ΔHm), and crystalline behavior, as listed in Table 3. Three endothermic peaks were identified for all samples. The first peak was assigned to the Tg identified at 38.5 and 37.5–39 °C for PVA and PVA–ZnS composites. For PVA, the Tg is lower than that of its general value because of the presence of moisture.40 It can be found that there is no evident change in the Tg value for PVA and composite samples. The second endothermic peak was found at 85 and 78.3–102 °C for PVA and composites, respectively. Such a peak is assigned to the removal of free (moisture) and hydrogen-bonded water.6 The exothermic peak was also observed for both PVA and composites samples. The third peak corresponds to the melting temperature (Tm) identified at 190 °C for PVA (Figure 7b). For composites, the Tm lies in the range of 184–187 °C. Therefore, there was no significant variation of Tm observed among the composites but a slight variation (∼3–6 °C) with PVA (Figure 7b). Such a melting temperature of PVA being almost unaffected by the ZnS demonstrates that the interaction with ZnS occurred through the amorphous section of the polymer and was exempted or very minor inducement to the crystalline part.22 A similar behavior of the melting temperature between PVA and its composites was reported in the literature.41 Additionally, the slight decrease in melting temperature may be because of the decrease of crystallinity of the composites.
Figure 7.
DSC thermograms of (a) PVA and PVA–ZnS composite films. The thermograms were recorded during both heating and cooling cycles. (b) Magnified curves showing the melting temperature (Tm) of the corresponding samples in the temperature range of 160–220 °C for enhanced clarity.
Table 3. Thermal Parameters of PVA and PVA–ZnS Composites.
| sample | Tg (°C) | Tm (°C) | ΔHm (J/g) | crystallinity (%) |
|---|---|---|---|---|
| PVA | 38.5 | 190.0 | 29.02 | 20.94 |
| PVA–ZnS-1 | 39 | 187 | 23.09 | 16.66 |
| PVA–ZnS-2 | 37.5 | 184.5 | 16.27 | 11.74 |
| PVA–ZnS-3 | 37.5 | 184.8 | 17.10 | 12.34 |
| PVA–ZnS-4 | 38.5 | 184 | 14.88 | 10.74 |
| PVA–ZnS-5 | 38.5 | 185 | 20.07 | 14.63 |
The degree of crystallinity was calculated using the equation (ΔHm/ΔHm0) ×100.6 The ΔHm is the measured enthalpy of melting obtained from DSC thermogram, and ΔHm° is the enthalpy of melting for 100% crystalline PVA (taken as 138.6 J/g).42 The value of ΔHm for PVA was 29.02 J/g. This value decreases to 14.88 from 23.09 J/g for composites corresponding to the decrease of the degree of crystallinity. The calculated value of the degree of crystallinity of all samples is listed in Table 3. The crystallinity of PVA was 20.94%, whereas for the composites, the values lie in the range of 10.34–16.66%. Such a decrease of crystallinity indicates the reality of interactions between PVA and ZnS which turn to the impairment of interactions among polymer chains.43 The possible interactions between two materials are hydrogen bonds between S of ZnS and O atom in PVA (see FTIR discussion).
2.6. Morphology Study
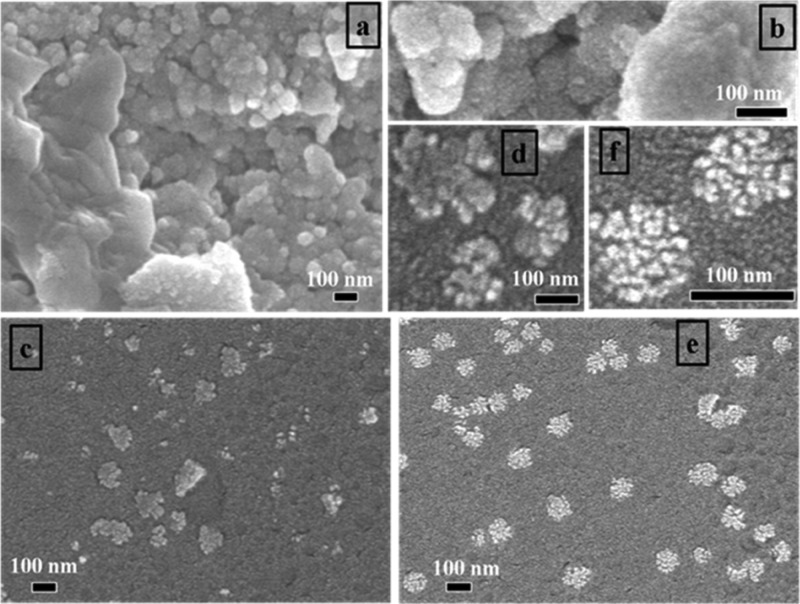
The morphological features of the synthesized composites were assessed from their field-emission scanning electron microscopy (FESEM) images. For instance, the typical FESEM images of the composites obtained from 1, 3, and 5 wt % are presented in Figure 8a,c,e. From the images, it can be seen that the composites are composed of nanostructures with the diameter in the range of a nanometer scale. For more clarity, the higher magnification images of the corresponding samples are shown in Figure 8b,d,f. For the lower amount of PVA addition (1 and 2 wt %), most of the spherical-shaped ZnS particles are individually well-distributed among the PVA matrix. The representative image is shown in Figure 8a, and its corresponding higher magnification image is located in Figure 8b. For the further increment of PVA addition to 3–5 wt %, the ZnS nanoparticles are being severely aggregated forming a flowerlike structure in the PVA matrix. For instance, Figure 8c,e represents such images captured from the composite samples of 3 and 5 wt % addition. The flowerlike structures are more clearly visible in Figure 8d,f. Thus, for the higher addition of PVA, the aggregation of ZnS particles is dominating compared to the lower addition. Nonetheless, whatever the amount of PVA addition, the particle size of the ZnS remains similar for all composite samples which lie in the range of 50–120 nm.
Figure 8.
FESEM image of (a) PVA–ZnS-1 composite films and its (b) high magnification, (c) PVA–ZnS-3 composite films and its (d) high magnification, and (e) PVA–ZnS-5 composite films and its (f) high magnification.
To deepen the study of the interaction of ZnS with PVA along with morphological observations, the energy-dispersive X-ray (EDX) measurements were performed for the composite samples. For instance, Figure 9 shows the EDX spectrum of PVA–ZnS-1 composite films. The peaks of Zn and S along with C and O in the spectrum confirm their presence in the composites and agree well with the FTIR and UV–vis data. It can be seen for the PVA–ZnS-1 composites that the atomic % of Zn and S are 18.14 and 12.92, respectively (inset of Figure 9). The EDS data of the other four composite samples are presented in Figure S3.
Figure 9.
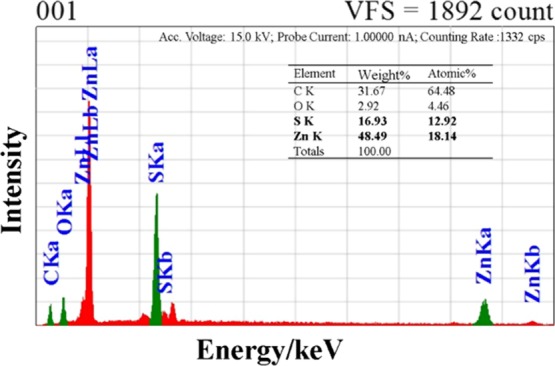
EDX spectrum of PVA–ZnS-1 composite films.
2.7. Photocatalytic Performance
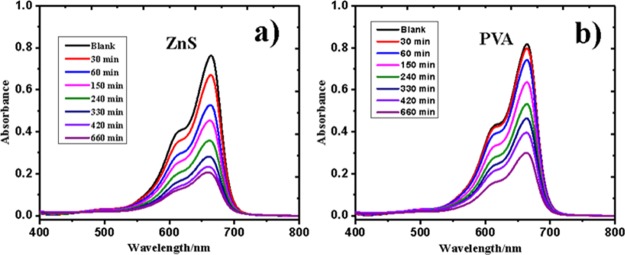
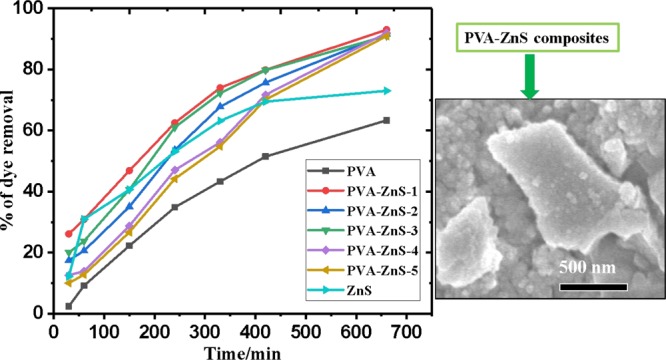
The photocatalytic capability of ZnS, PVA, and all PVA–ZnS composite samples was investigated by the photodegradation of organic dye MB through direct sunlight irradiation. We also corroborated the water resistivity of composite films in different temperatures. We observed that the PVA–ZnS composite films are resistant to water until 66 °C, which is below the temperature originating from the sunlight shining. The time-dependent UV–vis absorption spectra representing the degradation of MB in the presence of bare ZnS, PVA, and PVA–ZnS composite films as a photocatalyst are presented in Figures 10 and 11, respectively. The decreasing of absorption bands exhibits an effective removal of MB on the respective samples. Figure 10a shows the UV–vis absorption spectra of MB solution comprising 20 mg of bare ZnS under the sunlight irradiation for different time interims. The absorption maxima decrease gradually with the increasing of illumination time, and 73% removal occurred after 660 min of time duration. The percentage of removal with respect to exposure time to the sunlight for all samples is plotted in Figure 12. The absorbance at 664 nm was changed very slowly for MB solution in the absence of photocatalyst ZnS on sunlight irradiation (see Figure S4). It was apparent that only 26% removal was completed after the same time (660 min) span similar to ZnS. Such a result indicates the good photocatalyticability of ZnS under sunlight. In the case of PVA film, after a time span of 660 min, 63% removal of MB was occurred indicating its low degradation capacity (Figure 10b).
Figure 10.
Changes in the UV–vis absorption spectra of MB aqueous solution by (a) ZnS and (b) PVA films.
Figure 11.
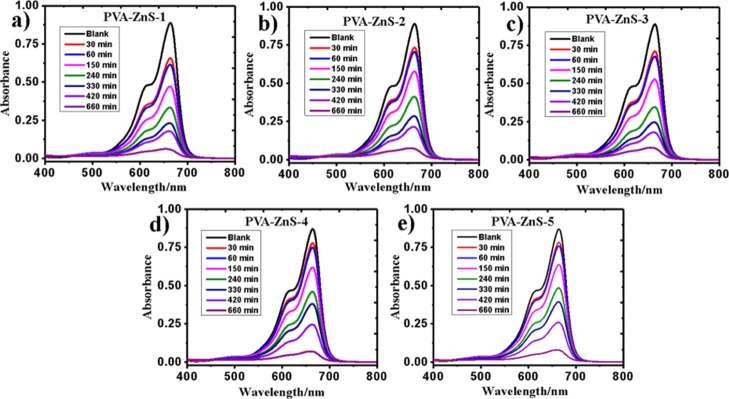
Changes in the UV–vis absorption spectra of MB aqueous solution in the presence of (a) PVA–ZnS-1, (b) PVA–ZnS-2, (c) PVA–ZnS-3, (d) PVA–ZnS-4, and (e) PVA–ZnS-5 composite films.
Figure 12.
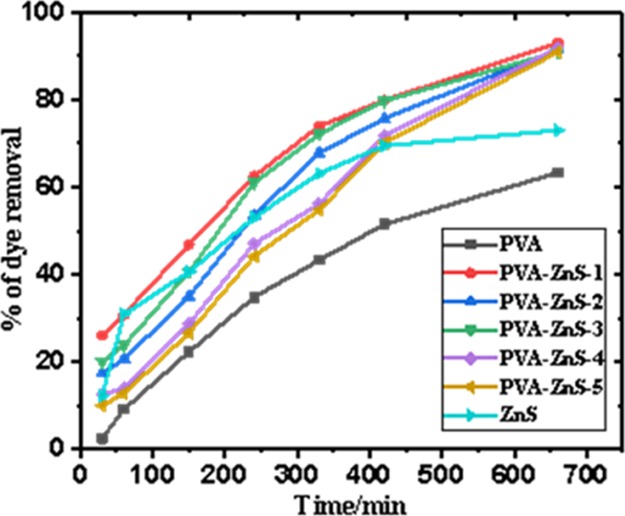
Photodegradation of MB in the presence of ZnS, PVA, and different PVA–ZnS composite samples.
Further, PVA–ZnS composites were employed as a photocatalyst under the same experimental conditions to compare the photocatalytic performance with the bare ZnS and PVA. It is evident from Figure 11a–e that there is a perceptible decrease in the absorption maxima for all of the PVA–ZnS composite samples. The absorption maxima decrease gradually with the increase of exposure time showing a substantial blue shift, and it finally reaches near zero after 660 min of solar irradiation. Nonetheless, no significant variation of the absorption maxima was observed among the composite samples (Figure 11a–e). The observed blue shift in the absorption maxima of the composites demonstrates the gradual adsorption of MB to the samples and finally reaches toward its complete degradation. Such PVA–ZnS composite films are reusable up to 3 times for the removal of MB, as shown in Figure S5. The decomposition of MB from its conjugate structure was confirmed by observing the following phenomenon: (i) the color changes in the reaction mixture from blue to light blue and finally turned into colorless and (ii) the apparent shifting of the absorption band from 664 to 662 nm. Two realities may ensue for the removal of MB from the aqueous solution: one is the degradation process and another is the interaction of MB with the samples resulting in their aggregation and precipitating out as a separate phase. At the present situation, we could not exclude either of these possibilities. The PVA–ZnS composite films are also able to degrade the colorless organic compound (for instance, phenol) as the absorption maxima decreases gradually with respect to time under sunlight irradiation (see Figure S6).
The comparison among ZnS, PVA, and PVA–ZnS composites shows that the photocatalytic activity of PVA–ZnS composite films is higher than bare ZnS and PVA. Such results corroborate that composites have excellent ability to degrade organic dyes than the ZnS and PVA alone. Thus, a significant synergistic enhancement effect of the photocatalyst was observed for PVA–ZnS composites. The absorption coefficient of PVA–ZnS increases compared to ZnS and PVA in the visible region because of the strong interaction of ZnS with PVA matrix. Additionally, such interaction may weaken the hydrogen bonding in PVA chain and may form a layer of ZnS structure in the surface of the PVA film. This observation is supported by the FESEM images of the PVA–ZnS composite films (Figure 8). Such an interaction and development of layer on the surface of the PVA matrix may have advantages to significantly increase the photoabsorption of PVA–ZnS composites and thus increasing their photocatalytic ability. The similar effect of ZnS on the degradation of MB was reported by other researchers.4,25
2.8. Photocatalytic Mechanism
In the degradation process of organic dye similar to MB, the active species containing holes, hydroxyl radicals, and superoxide radicals are generated under the sunlight irradiation. Generally, in the presence of oxygen, the irradiated nanoparticles can destroy many organic pollutants. A possible mechanism of the photocatalytic degradation process for PVA–ZnS composite films is illustrated in Figure 13. Under solar (hυ) illumination, ZnS is induced to generate electron–hole charge pairs.
Figure 13.
Schematic diagram of the photocatalytic process through the PVA–ZnS nanocomposite films under sunlight irradiation.
The photoinduced electrons on the valence band (VB) edges are excited and migrate to the conduction band (CB) edges, generating holes on the VB (Figure 13). The generated holes in the VB react directly with the organic pollutants (MB) or with the surrounding water molecules to generate hydroxyl radicals (•OH). The electrons assembling on the CB react with the surrounding water and oxygen molecules to generate hydroxyl (•OH) and superoxide radicals (•O2–). In such a way, generated radicals and holes are able to contribute significantly to the degradation of MB and other organic pollutants. During the degradation process of MB, the presence of oxygen (O2) can inhibit the undesirable recombination of electron–hole charge pair. The unique electron–hole charge-pair transfer can make the ability of a photocatalyst to be in its excellent performance. In the ultimate reaction of the photodegradation of MB, the final products of the reaction are CO2 and H2O.25 When ZnS incorporates into the PVA structure, the ZnS layer may help in the adsorption of MB on the surface of catalysts and improve the photocatalytic performance of the composites than that of the polymer. Thus, the above results confirm that PVA–ZnS composites can work as an efficient photocatalyst for dye degradation for textile and wastewater treatment applications.
3. Experimental Section
3.1. Materials
PVA (Mw = 72 000), sodium thiosulfate (Na2S2O3), zinc chloride (ZnCl2), and MB were purchased from Merck. Acetone ((CH3)2CO, ≥99.5%) was procured from Sigma–Aldrich. All of the reagents were of analytic grade and were used as received.
3.2. Synthesis of PVA–ZnS Nanocomposite Films
PVA–ZnS nanocomposite films were fabricated by a simple solvent casting technique.12 Similarly, ZnS films were prepared without the addition of PVA. In a typical procedure, a known amount of PVA (wt %) was dissolved in 25 mL of double distilled water and heated at 60 °C through continuous stirring for 1 h until the polymer became completely soluble. Thereafter, 0.01 M (10 mL) ZnCl2 was added to the prepared PVA solution. The mixture (PVA and ZnCl2) was stirred for 2 h at 60 °C. Then, 0.01 M (10 mL) Na2S2O3 solution was added to the PVA-capped ZnCl2 reaction mixture and stirred for another 2 h. Eventually, the composite films were obtained through casting by pouring the solution into a glass plate. The schematic formation of PVA–ZnS composite films is shown in Scheme 1. The homogeneous films were obtained after drying at room temperature for at least 48 h. The prepared films are free from air bubbles and uniformly dispersed ZnS particles. Five different synthesis batches were prepared in a similar way by varying the composition of PVA ranging from 1 to 5 wt %.
Scheme 1. Schematic Presentation of the Formation of PVA–ZnS Nanocomposite Films.
3.3. Characterization
Transmission FTIR measurements of PVA and PVA–ZnS nanocomposites were carried out between 400 and 4000 cm–1 using Shimadzu FTIR prestige 21 spectrometers through the KBr pellet method. The UV–vis spectra and the absorbance of dye in solution were obtained on Shimadzu UV-1800 spectrometer with the range of 200–800 nm. The crystalline structure of the sample was determined from X-ray diffraction (XRD) pattern using Cu Kα radiation (model-3040 X'pert PRO, Philips). The luminescence characteristics were investigated by PL spectroscopy at room temperature using on Shimadzu RF-3501pc spectrofluorometer. The morphological investigation and elemental composition of the films were attained through scanning electron microscopy images recorded on a JEOL JSM 7600F FESEM equipped with an EDX. The sample preparation was performed through platinum coating before the measurement. The thermal properties were evaluated by TGA and DSC. TGA curves were obtained by measuring 4.0 mg of a sample using a Shimadzu TGA-50 thermogravimetric analyzer maintaining the heating temperature range between 30 and 850 °C at a rate of 20 °C min–1 under N2 atmosphere. DSC measurements were carried out on a Shimadzu TA-60A instrument, following heating and cooling rate at 10 °C min–1 in the temperature range of 30–250 °C under nitrogen flow (20 mL/min).
3.4. Photocatalytic Experiments
The photocatalytic ability of PVA–ZnS nanocomposite films was assessed by the degradation of MB in aqueous media through sunlight illumination. The experiments were performed for all samples at the same time to ensure a similar irradiation power of sunlight. In a typical procedure, 20 mg of the photocatalyst sample was suspended in MB solution (C0 = 2 mg L–1). Before placing it to sunlight irradiation, the reaction mixture was magnetically stirred for 30 min in a dark place to attain absorption–desorption equilibrium between the photocatalyst and the organic dye. Continuous stirring was maintained after subsequent sunlight irradiation to reach the photocatalyst particles suspended throughout the measurements. After certain time intervals of solar illumination, the aliquots of the mixture were removed for centrifugation which was accomplished at 3000 rpm for 20 min to separate the solid photocatalyst. After centrifugation, the collected supernatant was allowed for UV–vis measurements to observe the adsorption and degradation behavior of MB. The distinctive absorption band of MB at 664 nm was applied to calculate the percentage of dye removal. The degradation efficiency was determined using the method earlier reported in ref (44).
4. Conclusions
PVA–ZnS composite films were prepared through a simple solvent casting method with improved photocatalytic performance. The strong host–filler interaction was confirmed by FTIR, UV–vis, and PL spectroscopy. PL data indeed showed a notable enhancement of the luminescence property of the PVA–ZnS composites. The optical transparency was very good for all composites. Relating to the decomposition temperature of PVA, a significant decrease in weight loss (15.9–22.7%) was observed for the composites compared with PVA (29.8%). Such a decrease of weight loss revealed better thermal stability of composites. The glass transition temperature (Tg) and the melting temperature (Tm) of PVA were almost unaffected by ZnS. However, the degree of crystallinity of composites was decreased, which further demonstrated the reality of interaction of ZnS with PVA chain. The morphological modification of the composites was realized with the variation of PVA addition. The as-synthesized composites exhibited improved photocatalytic performance through the photodegradation of MB because of the incorporation of ZnS into PVA matrix. All of these results will not only give a promising insight into the modification of PL, morphology, and thermal properties of PVA-based ZnS composites, but also exhibit a great prospect for the fabrication of PVA–ZnS photocatalysts for the treatment of organic pollutants.
Acknowledgments
We wish to express our gratitude to the Materials and Organic chemistry laboratory, Department of Chemistry, SUST, for supporting the works. M.M.R.K. is gratefully acknowledged to Matsumae International Foundation (MIF), Japan, for providing fellowship to support the work.
Supporting Information Available
The Supporting Information is available free of charge on the ACS Publications website at DOI: 10.1021/acsomega.8b02807.
Possible hydrogen bonding between ZnS and PVA, EDS data, and changes in the UV–vis absorption spectra of MB (PDF)
The authors declare no competing financial interest.
Supplementary Material
References
- Aarthi T.; Madras G. Photocatalytic Degradation of Rhodamine Dyes with Nano-TiO2. Ind. Eng. Chem. Res. 2007, 46, 7–14. 10.1021/ie060948n. [DOI] [Google Scholar]
- Nikooe N.; Saljoughi E. Preparation and characterization of novel PVDF nanofiltration membranes with hydrophilic property for filtration of dye aqueous solution. Appl. Surf. Sci. 2017, 413, 41–49. 10.1016/j.apsusc.2017.04.029. [DOI] [Google Scholar]
- Mallakpour S.; Motirasoul F. Capturing Cd2+ ions from wastewater using PVA/a-MnO2–oleic acid nanocomposites. New J. Chem. 2018, 42, 4297–4307. 10.1039/c8nj00304a. [DOI] [Google Scholar]
- Kalpana K.; Selvaraj V. Photodegradation and antibacterial studies of ZnS enwrapped fly ash nanocomposite for multipurpose industrial applications. RSC Adv. 2015, 5, 47766–47777. 10.1039/c4ra16642f. [DOI] [Google Scholar]
- Hussain M.; Ahmad M.; Nisar A.; Sun H.; Karim S.; Khan M.; Khan S. D.; Iqbal M.; Hussain S. Z. Enhanced photocatalytic and electrochemical properties of Au nanoparticles supported TiO2 microspheres. New J. Chem. 2014, 38, 1424–1432. 10.1039/c3nj01525d. [DOI] [Google Scholar]
- Rahman Khan M. M.; Akter M.; Amin M. K.; Younus M.; Chakraborty N. Synthesis, luminescence and thermal properties of PVA–ZnO–Al2O3 composite films: Towards fabrication of sunlight-induced catalyst for organic dye removal. J. Polym. Environ. 2018, 26, 3371–3381. 10.1007/s10924-018-1220-9. [DOI] [Google Scholar]
- Zhang X.-J.; Wang G.-S.; Wei Y.-Z.; Guo L.; CaO M.-S. Polymer-composite with high dielectric constant and enhanced absorption properties based on graphene–CuS nanocomposites and polyvinylidene fluoride. J. Mater. Chem. A 2013, 1, 12115–12122. 10.1039/c3ta12451g. [DOI] [Google Scholar]
- Pattabi M.; Saraswathi Amma B.; Manzoor K.; Sanjeev G. Effect of 8MeV electron irradiation on the optical properties of PVP capped CdS nanoparticles in PVA matrix. Sol. Energy Mater. Sol. Cell. 2007, 91, 1403–1407. 10.1016/j.solmat.2007.04.015. [DOI] [Google Scholar]
- Kumar R. V.; Koltypin Y.; Cohen Y. S.; Cohen Y.; Aurbach D.; Palchik O.; Felner I.; Gedanken A. Preparation of amorphous magnetite nanoparticles embedded in polyvinyl alcohol using ultrasound radiation. J. Mater. Chem. 2000, 10, 1125–1129. 10.1039/b000440p. [DOI] [Google Scholar]
- Qian X.-F.; Yin J.; Huang J.-C.; Yang Y.-F.; Guo X.-X.; Zhu Z.-K. The preparation and characterization of PVA/Ag2S nanocomposite. Mater. Chem. Phys. 2001, 68, 95–97. 10.1016/s0254-0584(00)00288-1. [DOI] [Google Scholar]
- Jung G.; Kim H. Synthesis and photocatalytic performance of PVA/TiO2/graphene-MWCNT nanocomposites for dye removal. J. Appl. Polym. Sci. 2014, 131, 8797–8803. 10.1002/app.40715. [DOI] [Google Scholar]
- Lagashetty A.; Basavaraj S.; Bedre M.; Venkatarman A. Metal oxide dispersed polyvinyl alcohol nanocomposites. J. Metall. Mater. Sci. 2009, 51, 297–306. [Google Scholar]
- Asahi R.; Morikawa T.; Ohwaki T.; Aoki K.; Taga Y. Visible-light photocatalysis in nitrogen-doped titanium oxides. Science 2001, 293, 269–271. 10.1126/science.1061051. [DOI] [PubMed] [Google Scholar]
- Anbuvannan M.; Ramesh M.; Viruthagiri G.; Shanmugam N.; Kannadasan N. Synthesis, characterization and photocatalytic activity of ZnO nanoparticles prepared by biological method. Spectrochim. Acta, Part A 2015, 143, 304–308. 10.1016/j.saa.2015.01.124. [DOI] [PubMed] [Google Scholar]
- Liang C.; Niu C.-G.; Shen M.-C.; Yang S.F.; Zeng G.-M. Controllable fabrication of a novel heterojunction composite: AgBr and Ag@Ag2O co-modified Ag2CO3 with excellent photocatalytic performance towards refractory pollutant degradation. New J. Chem. 2018, 42, 3270–3281. 10.1039/c7nj04133k. [DOI] [Google Scholar]
- Hu J.-S.; Ren L.-L.; Guo Y.-G.; Liang H.-P.; CaO A.-M.; Wan L.-J.; Bai C.-L. Mass production and high photocatalytic activity of ZnS nanoporous nanoparticles. Angew. Chem., Int. Ed. 2005, 44, 1269–1273. 10.1002/anie.200462057. [DOI] [PubMed] [Google Scholar]
- Fang X.; Zhai T.; Gautam U. K.; Li L.; Wu L.; Bando Y.; Golberg D. ZnS nanostructures: From synthesis to applications. Prog. Mater. Sci. 2011, 56, 175–287. 10.1016/j.pmatsci.2010.10.001. [DOI] [Google Scholar]
- Nieto J. M. L. Microporous and mesoporous materials with isolated vanadium species as selective catalysts in the gas phase oxidation reactions. Top. Catal. 2001, 15, 189–194. 10.1023/A:1016605916860. [DOI] [Google Scholar]
- Sirait M.; Gea S.; Motlan; Marlianto E. Effect of Mixed Nanoparticles ZnS and Polyvinyl Alcohol (PVA) against Nanocomposite Mechanical Properties of PVA / ZnS. Am. J. Phys. Chem. 2014, 3, 5–8. 10.11648/j.ajpc.20140301.12. [DOI] [Google Scholar]
- Baishya U.; Sarkar D. Structural and optical properties of zinc sulphide-polyvinyl alcohol (ZnS-PVA) nanocomposite thin films: effect of Zn source concentration. Bull. Mater. Sci. 2011, 34, 1285–1288. 10.1007/s12034-011-0316-9. [DOI] [Google Scholar]
- Akhter S.; Allan K.; Buchanan D.; Cook J. A.; Campion A.; White J. M. XPS and IR study of X-ray induced degradation of PVA polymer film. Appl. Surf. Sci. 1988, 35, 241–258. 10.1016/0169-4332(88)90053-0. [DOI] [Google Scholar]
- Dey K. K.; Kumar P.; Yadav R. R.; Dhar A.; Srivastava A. K. CuO nanoellipsoids for superior physicochemical response of biodegradable PVA. RSC Adv. 2014, 4, 10123–10132. 10.1039/c3ra46898d. [DOI] [Google Scholar]
- Fernandes D. M.; Hechenleitner A. A. W.; Lima S. M.; Andrade L. H. C.; Caires A. R. L.; Pineda E. A. G. Preparation, characterization, and photoluminescence study of PVA/ZnO nanocomposite films. Mater. Chem. Phys. 2011, 128, 371–376. 10.1016/j.matchemphys.2011.03.002. [DOI] [Google Scholar]
- Torabi A.; Staroverov V. N. Band Gap Reduction in ZnO and ZnS by Creating Layered ZnO/ZnS Heterostructures. J. Phys. Chem. Lett. 2015, 6, 2075–2080. 10.1021/acs.jpclett.5b00687. [DOI] [PubMed] [Google Scholar]
- Soltani N.; Saion E.; Hussein M. Z.; Erfani M.; Abedini A.; Bahmanrokh G.; Navasery M.; Vaziri P. Visible Light-Induced Degradation of Methylene Blue in the Presence of Photocatalytic ZnS and CdS Nanoparticles. Int. J. Mol. Sci. 2012, 13, 12242–12258. 10.3390/ijms131012242. [DOI] [PMC free article] [PubMed] [Google Scholar]
- Omurzak E.; Mashimo T.; Sulaimankulova S.; Takebe S.; Chen L.; Abdullaeva Z.; Iwamoto C.; Oishi Y.; Ihara H.; Okudera H.; Yoshiasa A. Wurtzite-type ZnS nanoparticles by pulsed electric discharge. Nanotechnology 2011, 22, 1–7. 10.1088/0957-4484/22/36/365602. [DOI] [PubMed] [Google Scholar]
- Han S.; Liu W.; Sun K.; Zu X. Experimental evidence of ZnS precursor anisotropy activated by ethylenediamine for constructing nanowires and single-atomic layered hybrid structures. CrystEngComm 2016, 18, 2626–2631. 10.1039/c5ce02325d. [DOI] [Google Scholar]
- Shanker R.; Mandal T. K. Photoluminescence in small isotactic, atactic and syndiotactic PVA polymer molecules in water. Chem. Phys. 2004, 303, 121–128. 10.1016/j.chemphys.2004.05.006. [DOI] [Google Scholar]
- Sur U. K.; Ankamwar B. Optical, dielectric, electronic and morphological study of biologically synthesized zinc sulphide nanoparticles using Moringa oleifera leaf extract and quantitative analysis of chemical components present in the leaf extract. RSC Adv. 2016, 6, 95611–95619. 10.1039/c6ra18308e. [DOI] [Google Scholar]
- Poornaprakash B.; Amaranatha Reddy D.; Murali G.; Madhusudhana Rao N.; Vijayalakshmi R. P.; Reddy B. K. Composition dependent room temperature ferromagnetism and PL intensity of cobalt doped ZnS nanoparticles. J. Alloys Compd. 2013, 577, 79–85. 10.1016/j.jallcom.2013.04.106. [DOI] [Google Scholar]
- Karar N.; Singh F.; Mehta B. R. Structure and photoluminescence studies on ZnS:Mn nanoparticles. J. Appl. Phys. 2004, 95, 656–660. 10.1063/1.1633347. [DOI] [Google Scholar]
- Murugadoss G.; Rajamannan B.; Ramasamy V. Synthesis and photoluminescence study of PVA −capped ZnS:Mn2+ nanoparticlesd. Dig. J. Nanomater. Biostruct. 2010, 5, 339–345. [Google Scholar]
- Barman J.; Borah J. P.; Sarma K. C. Optical properties of chemically prepared CdS quantum dots in polyvinyl alcohol. Int. J. Mod. Phys. B 2009, 23, 545–555. 10.1142/s0217979209049917. [DOI] [Google Scholar]
- Moon I. K.; Chun H. High transparent thermal curable hybrid polycarbonate films prepared by the sol-gel method. J. Sol. Gel Sci. Technol. 2009, 52, 49–55. 10.1007/s10971-009-1993-3. [DOI] [Google Scholar]
- Budrugeac P. Kinetics of the complex process of thermo-oxidative degradation of poly(vinyl alcohol). J. Therm. Anal. Calorim. 2008, 92, 291–296. 10.1007/s10973-007-8770-8. [DOI] [Google Scholar]
- Gilman J. W.; VanderHart D. L.; Kashiwagi T. Thermal Decomposition Chemistry of Poly(vinyl alcohol). ACS Symp. Ser. 1995, 599, 161–185. 10.1021/bk-1995-0599.ch011. [DOI] [Google Scholar]
- Liu R.; Li W. High-thermal-stability and high-thermal-conductivity Ti3C2TxMXene/Poly(vinyl alcohol)(PVA) composites. ACS Omega 2018, 3, 2609–2617. 10.1021/acsomega.7b02001. [DOI] [PMC free article] [PubMed] [Google Scholar]
- Leszczynska A.; Njuguna J. A. K.; Pielichowski K.; Banerjee J. R. Polymer/montmorillonite nanocomposites with improved thermal properties: Part I. Factors influencing thermal stability and mechanisms of thermal stability improvement. Thermochim. Acta 2007, 453, 75–96. 10.1016/j.tca.2006.11.002. [DOI] [Google Scholar]
- Singh R.; Kulkarni S. G.; Naik N. H. Effect of nano sized transition metal salts and metals on thermal decomposition behavior of polyvinyl alcohol. Adv. Mater. Lett. 2013, 4, 82–88. 10.5185/amlett.2013.icnano.114. [DOI] [Google Scholar]
- Lee J.; Bhattacharyya D.; Easteal A. J.; Metson J. B. Properties of nano-ZnO/poly(vinyl alcohol)/poly(ethylene oxide) composite thin films. Curr. Appl. Phys. 2008, 8, 42–47. 10.1016/j.cap.2007.04.010. [DOI] [Google Scholar]
- Yuan B.; Bao C.; Guo Y.; Song L.; Liew K. M.; Hu Y. Preparation and Characterization of Flame-Retardant Aluminum Hypophosphite/Poly(Vinyl Alcohol) Composite. Ind. Eng. Chem. Res. 2012, 51, 14065–14075. 10.1021/ie301650f. [DOI] [Google Scholar]
- Peng Z.; Kong L. X.; Li S.-D. Non-isothermal crystallisation kinetics of self-assembled polyvinylalcohol/silica nano-composite. Polymer 2005, 46, 1949–1955. 10.1016/j.polymer.2004.12.026. [DOI] [Google Scholar]
- Salavagione H. J.; Martínez G.; Gómez M. A. Synthesis of poly(vinyl alcohol)/reduced graphite oxide nanocomposites with improved thermal and electrical properties. J. Mater. Chem. 2009, 19, 5027–5032. 10.1039/b904232f. [DOI] [Google Scholar]
- Reddy D. A.; Lee S.; Choi J.; Park S.; Ma R.; Yang H.; Kim T. K. Green synthesis of AgI-reduced graphene oxide nanocomposites: Toward enhanced visible-light photocatalytic activity for organic dye removal. Appl. Surf. Sci. 2015, 341, 175–184. 10.1016/j.apsusc.2015.03.019. [DOI] [Google Scholar]
Associated Data
This section collects any data citations, data availability statements, or supplementary materials included in this article.


