Abstract
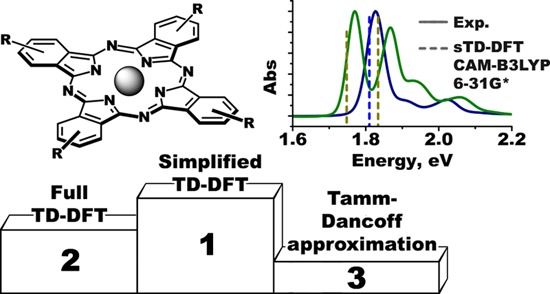
A methodological survey of density functional theory (DFT) methods for the prediction of UV–visible (vis)–near-infrared (NIR) spectra of phthalocyanines is reported. Four methods, namely, full time-dependent (TD)-DFT and its Tamm–Dancoff approximation (TDA), together with their simplified modifications (sTD-DFT and sTDA, respectively), were tested by using the examples of unsubstituted and alkoxy-substituted metal-free ligands and zinc complexes. The theoretical results were compared with experimental data derived from UV–visible absorption and magnetic circular dichroism spectroscopy. Seven popular exchange-correlation functionals (BP86, B3LYP, TPSSh, M06, CAM-B3LYP, LC-BLYP, and ωB97X) were tested within these four approaches starting at a relatively modest level using 6-31G(d) basis sets and gas-phase BP86/def2-SVP optimized geometries. A gradual augmentation of the computational levels was used to identify the influence of starting geometry, solvation effects, and basis sets on the results of TD-DFT and sTD-DFT calculations. It was found that although these factors do influence the predicted energies of the vertical excitations, they do not affect the trends predicted in the spectral properties across series of structurally related substituted free bases and metallophthalocyanines. The best accuracy for the gas-phase vertical excitations was observed in the lower-energy Q-band region for calculations that made use of range-separated hybrids for both full and simplified TD-DFT approaches. The CAM-B3LYP functional provided particularly accurate results in the context of the sTD-DFT approach. The description of the higher-energy B-band region is considerably less accurate, and this demonstrates the need for further advances in the accuracy of theoretical calculations. Together with a general increase in accuracy, the application of simplified TD-DFT methods affords a 2–3 orders of magnitude speedup of the calculations in comparison to the full TD-DFT approach. It is anticipated that this approach will be widely used on desktop computers during the interpretation of UV–vis–NIR spectra of phthalocyanines and related macrocycles in the years ahead.
1. Introduction
The unique physical–chemical properties of phthalocyanines (Pcs) paved the way for a wide range of applications, such as their use as photosensitive optical and electronic materials in solar cells, agents for photodynamic therapy and diagnosis, in memory storage devices, as sensors, etc.1−10 This is enabled by the presence of unusually intense absorption bands that lie at the red end of the visible region and into the near-infrared (NIR) region (650–800 nm), which is referred to as the Q-band in the context of Gouterman’s four-orbital model.11,12 In the context of phthalocyanines, the Q-band can be attributed primarily to the highest occupied molecular orbital (HOMO) → lowest unoccupied molecular orbital (LUMO) and HOMO → LUMO + 1 transitions.13 Excitations from low-lying orbitals to the LUMO and LUMO + 1 correspond to higher-energy bands, including a weaker broad charge transfer (CT) band envelope in the context of alkoxyphthalocyanines,14,15 and the B-bands of Gouterman’s four-orbital model in the 350–450 nm region.13 The optimization of the performance of light-absorbing materials based on Pcs aims at fine-tuning the positions of these bands to cover certain ranges of the electromagnetic spectra and provide the required functionalities for practical applications.
Modern quantum chemistry affords valuable and powerful approaches based on time-dependent density functional theory (TD-DFT), which is widely used for the interpretation of the UV–visible (vis)–near-infrared (NIR) absorption spectra of colored inorganic, organic, coordination, and organometallic compounds, including phthalocyanines and their analogues.13,16−29 However, TD-DFT is known to have certain drawbacks, such as overestimation of the excitation energies, appearance of low-energy “ghost” states with low oscillator strengths, incorrect description of charge-transfer processes, etc.30−34 Moreover, TD-DFT calculations are often time-consuming, so their application for large molecular systems is typically limited by the available computational facilities.
Therefore, over the last decade, efforts have been made to eliminate or at least to alleviate these drawbacks. To solve the problems of overestimated excitation energies and ghost transitions, various functionals were proposed, among them are range-separated hybrid functionals, which contain a certain amount of Hartree–Fock exchange (CAM-B3LYP, LC-BLYP, etc.). Some speedup can be achieved using Tamm–Dancoff approximation (TDA);35,36 however, full TD-DFT calculations typically yield more accurate transition dipole moments and hence more accurate spectra.
One of the recent advances was the development of the so-called simplified TD-DFT (sTD-DFT) and simplified Tamm–Dancoff approximation (sTDA) proposed by Grimme et al.,37−40 which is in line with the modern trend of elaboration of quantum-chemical methods affordable even for large molecules at relatively modest facilities, including desktop computers.41−43
The reliability of sTDA and sTD-DFT methods was proven through a comparison of the experimental and calculated UV–visible absorption and circular dichroism (CD) spectra of several types of compounds, including various dyes and pigments, fullerenes, helicenes, etc. Importantly, these methods afforded a spectacular 2–3 orders of magnitude speedup in the calculations in comparison to conventional TD-DFT treatments. This speedup is achieved in part by restricting the configuration space to a user-specified energy range of excitations. This means that all excited-state configurations that lie higher than the threshold in energy will be neglected.
Thus, together with its low computational cost, these new methodologies became attractive for research purposes dealing with large systems, including biomolecules.44 Currently, sTD-DFT and sTDA are implemented in several quantum-chemistry packages, which can be used in a “black-box” fashion by nonprofessionals even on conventional desktop computers.
Herein, we report a survey of the optimal simplified methods for interpreting the spectral properties of phthalocyanines. Several popular exchange-correlation functionals are used in conjunction with 6-31G(d) basis sets to predict the Q-band regions of the UV–visible spectra of phthalocyanines using gas-phase BP86/def2-SVP geometries. Four different calculation methodologies, namely, TDA, TD-DFT, sTDA, and sTD-DFT, are implemented with the ORCA 4.0.145,46 software package.
A series of different exchange-correlation functionals were corrected, including a pure generalized gradient approximation (GGA)—BP86,47,48 hybrid GGAs—B3LYP49 and TPSSh,50 meta-GGA—M06,51 and range-separated hybrids—CAM-B3LYP,52 LC-BLYP,52 and ωB97X.53 These functionals have been widely used to carry out TD-DFT calculations of tetrapyrrolic macrocycles,54−63 and the benefits and drawbacks of their applications have been highlighted.
The initial set of calculations were performed at a relatively modest level of theory using gas-phase BP86/def2-SVP optimized geometries for the evaluation of excitation energies in the gas phase using a series of different methods and functionals with 6-31G(d) basis sets. Then, the level of the optimal computational protocol was gradually augmented to further study the effects of starting geometry, solvation effects, and basis sets on the results of the sTD-DFT calculations.
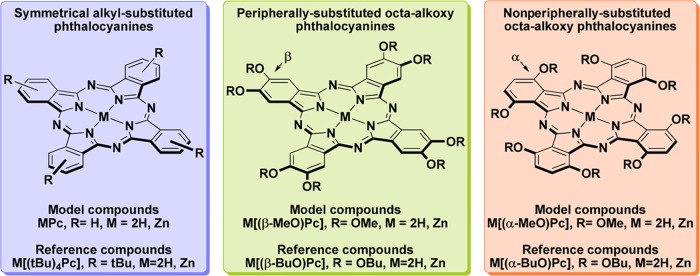
During the study, calculations were performed using the macrocycles depicted in Chart 1; so the results could be compared with the data obtained for the corresponding reference molecules, which have been characterized previously by UV–visible absorption spectroscopy:
-
(i)
Unsubstituted phthalocyanines H2Pc and ZnPc whose predicted spectra were compared to those of well-soluble tetra-tert-butyl-substituted phthalocyanines.
-
(ii)
Symmetrical peripherally substituted octa-β-methoxyphthalocyanine and its zinc complex M[(β-MeO)8Pc] (M = 2H, Zn) modeling corresponding octa-β-butoxyphthalocyanines.
-
(iii)
Symmetrical nonperipherally substituted octa-α-methoxyphthalocyanine and its zinc complex M[(α-MeO)8Pc] (M = 2H, Zn) modeling corresponding octa-α-butoxyphthalocyanines.
Chart 1. Experimentally Characterized and Model Phthalocyanines Used for Benchmark of TD-DFT Methods.
These molecules were selected for use as model compounds for the following reasons:
-
(i)
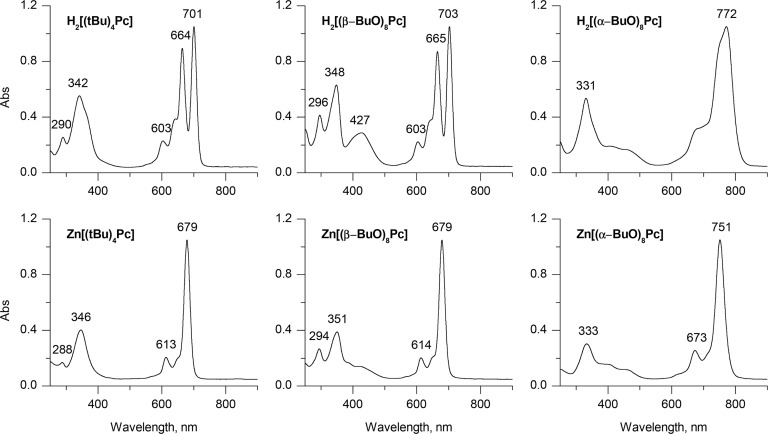
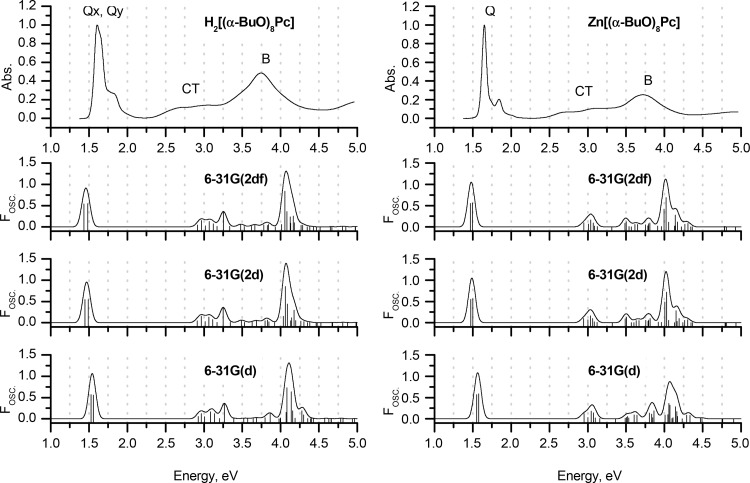
To provide a comparison of calculated spectra of symmetrical zinc complexes with the corresponding metal-free ligands, which reveals the effects associated with the decrease of molecular symmetry from D4h to D2h that results in the characteristic splitting of Q-bands of metal-free ligands (Figure 1).64
-
(ii)
The introduction of the alkoxy groups at the peripheral β-positions of the Pc macrocycle is known to result in a relatively small bathochromic shift of the Q-band, while substitution at nonperipheral α-positions provides a strong bathochromic shift of this band by ca. 80 nm.14 The energies of the corresponding vertical excitations will be compared to the experimental values. Moreover, the addition of alkoxy substituents is known to give rise to additional bands in the 400–450 nm region, associated with charge transfer (CT) transitions involving low-lying molecular orbitals (MOs) that are localized on the peripheral fused benzene rings and the lone pairs of oxygen atoms.14,15,64
Figure 1.
UV–vis spectra of reference phthalocyanines measured in CHCl3.
In summary, the conclusions that can be drawn from this can be viewed as recommendations for how best to predict the properties of novel phthalocyanines and related macrocycles, in a manner that can pave the way to the rational design of light-harvesting chromophores for optical applications.
2. Results and Discussion
2.1. Geometry Optimization
A previous survey of the optimal methods for the TD-DFT interpretation of phthalocyanine absorption spectra demonstrated that the starting geometry has only a minor influence on the energies of vertical excitations.54 In the present work, we used the BP86 functional with double- and triple-ζ def2-SVP and def2-TZVP basis sets, respectively, with RIJCOSX acceleration as a compromise between the need for accuracy and achieving a reasonable calculation speed. The BP86 functional was chosen since it is known to provide highly accurate geometries for tetrapyrrolic macrocycles. In some cases, this accuracy exceeds the one provided by the frequently used B3LYP method.65−67 Solvation effects in chloroform were accounted for by using the solvation model based on density (SMD).68 The obtained structures were verified to be local minima by subsequent vibrational frequency calculations showing no imaginary frequencies.
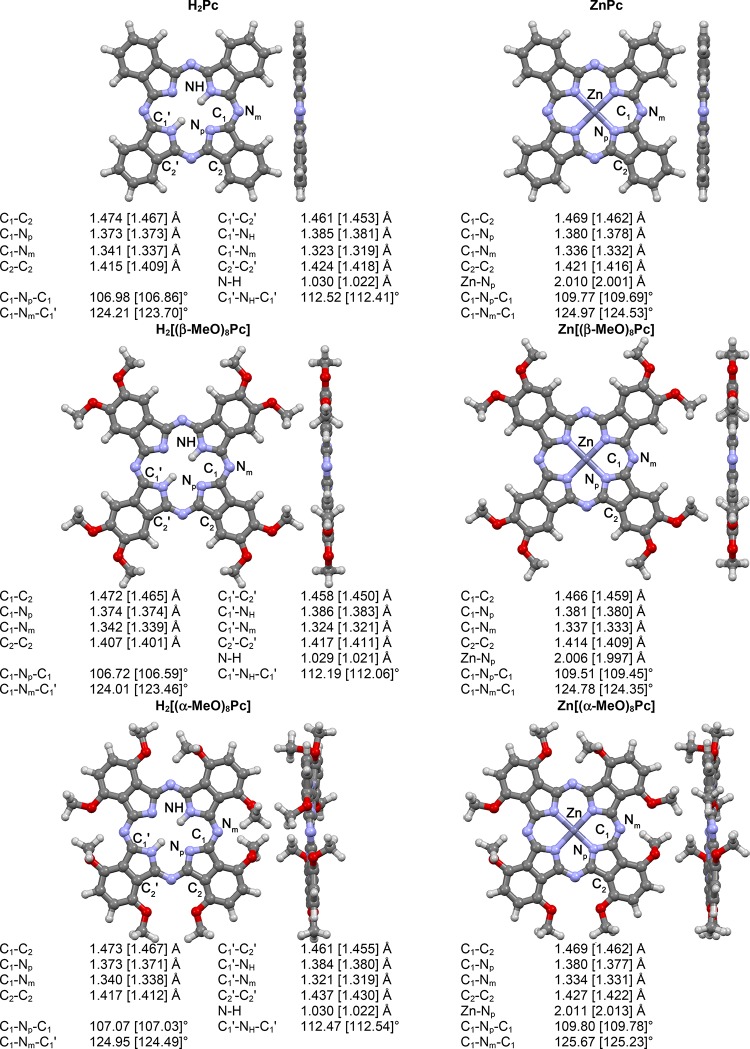
While unsubstituted and β-MeO-substituted Pcs have almost perfectly flat macrocyclic cores, the introduction of α-MeO substituents creates steric crowding, which is released by the nonplanar deformation of the macrocycle. This crowding was accounted for by using Grimme’s atom-pairwise dispersion correction and Becke–Johnson damping (D3BJ). Geometries, selected bond lengths, and angles with designations of atoms for optimized molecules are given in Figure 2.
Figure 2.
Front and side views of the optimized geometries and selected geometrical parameters for the model phthalocyanines optimized in gas phase at the BP86/def2-SVP+D3BJ level. The values given in brackets are obtained in gas phase at the BP86/def2-TZVP+D3BJ level.
The calculated geometrical parameters of the metal-free ligands and their complexes follow similar general trends (Figure 2). In the metal-free ligands, two isoindole units with the NH groups have C1′–C2′ and C2′–C2′ bonds that are elongated by ca. 0.01 Å in comparison to those without NH groups, and the C1′–NH–C1′ angles are larger by ca. 5° in comparison to the NH-proton-free isoindoles. In the case of zinc complexes, these bonds and angles are equalized because of the equivalence of the four isoindole moieties, and the angles formed by the C1 carbon atoms and the meso-nitrogen atom exhibit minor differences of no more than 0.5–0.7°. The addition of electron-donating β-MeO groups has a vanishingly small influence on the geometries of H2[(β-MeO)8Pc] and Zn[(β-MeO)8Pc] macrocyclic cores in comparison to H2Pc and ZnPc, respectively. The observed tendencies correlate well with the results of X-ray diffraction studies.69,70
The basis sets selection was found to be relatively unimportant. Using triple-ζ def2-TZVP basis sets did not result in significant changes in the molecular geometries. The bond lengths systematically contracted by less than 0.01 Å (Figure 2, values in brackets), and the trends observed in the def2-SVP-optimized structures were completely preserved. Even smaller changes in geometry were observed when solvation was taken into consideration.
2.2. Origin of UV–Vis Spectra of Phthalocyanines
The UV–visible absorption spectra of phthalocyanines are well-documented in the literature.71 These spectra are dominated by the bands that are associated with the Q- and B-transitions of Gouterman’s four-orbital model, which are derived from the doubly degenerate frontier orbitals of a 16-atom 18-π-electron system arranged in an ML = 0, ±1, ±2, ±3, ±4, ±5, ±6, ±7, eight sequence, due to the magnetic quantum number associated with the circulation of electron density around the phthalocyanine ring.11,12 In the context of porphyrins,72 the MOs derived from the HOMO and LUMO of the C16H162– parent hydrocarbon perimeter have ML = ±4 and ±5 angular nodal properties, respectively. In the context of metal complexes with fourfold symmetry, the LUMO retains its degeneracy for symmetry reasons and the MOs derived from the HOMO remain accidentally near degenerate due to the effect of incorporating the four pyrrole rings. This results in forbidden and allowed ΔML = ±9 and ±1 transitions that give rise to the Q- and B-bands, respectively, since an incident photon can only provide up to a single quantum of orbital angular momentum.
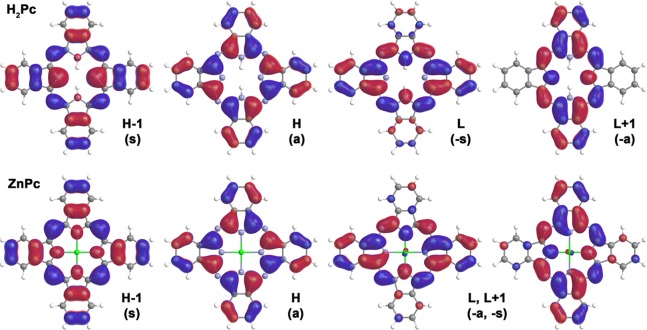
A unified approach is needed for the nomenclature used for the frontier π-MOs, which facilitates a comparison of the results of the DFT calculations performed for phthalocyanines and other porphyrinoids with differing symmetries. This can be readily achieved by using Michl’s formalism for the MOs that are derived from the HOMO and LUMO of the parent perimeter that display ML = ±4 and ±5 angular nodal properties.73−75 These are referred to as the a, s, –a, and −s MOs (Figure 3), based on whether the atoms aligned with the y axis lie on a nodal plane (a/–a) or have large MO coefficients (s/–s). The a and s MOs are derived from the HOMO of the C16H182– parent hydrocarbon perimeter, while the –a and –s MOs are derived from the LUMO. The Q- and B-bands can be viewed as arising from the cancelation and addition of the electric dipole transition moments that are generated by the one-electron transitions between the doubly degenerate HOMO and the doubly degenerate LUMO. Near-equal a → −a/–s and s → –a/–s contributions are typically predicted for the Q- and B-bands of porphyrins.
Figure 3.
Nodal structure and symmetry of Michl’s molecular orbitals on the examples of H2Pc and ZnPc calculated at the CAM-B3LYP/6-31G(d) level for a gas-phase BP86/def2-SVP+D3BJ geometry.
When further structural modifications are made, the energies of the a, s, –a, and –s MOs depend on the nature of the macrocycle and structural modifications that can be made, such as the incorporation of bridging aza-nitrogens, the presence of peripheral fused rings and substituents, and the metal ion inside its cavity.75 In the context of phthalocyanines,13 the Q-band predominantly involves the one-electron transitions between the a MO and the –a and –s MOs, as there is an unusually large splitting of the a and s MOs derived from the HOMO of the C16H182– parent hydrocarbon perimeter (the ΔHOMO value in the context of Michl’s perimeter model73−75). Since there are four nodal planes and 16 atoms on the inner ligand perimeter, the nodal planes of the two MOs lie on alternating sets of atoms. The s MO, which has large MO coefficients on the electronegative aza-nitrogen atoms, is stabilized, while the a MO with large MO coefficients on the eight carbon atoms is destabilized, since the addition of peripheral fused benzene rings adds an extra set of nodal planes. The large ΔHOMO value results in the Q- and B-bands losing their forbidden and allowed character, so the Q-band becomes the dominant spectral feature in a manner that makes the phthalocyanine π-system suitable for use in applications where a highly photostable dye is required that absorbs strongly at the red end of the visible region and the near-infrared region. TD-DFT calculations have been used to demonstrate that the ΔHOMO value of porphyrinoids can be used to systematically predict their optical and redox properties.
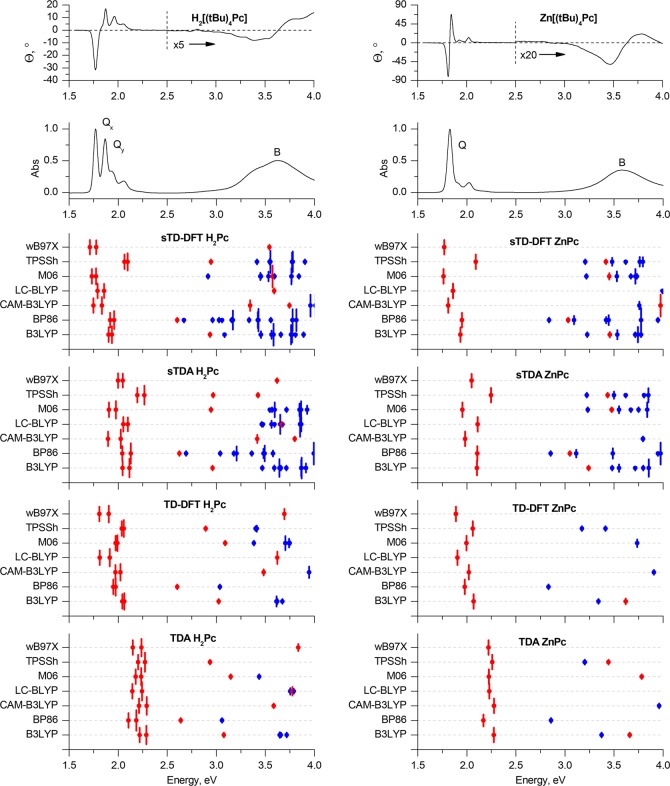
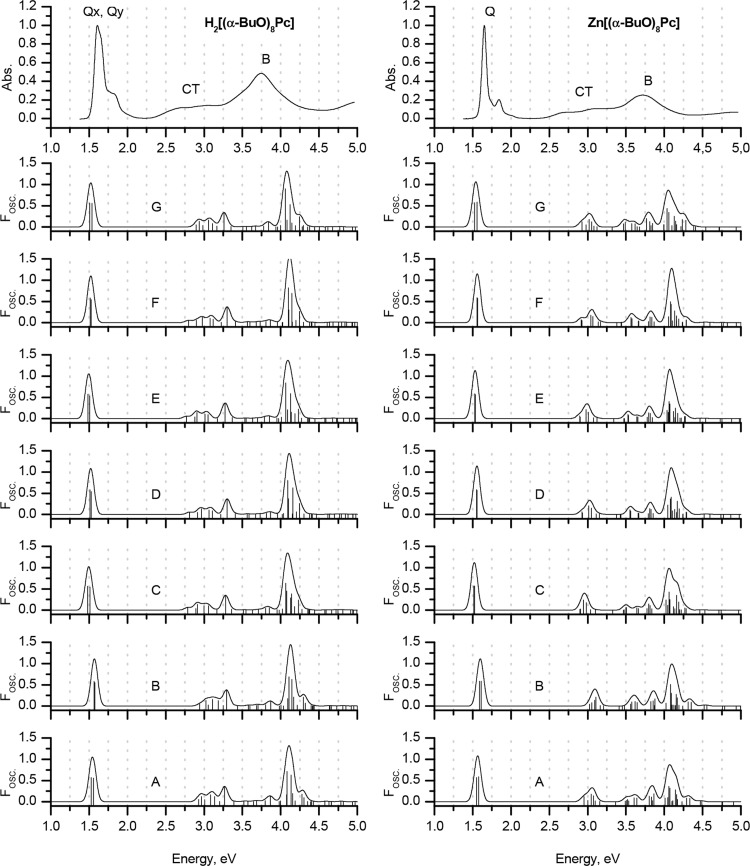
In the context of metal phthalocyanine complexes, the distinctive derivate-shaped Faraday A1 terms observed in the magnetic CD (MCD) spectra (Figures 4–6) have been used to definitively identify the band centers of the Q- and B-bands.76−81 The readily identified derivative-shaped Faraday A1 term arises from the Zeeman splitting of orbitally degenerate excited states and in the absence of extensive band overlap has an inflection point that corresponds to the band center of the main x/y-polarized absorption band in the Q-band region (Figures 4–6). The validity of Gouterman’s four-orbital model in the context of phthalocyanines has been confirmed by moment analyses of the absorption and MCD spectra of Mg(II) and Zn(II) complexes of the parent unsubstituted phthalocyanine, since the spectral envelope in the Q-band region has A1/D0 ratios (which provides the excited-state magnetic moment since the electric dipole moment contribution cancels out) of up to 3.55ℏ.81 This demonstrates that the Q-band still retains a significant portion of its forbidden character.
Figure 4.
Experimental MCD and UV–vis spectra of H2[(tBu)4Pc] and Zn[(tBu)4Pc] in chloroform (TOP) are plotted on an energy scale to provide a comparison with the positions of the vertical transitions calculated in gas phase for the H2Pc and ZnPc model complexes optimized in gas phase at the BP86/def2-SVP+D3BJ level of theory. The size of the vertical lines is proportional to the oscillator strengths of the corresponding transitions. For clarity, only transitions with Fosc. > 0.005 are shown. Red is used to highlight the Q- and B-bands that are associated with excitations predominantly involving the a, s, –a, and –s of Michl’s perimeter model. Blue lines show transitions predominantly involving non-Michl’s orbitals.
Figure 6.
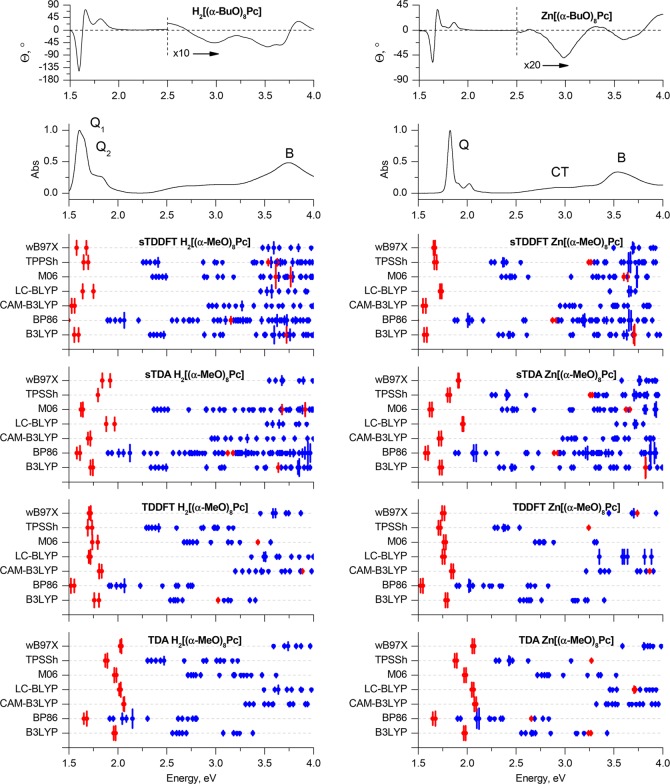
Experimental MCD and UV–vis spectra of H2[(α-BuO)8Pc] and Zn[(α-BuO)8Pc] in chloroform (TOP) are plotted on an energy scale to provide a comparison with the positions of the vertical transitions calculated in gas phase for the H2[(α-MeO)8Pc]Pc and Zn[(α-MeO)8Pc] model complexes optimized in gas phase at the BP86/def2-SVP+D3BJ level of theory. The size of the vertical lines is proportional to the oscillator strengths of the corresponding transitions. For clarity, only transitions with Fosc. > 0.005 are shown. Red is used to highlight the Q- and B-bands that are associated with excitations predominantly involving the a, s, –a, and –s of Michl’s perimeter model. Blue lines show transitions predominantly involving non-Michl’s orbitals.
The B-transitions of phthalocyanines typically overlap and mix with other close-lying ππ* transitions resulting in a broad absorption envelope that is observed in the 300–400 nm region. A detailed assignment of these transitions has been discussed in depth in the literature, often providing controversial interpretations.54,76−78,82 The large ΔHOMO value of phthalocyanines is known to result in extensive configurational interaction between the B excited state that arises primarily from one-electron transitions between the s MO and the –a and –s MOs and other higher-energy ππ* states that are associated with transitions from MOs that are localized primarily on the peripheral fused benzene rings. Analysis of the MCD spectra has also demonstrated that there are at least two intense overlapping bands in the 300–400 nm region.76−81 This led to the Q (ca. 660 nm), B (ca. 320 nm), N (ca. 275 nm), L (ca. 245 nm), and C (ca. 210 nm) band nomenclature sequence originally recommended by Gouterman83 on the basis of spectral measurements in the gas phase to be amended as Q, B1, B2, N, L, and C, respectively.76−81 More recently, Nemykin et al. have demonstrated that the relative energies of the s MO and close-lying MOs that are localized primarily on the fused benzene rings depend to a significant extent on the size of the Hartree–Fock component incorporated into the exchange-correlation functional, which is used for these calculations.54 This makes an accurate description of the B-band region of the phthalocyanine spectrum highly challenging, since even small changes in the energies of the s MO and other close-lying ππ* can radically alter the predicted optical properties.
The Q-bands in the spectra of metal-free Pc ligands are split into x- and y-polarized components (Figures 4–6) due to the splitting of the –a and –s MOs that is related to the presence of inner NH nitrogens aligned with the y axis that results in the geometry changes reported in Figure 2. Upon metalation, the –a and –s orbitals become degenerate, and a single x/y-degenerate Q-band is observed.13 In contrast to the spectra of metal complexes, coupled pairs of oppositely signed Gaussian-shaped Faraday B0 terms are observed in the context of the MCD spectra of metal-free Pcs (Figures 4–6) due to the splitting of the –a and –s MOs (Figure 3).80,81 In the context of the peripherally substituted Pcs, the Q-bands are located at 660–700 nm in the case of the metal-free ligands. Nonperipheral substitution results in a strong relative destabilization of the a MO, since there are larger MO coefficients on the α-carbons on these atoms than in the case with the s, –a, and –s MOs, resulting in a stronger mesomeric interaction with the lone pairs of the oxygen atoms. The resulting destabilization of the HOMO and the narrowing of the HOMO–LUMO gap shift the Q-band bathochromically to 750–800 nm. The Q-band splitting in the H2[(α-BuO)8Pc] spectrum decreases to 25 nm from 36 nm in the spectrum of H2[(β-BuO)8Pc]. The 400–450 nm region of the alkoxy-substituted Pc spectra corresponds to transitions from low-lying MOs localized mostly on the peripheral benzene rings and the lone pairs of the oxygen atoms. These transitions are typically described as CT bands, since they involve the transfer of charge from the ligand periphery to MOs localized on the inner ligand perimeter. The absence of a significant circular redistribution of charge on the inner ligand perimeter means that there is a relatively small magnetic dipole transition moment involved and this results in relatively weak MCD band envelopes that are dominated primarily by Faraday B0 terms that arise from the field-induced mixing of states (Figures 4–6).14,15
In the subsequent section, the benchmarking of the TD-DFT methods will be achieved through a comparison of the calculated and experimental spectra mainly in the Q- and CT-band regions, due to the greater relevance of this range of the spectrum for most practical applications.
2.3. Prediction of Vertical Excitations in the UV–Vis Spectra of Phthalocyanines
The results of the calculations performed using the four methods for MPc, M[(β-MeO)8Pc], and M[(α-MeO)8Pc] (M = 2H, Zn) with seven selected functionals and the commonly used 6-31G(d) basis sets in the gas phase are summarized in Tables 1–4 and Figures 4–6. Previously it has been demonstrated that addition of polarizations and/or diffuse functions to 6-31G(d) basis sets has only a minor effect on the TD-DFT excitation energies of tetrapyrrolic compounds, and are hence not worth the extra computational cost.54,59,84
Table 1. Benchmarking Gas-Phase TDA Q-Band Energies Using Seven Different Functionals and 6-31G(d) Basis Sets with Observed Energies for Six Different Phthalocyanines Optimized in Gas Phase at the BP86/def2-SVP+D3BJ Level of Theory.
| exp. (eV)a | B3LYP | BP86 | CAM-B3LYP | LC-BLYP | M06 | TPSSh | ωB97X | |
|---|---|---|---|---|---|---|---|---|
| H2Pc | 1.77 | 2.22 | 2.11 | 2.21 | 2.14 | 2.18 | 2.20 | 2.15 |
| 1.87 | 2.29 | 2.18 | 2.29 | 2.24 | 2.24 | 2.27 | 2.24 | |
| H2[(α-MeO)8Pc] | 1.61 | 1.96 | 1.65 | 2.05 | 2.01 | 1.96 | 1.87 | 2.02 |
| 1.65 | 1.98 | 1.68 | 2.06 | 2.03 | 1.99 | 1.89 | 2.04 | |
| H2[(β-MeO)8Pc] | 1.76 | 2.16 | 1.96 | 2.19 | 2.13 | 2.14 | 2.12 | 2.14 |
| 1.86 | 2.23 | 2.08 | 2.27 | 2.23 | 2.20 | 2.18 | 2.23 | |
| ZnPc | 1.83 | 2.28 | 2.17 | 2.28 | 2.23 | 2.23 | 2.26 | 2.22 |
| Zn[(α-MeO)8Pc] | 1.65 | 2.05 | 1.76 | 2.15 | 2.12 | 2.05 | 1.97 | 2.12 |
| Zn[(β-MeO)8Pc] | 1.83 | 2.21 | 1.97 | 2.25 | 2.21 | 2.18 | 2.16 | 2.21 |
UV–vis spectra measured in chloroform.
Table 4. Benchmarking Gas-Phase sTD-DFT Q-Band Energies Using Seven Different Functionals and 6-31G(d) Basis Sets with Observed Energies for Six Different Phthalocyanines Optimized in Gas Phase at the BP86/def2-SVP+D3BJ Level of Theory.
| exp. (eV)a | B3LYP | BP86 | CAM-B3LYP | LC-BLYP | M06 | TPSSh | ωB97X | |
|---|---|---|---|---|---|---|---|---|
| H2Pc | 1.77 | 1.90 | 1.92 | 1.75 | 1.79 | 1.73 | 2.07 | 1.71 |
| 1.87 | 1.94 | 1.96 | 1.83 | 1.86 | 1.77 | 2.10 | 1.78 | |
| H2[(α-MeO)8Pc] | 1.61 | 1.55 | 1.46 | 1.53 | 1.64 | 1.42 | 1.65 | 1.58 |
| 1.65 | 1.60 | 1.49 | 1.56 | 1.75 | 1.47 | 1.70 | 1.68 | |
| H2[(β-MeO)8Pc] | 1.76 | 1.86 | 1.83 | 1.74 | 1.80 | 1.70 | 1.99 | 1.73 |
| 1.86 | 1.91 | 1.93 | 1.84 | 1.84 | 1.75 | 2.05 | 1.77 | |
| ZnPc | 1.83 | 1.94 | 1.95 | 1.81 | 1.86 | 1.76 | 2.09 | 1.77 |
| Zn[(α-MeO)8Pc] | 1.65 | 1.66 | 1.57 | 1.65 | 1.79 | 1.53 | 1.76 | 1.72 |
| Zn[(β-MeO)8Pc] | 1.83 | 1.88 | 1.84 | 1.81 | 1.85 | 1.73 | 2.02 | 1.77 |
UV–vis spectra measured in chloroform.
Table 2. Benchmarking Gas-Phase TD-DFT Q-Band Energies Using Seven Different Functionals and 6-31G(d) Basis Sets with Observed Energies for Six Different Phthalocyanines Optimized in Gas Phase at the BP86/def2-SVP+D3BJ Level of Theory.
| exp. (eV)a | B3LYP | BP86 | CAM-B3LYP | LC-BLYP | M06 | TPSSh | ωB97X | |
|---|---|---|---|---|---|---|---|---|
| H2Pc | 1.77 | 2.04 | 1.95 | 1.97 | 1.81 | 1.97 | 2.04 | 1.81 |
| 1.87 | 2.06 | 1.98 | 2.02 | 1.92 | 1.99 | 2.06 | 1.90 | |
| H2[(α-MeO)8Pc] | 1.61 | 1.76 | 1.52 | 1.81 | 1.70 | 1.74 | 1.69 | 1.70 |
| 1.65 | 1.81 | 1.55 | 1.83 | 1.72 | 1.79 | 1.74 | 1.72 | |
| H2[(β-MeO)8Pc] | 1.76 | 2.01 | 1.82 | 1.96 | 1.80 | 1.95 | 1.98 | 1.80 |
| 1.86 | 2.04 | 1.85 | 2.02 | 1.91 | 1.98 | 2.02 | 1.91 | |
| ZnPc | 1.83 | 2.07 | 1.98 | 2.02 | 1.90 | 2.00 | 2.06 | 1.89 |
| Zn[(α-MeO)8Pc] | 1.65 | 1.87 | 1.63 | 1.91 | 1.82 | 1.84 | 1.80 | 1.81 |
| Zn[(β-MeO)8Pc] | 1.83 | 2.03 | 1.88 | 2.01 | 1.89 | 1.97 | 2.01 | 1.88 |
UV–vis spectra measured in chloroform.
Table 3. Benchmarking Gas-Phase sTDA Q-Band Energies Using Seven Different Functionals and 6-31G(d) Basis Sets with Observed Energies for Six Different Phthalocyanines Optimized in Gas Phase at the BP86/def2-SVP+D3BJ Level of Theory.
| exp. (eV)a | B3LYP | BP86 | CAM-B3LYP | LC-BLYP | M06 | TPSSh | ωB97X | |
|---|---|---|---|---|---|---|---|---|
| H2Pc | 1.77 | 2.05 | 2.04 | 1.90 | 2.05 | 1.91 | 2.20 | 2.00 |
| 1.87 | 2.11 | 2.13 | 2.03 | 2.10 | 1.98 | 2.27 | 2.05 | |
| H2[(α-MeO)8Pc] | 1.61 | 1.72 | 1.58 | 1.70 | 1.880 | 1.62 | 1.80 | 1.74 |
| 1.65 | 1.74 | 1.61 | 1.72 | 1.97 | 1.64 | 1.82 | 1.92 | |
| H2[(β-MeO)8Pc] | 1.76 | 1.98 | 1.91 | 1.88 | 2.04 | 1.86 | 2.10 | 2.00 |
| 1.86 | 2.05 | 2.04 | 2.02 | 2.08 | 1.93 | 2.15 | 2.03 | |
| ZnPc | 1.83 | 2.10 | 2.11 | 1.98 | 2.11 | 1.96 | 2.25 | 2.05 |
| Zn[(α-MeO)8Pc] | 1.65 | 1.82 | 1.68 | 1.81 | 2.02 | 1.71 | 1.90 | 1.97 |
| Zn[(β-MeO)8Pc] | 1.83 | 2.02 | 1.92 | 1.97 | 2.09 | 1.89 | 2.13 | 2.03 |
UV–vis spectra measured in chloroform.
2.3.1. Prediction of Vertical Excitations in the Q-Band Region of UV–Vis Spectra of Unsubstituted Phthalocyanines H2Pc and ZnPc
The use of the TDA approximation is characterized by a large overestimation of the energies of the Q-bands in comparison to the experimental values, which can be readily identified by using the crossover point in the Faraday A1 term in the MCD spectrum of Zn[(tBu)4Pc] and the coupled pair of oppositely signed Faraday B0 terms in the MCD spectrum of H2[(tBu)4Pc] (Figure 4). The errors lie within the 0.2–0.4 eV range depending on which exchange-correlation functional is applied. This result suggests that TDA is particularly inaccurate in the prediction of the UV–visible absorption spectra of phthalocyanines.
In the case of full TD-DFT, the errors in the predicted Q-band energies are smaller, but they are more sensitive to functional selection, with minimum values obtained in this regard for LC-BLYP and ωB97X (0.03–0.04 eV). Calculations with these functionals are also characterized by the best accuracy for the prediction of the Q-band splitting. Values of 36.8 and 34.4 nm are predicted in the case of the metal-free H2Pc ligand as opposed to 36 nm for H2[(tBu)4Pc] in chloroform. The energy of the Q-band in ZnPc is also accurately predicted. The error associated with the use of the CAM-B3LYP range-separated hybrid functional (0.2 eV) for the prediction of the Q-band is comparable to the one given by GGA, hybrid GGA, and meta-GGA functionals; the latter three families of functionals are also particularly inaccurate when the Q-band splitting is taken into consideration.
In the case of the simplified methods, the sTDA calculation provides a smaller discrepancy between the experimental and calculated energies of the Q-bands than the TDA method. This improvement in accuracy is particularly notable in the case of the M06 and CAM-B3LYP functionals.
Finally, sTD-DFT provides the best fit between the calculated and experimental energies of the Q-bands, especially in the case of the three range-separated hybrid functionals and the meta-GGA M06 functional. However, only the CAM-B3LYP functional provides an almost correct value for the Q-band splitting in the case of the metal-free ligand H2Pc (33.1 nm), while underestimating the energy of the Q-bands by only 0.02–0.03 eV. The other two range-separated hybrids provide less accurate positions for the Q-bands with errors below 0.1 eV, while Q-band splittings of 24.5 and 26 nm are predicted in the calculations with the LC-BLYP and ωB97X functionals, respectively.
2.3.2. Prediction of Vertical Excitations in the Q- and CT-Regions of UV–Vis Spectra of Octa-MeO-phthalocyanines M[(α-MeO)8Pc] and M[(β-MeO)8Pc], M = 2H, Zn
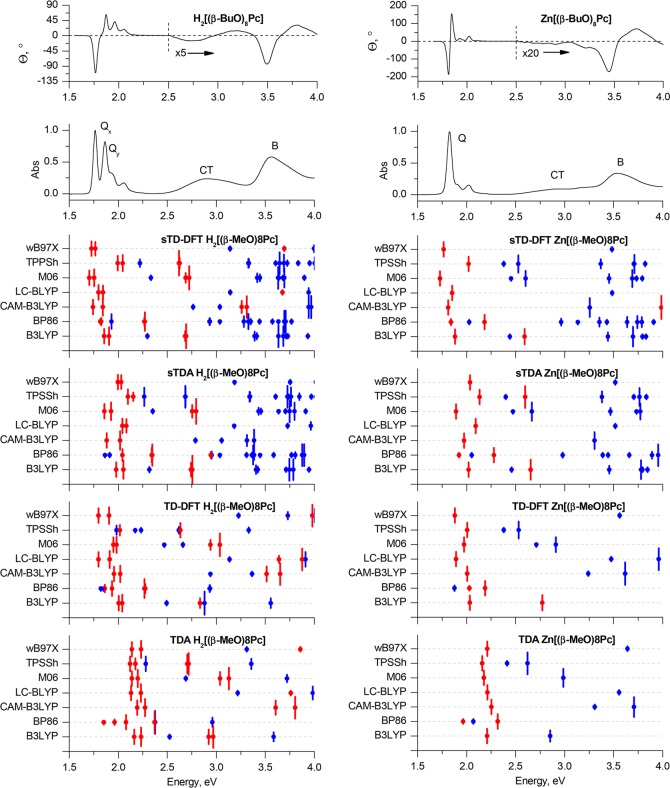
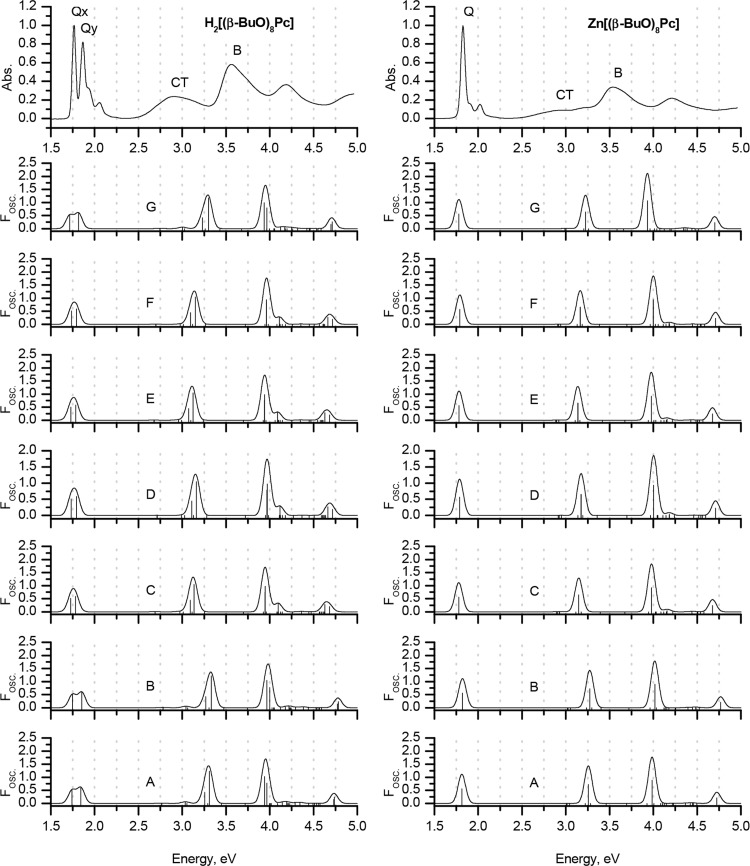
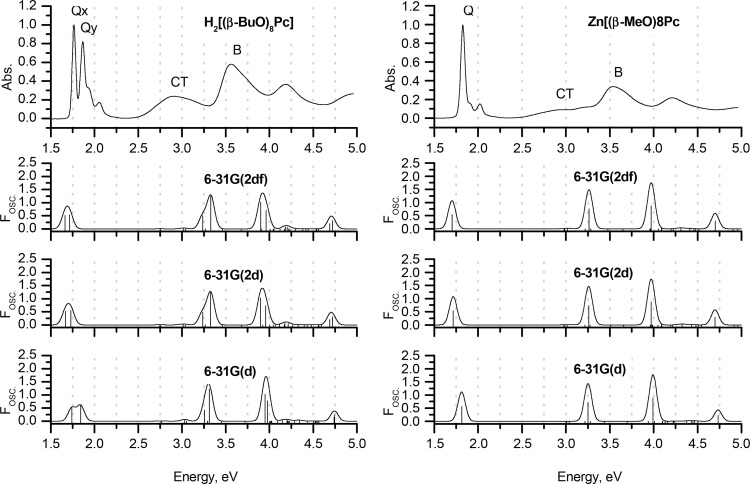
The trends in the Q-bands predicted for the M[(β-MeO)8Pc] model complexes by all four approaches (Figure 5) are similar to those observed for the corresponding unsubstituted MPc compounds (Figure 4). In the case of every functional considered, TDA provides less accurate predictions when a comparison is made with the experimental spectra.
Figure 5.
Experimental MCD and UV–vis spectra of H2[(β-BuO)8Pc] and Zn[(β-BuO)8Pc] in chloroform (TOP) are plotted on an energy scale to provide a comparison with the positions of the vertical transitions calculated in gas phase for the H2[(β-MeO)8Pc]Pc and Zn[(β-MeO)8Pc] model complexes optimized in gas phase at the BP86/def2-SVP+D3BJ level of theory. The size of the vertical lines is proportional to the oscillator strengths of the corresponding transitions. For clarity, only transitions with Fosc. > 0.005 are shown. Red is used to highlight the Q- and B-bands that are associated with excitations predominantly involving the a, s, –a, and –s of Michl’s perimeter model. Blue lines show transitions predominantly involving non-Michl’s orbitals.
TD-DFT and particularly sTD-DFT provide notably more accurate results for the Q- and CT-bands in conjunction with the CAM-B3LYP, LC-BLYP, and ωB97X range-separated hybrid functionals. Again, the spectra predicted within the full TD-DFT approach using the LC-BLYP and ωB97X functionals are in close agreement with the experimental ones, and CAM-B3LYP overestimates the Q-band energies by ca. 0.3 eV. In contrast, the application of CAM-B3LYP provides the best accuracy when the simplified TD-DFT approach is adopted. The errors in the Q-band predictions lie within 0.01–0.02 eV, and the splitting patterns of the Q-bands of H2[(β-MeO)8Pc] and Zn[(β-MeO)8Pc] are also correctly predicted.
It is noteworthy that the introduction of peripheral MeO substituents has a crucial effect on the accuracy of the predictions of the other spectral features in the cases of pure, hybrid, and meta-GGAs when all four approaches are adopted.
In the case of BP86, weak bands with very low Fosc. values can be observed in the calculated spectra of both H2[(β-MeO)8Pc] and Zn[(β-MeO)8Pc], whose energies are smaller than those of the Q-bands. This clearly contradicts the experimental data. These bands are assigned to transitions with significant CT character involving MOs that lie close in energy to the a and s frontier π-MOs. Only weak bands are observed in the MCD spectra (Figure 5), since the CT transitions involved lack the large orbital angular momentum changes associated with the redistributions of charge on the inner ligand perimeter that are generated by the Q- and B-transitions. In the case of the hybrid (B3LYP and TPSSh) and meta-GGAs (M06) functionals, these bands are predicted to have considerably higher energies, but they are still underestimated by 0.5 eV in comparison to the experimental data. It must be concluded, therefore, that the overall accuracy of calculations with these functionals in this context is inappropriately low. Similar effects were observed previously in the case of phthalocyanines bearing electron-rich 15-crown-5-oxanthrene substituents,85,86 whose treatment with TDA and TD-DFT methods at the B3LYP/6-31G(d) level of theory led to misguided conclusions about the nature of CT-bands in their spectra.
The level of accuracy observed in the calculations obtained for the α-MeO-substituted phthalocyanines (Figure 6) is similar to that observed in the results obtained for β-MeO-substituted macrocycles (Figure 5). Again, the best overall accuracy is observed when the sTD-DFT method was used with the CAM-B3LYP range-separated hybrid functional. The bathochromic shift of the Q-band upon α-alkoxy-substitution is well reproduced, as is the decrease in the Q-band splitting in the case of the metal-free ligand. Within all four DFT approaches, all but the range-separated hybrid functionals predict low-lying CT transitions with energies strongly underestimated in comparison to the observed experimental data.
Notably, the deformation of the α-substituted macrocycles to form a lower-symmetry compound results in the appearance of numerous additional transitions, which are symmetry forbidden in spectra of the corresponding unsubstituted and β-MeO-substituted analogues, which possess highly symmetrical planar structures. There is a marked intensification of the CT band region of the MCD spectra relative to the B-band for this reason (Figure 6).
2.3.3. Effects of Starting Geometry, Solvation, Basis Sets, and Energy Threshold on sTD-DFT Excitation Energies
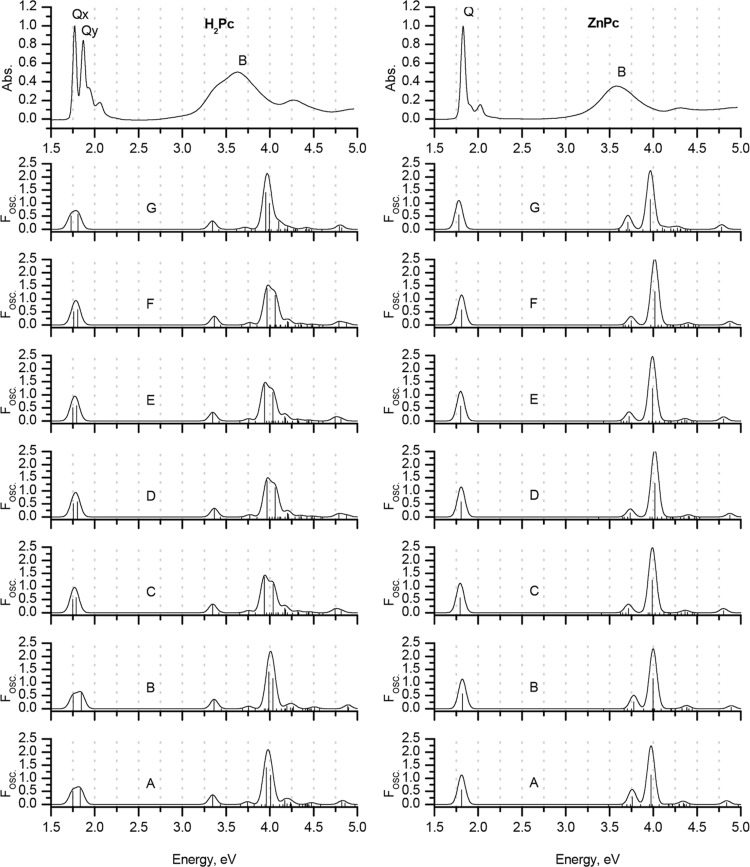
The spectacular speedup of calculations that is facilitated by the sTD-DFT method allows for fast screening of various effects (e.g., molecular geometry, solvation effects within SMD in CHCl3, and basis sets) that influence the excitation energies in the UV–vis spectra of phthalocyanines, so a comparison in the trends predicted can readily be made with those for full TD-DFT calculations, which have been comprehensively studied and reported previously.54,64Table 5 summarizes the various combinations of different computational conditions applied for this screening when using the BP86 functional for geometry optimizations and the CAM-B3LYP functional for sTD-DFT calculations. Comparisons of experimental and simulated spectra are provided in Figures 7–9, which reveal that there are only minor effects on the excitation energies when the starting geometry, solvation, and basis sets selection are taken into consideration.
Table 5. Computational Conditions Used To Study the Influence of the Starting Geometry, Solvation Effects, and Basis Sets Selection on the Outcome of sTD-DFT Calculations.
| entry | geometrya | sTD-DFTb |
|---|---|---|
| A | gas-phase def2-SVP | gas-phase 6-31G(d) |
| B | gas-phase def2-TZVP | gas-phase 6-31G(d) |
| C | gas-phase def2-SVP | SMDc 6-31G(d) |
| D | gas-phase def2-TZVP | SMD 6-31G(d) |
| E | SMD def2-SVP | SMD 6-31G(d) |
| F | SMD def2-TZVP | SMD 6-31G(d) |
| G | gas-phase def2-SVP | gas-phase 6-311G(d) |
BP86 functional was used for geometry optimization.
CAM-B3LYP was used for the sTD-DFT calculations.
SMD in CHCl3.
Figure 7.
Experimental UV–vis spectra of H2[(tBu)4Pc] and Zn[(tBu)4Pc]Pc in chloroform (TOP) and the sTD-DFT calculated spectra of H2Pc and ZnPc depending on the computational conditions listed in Table 5. The bandwidths in the simulated spectra were set to 0.05 eV.
Figure 9.
Experimental UV–vis spectra of H2[(α-BuO)8Pc] and Zn[(α-BuO)8Pc] in chloroform (TOP) and the sTD-DFT calculated spectra of H2[(α-MeO)8Pc] and Zn[(α-MeO)8Pc] depending on the computational conditions listed in Table 5. The bandwidths in the simulated spectra were set to 0.05 eV.
Figure 8.
Experimental UV–vis spectra of H2[(β-BuO)8Pc] and Zn[(β-BuO)8Pc] in chloroform (TOP) and the sTD-DFT calculated spectra of H2[(β-MeO)8Pc] and Zn[(β-MeO)8Pc] depending on the computational conditions listed in Table 5. The bandwidths in the simulated spectra were set to 0.05 eV.
To reveal the influence of starting geometry, we compared the results obtained for def2-SVP- and def2-TZVP-optimized gas-phase geometries (entries A and B). The alteration of geometrical characteristics of molecules upon going from double- to triple-ζ basis sets was only minor (Figure 2). It was followed by an increase in the excitation energies by 0.01 eV, which correlates with the previously made conclusion about the insignificant influence of starting geometry on the full TD-DFT outcome.
The influence of solvent on excitation energies was studied in CHCl3 by using the SMD continuum solvation model.68 With this goal in mind, gas-phase def2-SVP and def2-TZVP geometries were used to perform sTD-DFT/SMD calculations (nonequilibrium approach, entries C and D). The predicted energies were compared to those obtained from SMD def2-SVP and def2-TZVP geometries (equilibrium approach, entries E and F). It was found that both of these approaches provide the same values for the Q-band excitation energies, suggesting that the consideration of solvation in sTD-DFT calculations is more important than its application during geometry optimizations.
Finally, the influence of basis sets selection on sTD-DFT calculations was studied by using four Pople basis sets—6-31G(d) and 6-311G(d,p) (entries A and H) as an example. Moving from valence-split double- to triple-ζ basis sets has only minor effects on the predicted excitation energies. The use of 6-31+G(d) with diffuse functions proved to be problematic in terms of the convergence of the sTD-DFT calculations, so this approach could not be tested further; however, it has previously been demonstrated that the addition of diffuse functions is not worth the extra computational cost.23,59,87 The addition of polarization functions on hydrogen atoms in basis sets 6-31G(d,p) and 6-311G(d,p) was found to have a minuscule influence below 0.01 eV on the sTD-DFT outcome.
Importantly, the same trends are observed for other transitions, including the B-band excitations. Altogether, these results are in agreement with the conclusions that were previously drawn for full TD-DFT calculations of phthalocyanines concerning the influence of starting geometry, solvation effects, and basis sets selection on the calculated spectra.54,59,84
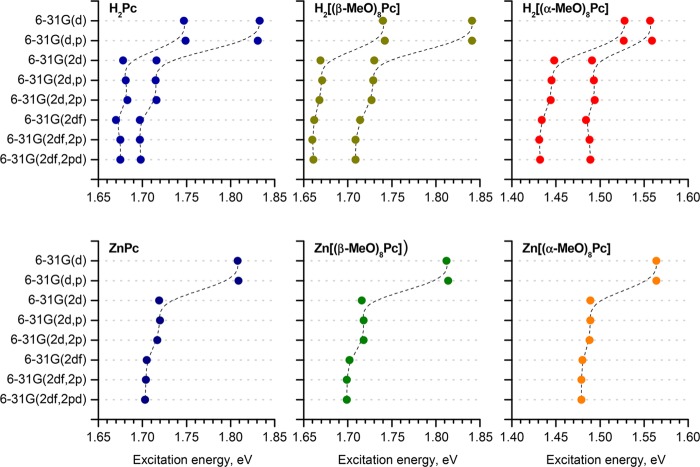
The effect of the extent of the polarization functions included into the double-ζ basis set was studied by using the BP86/def2-SVP gas-phase geometries with the CAM-B3LYP functional and 6-31G(d,p), 6-31G(2d), 6-31G(2d,p), 6-31G(2d,2p), 6-31G(2df), 6-31G(2df,2p), and 6-31G(2df,2pd) basis sets (Figure 10). It was found that on moving from 6-31G(d) to 6-31G(2d) basis sets, there is a 0.08–0.10 eV decrease of the Q-band excitation energies, while moving to 6-31G(2df) has a much weaker effect on the excitation energies of less than 0.02 eV. The addition of any amount of polarization functions to the hydrogen atoms was found to have a negligibly small effect on the Q-band excitation energies of less than 0.002 eV.
Figure 10.
Gas-phase excitation energies of the Q-bands of the model complexes calculated using the sTD-DFT method by using the CAM-B3LYP functional with various double-ζ basis sets. The geometries of the complexes were optimized in the gas phase at the BP86/def2-SVP level of theory.
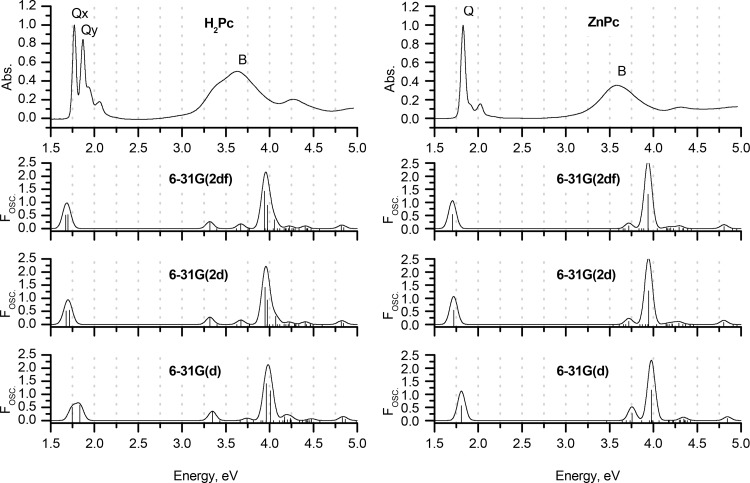
The trends observed in the predicted energies for the other higher-energy bands when different double-ζ basis sets [6-31G(d), 6-31G(2d), or 6-31G(2df)] are used are summarized in Figures 11–13. It can be clearly observed that the effects associated with the addition of more polarization functions into the basis sets are relatively minor. Again, it should be emphasized that although changing the basis sets does influence the predicted energies of the vertical excitations, it does not significantly affect the trends predicted in the spectral properties across the series of structurally related substituted free bases and metallophthalocyanines that were used in this study.
Figure 11.
Experimental UV–vis spectra of H2[(tBu)4Pc] and Zn[(tBu)4Pc]Pc in chloroform (TOP) and the sTD-DFT calculated spectra of H2Pc and ZnPc calculated by using the CAM-B3LYP functional with various double-ζ basis sets. The geometries of the complexes were optimized in the gas phase at the BP86/def2-SVP level of theory. The bandwidths in the simulated spectra were set to 0.05 eV.
Figure 13.
Experimental UV–vis spectra of H2[(α-BuO)8Pc] and Zn[(α-BuO)8Pc] in chloroform (TOP) and the sTD-DFT calculated spectra of H2[(α-MeO)8Pc] and Zn[(α-MeO)8Pc] calculated by using the CAM-B3LYP functional with various double-ζ basis sets. The geometries of the complexes were optimized in the gas phase at the BP86/def2-SVP level of theory. The bandwidths in the simulated spectra were set to 0.05 eV.
Figure 12.
Experimental UV–vis spectra of H2[(β-BuO)8Pc] and Zn[(β-BuO)8Pc] in chloroform (TOP) and the sTD-DFT calculated spectra of H2[(β-MeO)8Pc] and Zn[(β-MeO)8Pc] calculated by using the CAM-B3LYP functional with various double-ζ basis sets. The geometries of the complexes were optimized in the gas phase at the BP86/def2-SVP level of theory. The bandwidths in the simulated spectra were set to 0.05 eV.
The use of the sTDA and sTD-DFT approaches affords a spectacular speedup in the calculations in terms of the duration of the CIS module. In the present study, the “classical” TDA and TD-DFT calculations performed on eight parallel processes for the model complexes took 0.2–1 h to predict the 16 roots. Figure 14 provides the duration of the calculations for the Zn[(β-MeO)8Pc] model complex. The simplified sTDA and sTD-DFT approaches took less than 10 s to provide a notably larger number of roots, which is defined by the energy threshold (Ethresh = 5 eV) up to which configuration state functions (CSFs) are included.
Figure 14.
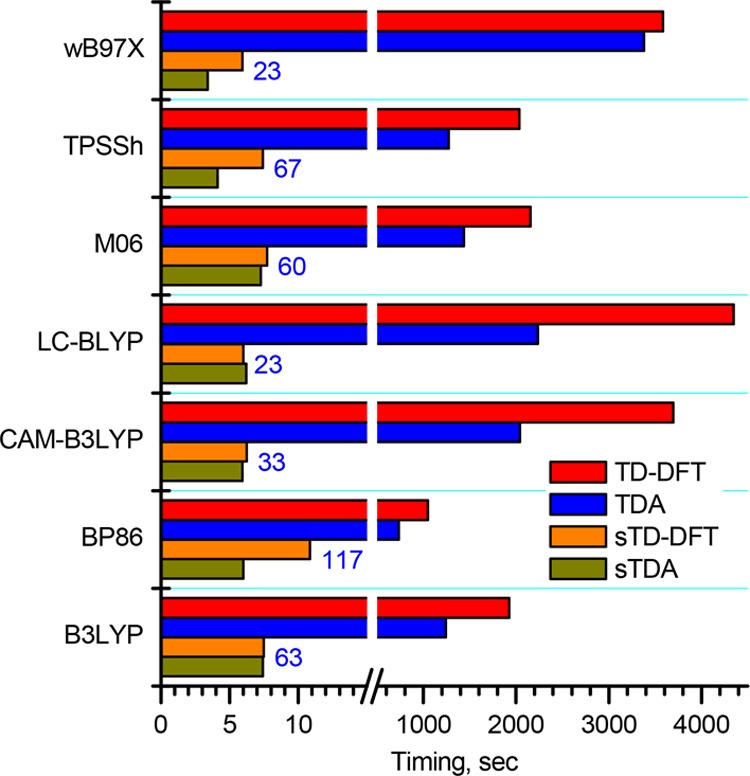
Durations observed for the CIS module of the gas-phase TD-DFT, TDA, sTD-DFT, and sTDA calculations performed for the Zn[(β-MeO)8Pc] model complex optimized in the gas phase at the BP86/def2-SVP level of theory. The number of roots for TDA and TD-DFT was set to 16, while the numbers marked in blue correspond to numbers used for the sTDA and sTD-DFT calculations, which depended on the number of orbitals taken into consideration for the calculations.
The introduction of a smaller Ethresh means that all excited configurations, which lie higher in energy, are neglected. This drastically reduces the amount of calculations required and results in the observed orders of magnitude speedup of sTD-DFT calculations.40 The drawback of this feature is the dependence of the absolute value of excitation energy on the Ethresh value because some correlation with other states can be neglected. We checked the trend in predicted Q-band energies for H2[(β-MeO)8Pc] and Zn[(β-MeO)8Pc] at a series of different Ethresh values (Figure 15). The Ethresh value has a notable effect on excitation energies, which systematically increase by 0.1 eV upon the increase of Ethresh from 4 to 6 eV. Nevertheless, the dependence trends for both compounds are nearly parallel, suggesting that correlations between known compounds and their sTD-DFT spectra can be used to determine an appropriate spectral shift for the prediction of spectra of unknown compounds.
Figure 15.
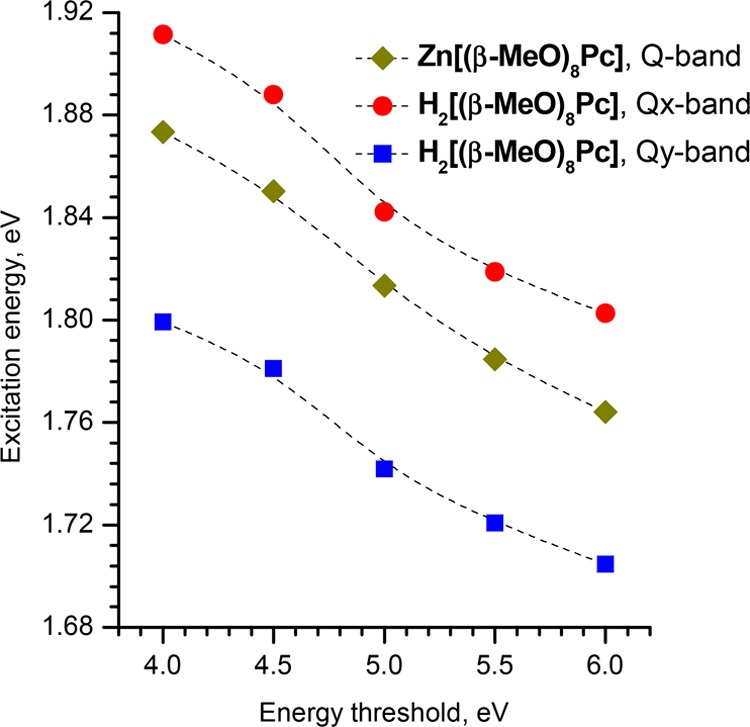
Dependence of the excitation energies found by gas-phase sTD-DFT at the CAM-B3LYP/6-31G(d) level of theory for H2[(β-MeO)8Pc] and Zn[(β-MeO)8Pc] on the energy threshold up to which configuration state functions (CSFs) are included.
2.3.4. Prediction of Vertical Excitations in the B-Region of the UV–Visible Spectra of Phthalocyanines
The errors associated with the prediction of s → –s and s → –a transitions (i.e., the B-bands) strongly depend on the molecule, and the methodology and functional selected. Moreover, these errors cannot be correlated with the accuracy of the prediction of the Q-bands. For example, using the sTD-DFT method at the CAM-B3LYP/6-31G(d) level, the predictions for the Q-bands of both H2Pc and ZnPc are particularly accurate. B-bands are predicted at 3.35 and 3.74 eV in the spectrum of H2Pc, which satisfactorily matches the position of the B-band in the experimental spectrum (broad absorption band with a maximum at 3.63 eV corresponding to an intense Faraday A1 term or a coupled pair of Faraday B0 terms in the MCD spectrum). However, when the same method is applied to ZnPc, the B-band is predicted to lie at 3.97 eV, while in contrast, the experimental value is 3.58 eV. Moving from computationally modest gas-phase calculations with double-ζ basis sets to augmented computational conditions that included more polarization functions did not improve the accuracy of B-band prediction (Figures 7–9 and Figures 1–3).
Again, it should be emphasized that the Q-band region, which is the most important from the standpoint of applications, can be predicted with a high degree of accuracy. However, neither full TD-DFT nor its simplified versions can provide a general description of the B-band region of phthalocyanine spectra, which can successfully be applied to any molecule due to the complex mixing of states that occurs in this energy region. It should be emphasized that this result cannot be improved significantly through the application of extended basis sets for initial geometry optimization or by introducing a solvation model. Therefore, further advances in theoretical calculations are still required to achieve the ultimate goal of “the possibility of employing a TD-DFT approach for the accurate prediction of vertical excitation energies in phthalocyanines within a large energy range”.54,64
3. Conclusions
The use of the calculated UV–visible absorption spectra of phthalocyanines to interpret experimental data and rationally design new chromophores for applications is a challenging task given the size of the molecules and the general need for fast and accurate computational approaches.
In the present study, a methodological survey to determine the relative merits of the full TD-DFT method and its Tamm–Dancoff modification (TDA), as well as the relatively new simplified sTD-DFT and sTDA implementations for the prediction of the UV–visible–NIR spectra of phthalocyanines is reported. To the best of our knowledge, the latter two methodologies have not previously been systematically tested on porphyrinoids.
Seven of the most popular exchange-correlation functionals were tested with four different approaches related to TD-DFT by running calculations for a set of model geometries. The best accuracy for the Q-band region was observed for both the unsubstituted and alkoxy-substituted phthalocyanine spectra when using the LC-BLYP and ωB97X range-separated hybrid functionals in the case of full TD-DFT and when using the CAM-B3LYP in a similar manner in the case of sTD-DFT. The description of the B-band region is much less accurate, and this problem still needs further theoretical work to make further advances in how calculations are carried out.
The overall results obtained for the selected series of model complexes emphasize the need to check the broad range of molecules to provide a benchmark for the reliability of DFT methods when dealing with phthalocyanines. Previously, such studies were typically performed on ZnPc(60,88−90) and this resulted in the successful prediction of its spectrum by the methods that are generally inapplicable for the substituted derivatives. This conclusion can also be drawn where the TD-DFT and sTDA calculations with the BP86 and M06 functionals are concerned since although they are characterized by relatively small errors for the prediction of the Q-bands (Table 1), these functionals are particularly inaccurate where the other bands in the spectra of substituted phthalocyanines are concerned.
As long as sTD-DFT predicts trends that match those observed experimentally across a series of compounds, the MO approach can still be used to rationalize the observed spectral and redox changes in terms of the energies of the frontier MOs. At that point, the faster calculation times should help to facilitate studies that would previously have been too expensive in processing time terms. Therefore, it is anticipated that this approach will be widely used in the years ahead so that desktop computers can be routinely used during the interpretation of UV–visible–NIR spectra of phthalocyanines and related macrocycles. Studies of this type will probably extend in future to the multidecker sandwich complexes of phthalocyanines and related macrocycles that are formed through covalent and coordination bonding and also to supramolecular assemblies.
4. Experimental Section
Phthalocyanines were synthesized using previously reported procedures.91−93 UV–vis and matrix-assisted laser desorption ionization time-of-flight (MALDI-TOF) mass spectra of the synthesized compounds were in agreement with the proposed structures. UV–vis spectra were measured with a Thermo Evolution 210 spectrometer in quartz cells with a 1 cm optical path. MALDI-TOF mass spectra were measured on a Bruker Daltonics Ultraflex spectrometer with 2,5-dihydroxybenzoic acid as the matrix. Magnetic circular dichroism (MCD) spectra were recorded on a Chirascan plus spectrodichrometer equipped with a permanent magnet, which produces magnetic fields of 1.0 T with both parallel and antiparallel fields.
The ORCA 4.0.1 package45,46 was used to carry out the geometry optimizations, and the four sets of spectral calculations were run by using the Windows 10 Pro operation system on a desktop computer fitted with a 3.7 GHz Intel Core i7-4820 K processor and 64 GB of random-access memory. All calculations were performed in eight parallel processes using the native Microsoft MPI. The Gabedit 2.3.0 program was used to prepare the input files and to follow the progress of the calculations,94 and the Chemissian 4.58 program (by L. Skripnikov) was used to analyze and visualize the results of the quantum-chemical calculations. For the current version, see www.chemissian.com.
The geometry optimizations for the series of model compounds were performed by using the BP86 functional with def2-SVP or def2-TZVP basis sets95 in gas phase or in chloroform within the SMD solvation model.68 Tight self-consistent field convergence criteria were set without symmetry constraints. The RIJCOSX approximation96,97 was used with auxiliary basis def2/J98 to accelerate the calculations without notable loss of accuracy. The geometry optimization was performed using Grimme’s atom-pairwise dispersion correction and Becke–Johnson damping (D3BJ),99 which is particularly important to reproduce the steric crowding of the eight neighboring MeO groups in nonperipherally substituted phthalocyanines.
The TDA, TD-DFT, sTDA, and sTD-DFT calculations were performed with 6-31G(d) basis set on the DFT-optimized structures by using a generalized gradient approximation (GGA) functional (BP86), two GGA hybrid functionals (B3LYP and TPSSh functionals), a meta-GGA functional (M06), and three range-separated hybrid functionals (CAM-B3LYP, LC-BLYP, and ωB97X).100,101 The TDA and TD-DFT approaches were used to predict 16 vertical excitations since this is typically sufficient for the interpretation of the Q-band, and CT- and B-regions of phthalocyanine spectra. The sTDA and sTD-DFT approaches were used to predict the vertical transitions with energies below 5 eV with the RIJCOSX approximation applied to accelerate the calculations. In each case, the output files are provided as Supporting Information, along with detailed information about energies, oscillator strengths (Fosc.), wave functions of corresponding excitations, and absorption spectra via transition electric dipole moments (with components of the electronic transition dipole moment Tx, Ty, and Tz provided in atomic units along with the square of the transition moment T2). The sTDA and sTD-DFT output files contain the length and velocity expressions for the oscillator and rotatory strengths—fL, fV, RL, and RV, respectively. The influence of various factors on the sTD-DFT calculations was analyzed by using the CAM-B3LYP functional with a range of different double-ζ basis sets 6-31G(d,p), 6-31G(2d), 6-31G(2d,p), 6-31G(2d,2p), 6-31G(2df), 6-31G(2df,2p), and 6-31G(2df,2pd), as well as triple-ζ 6-311G(d) basis sets either in the gas phase or in chloroform (SMD model) with both BP86/def2-SVP and BP86/def2-TZVP optimized geometries.
Acknowledgments
This work was supported by the Russian Science Foundation (grant 14-13-01373_p). The authors are grateful to the ORCA forum team (https://orcaforum.kofo.mpg.de/index.php), as well as to Prof. Stefan Grimme and Dr. Christoph Bannwarth for valuable comments.
Supporting Information Available
The Supporting Information is available free of charge on the ACS Publications website at DOI: 10.1021/acsomega.8b03500.
Optimized geometries (Section S1); orbital diagrams (Section S2); and summary of TDA, TD-DFT, sTDA, and sTD-DFT calculations performed for gas-phase BP86/def2-SVP+D3BJ optimized model phthalocyanines (Sections S3–S8) (PDF)
The authors declare no competing financial interest.
Supplementary Material
References
- Ragoussi M.-E.; Torres T. Modern Synthetic Tools Toward the Preparation of Sophisticated Phthalocyanine-Based Photoactive Systems. Chem. Asian J. 2014, 9, 2676–2707. 10.1002/asia.201402311. [DOI] [PubMed] [Google Scholar]
- Ragoussi M.; Ince M.; Torres T. Recent Advances in Phthalocyanine-Based Sensitizers for Dye-Sensitized Solar Cells. Eur. J. Org. Chem. 2013, 2013, 6475–6489. 10.1002/ejoc.201301009. [DOI] [Google Scholar]
- Bottari G.; Trukhina O.; Ince M.; Torres T. Towards Artificial Photosynthesis: Supramolecular, Donor–acceptor, Porphyrin- and Phthalocyanine/Carbon Nanostructure Ensembles. Coord. Chem. Rev. 2012, 256, 2453–2477. 10.1016/j.ccr.2012.03.011. [DOI] [Google Scholar]
- Martínez-Díaz M. V.; Ince M.; Torres T. Phthalocyanines: Colorful Macroheterocyclic Sensitizers for Dye-Sensitized Solar Cells. Monatsh. Chem. 2011, 142, 699–707. 10.1007/s00706-010-0431-0. [DOI] [Google Scholar]
- Martínez-Díaz M. V.; de la Torre G.; Torres T. Lighting Porphyrins and Phthalocyanines for Molecular Photovoltaics. Chem. Commun. 2010, 46, 7090–7108. 10.1039/c0cc02213f. [DOI] [PubMed] [Google Scholar]
- Rio Y.; Salomé Rodríguez-Morgade M.; Torres T. Modulating the Electronic Properties of Porphyrinoids: A Voyage from the Violet to the Infrared Regions of the Electromagnetic Spectrum. Org. Biomol Chem. 2008, 6, 1877–1894. 10.1039/b800617b. [DOI] [PubMed] [Google Scholar]
- Claessens C. G.; Hahn U.; Torres T. Phthalocyanines: From Outstanding Electronic Properties to Emerging Applications. Chem. Rec. 2008, 8, 75–97. 10.1002/tcr.20139. [DOI] [PubMed] [Google Scholar]
- de la Torre G.; Claessens C. G.; Torres T. Phthalocyanines: Old Dyes, New Materials. Putting Color in Nanotechnology. Chem. Commun. 2007, 2000–2015. 10.1039/B614234F. [DOI] [PubMed] [Google Scholar]
- Wöhrle D.; Schnurpfeil G.; Makarov S. G.; Kazarin A.; Suvorova O. N. Practical Applications of Phthalocyanines – from Dyes and Pigments to Materials for Optical, Electronic and Photo-Electronic Devices. Macroheterocycles 2012, 5, 191–202. 10.6060/mhc2012.120990w. [DOI] [Google Scholar]
- Safonova E. A.; Martynov A. G.; Nefedov S. E.; Kirakosyan G. A.; Gorbunova Y. G.; Tsivadze A. Y. A Molecular Chameleon: Reversible PH- and Cation-Induced Control of the Optical Properties of Phthalocyanine-Based Complexes in the Visible and Near-Infrared Spectral Ranges. Inorg. Chem. 2016, 55, 2450–2459. 10.1021/acs.inorgchem.5b02831. [DOI] [PubMed] [Google Scholar]
- Gouterman M.Optical Spectra and Electronic Structure of Porphyrins and Related Rings. In The Porphyrins; Dolphin D., Ed.; Academic Press: New York, 1978; Vol. III, pp 1–165. [Google Scholar]
- Gouterman M. Spectra of Porphyrins. J. Mol. Spectrosc. 1961, 6, 138–163. 10.1016/0022-2852(61)90236-3. [DOI] [Google Scholar]
- Mack J.; Kobayashi N. Low Symmetry Phthalocyanines and Their Analogues. Chem. Rev. 2011, 111, 281–321. 10.1021/cr9003049. [DOI] [PubMed] [Google Scholar]
- Kobayashi N.; Ogata H.; Nonaka N.; Luk’yanets E. A. Effect of Peripheral Substitution on the Electronic Absorption and Fluorescence Spectra of Metal-Free and Zinc Phthalocyanines. Chem. – Eur. J. 2003, 9, 5123–5134. 10.1002/chem.200304834. [DOI] [PubMed] [Google Scholar]
- Mack J.; Kobayashi N.; Stillman M. J. Re-Examination of the Emission Properties of Alkoxy- and Thioalkyl-Substituted Phthalocyanines. J. Inorg. Biochem. 2010, 104, 310–317. 10.1016/j.jinorgbio.2009.09.018. [DOI] [PubMed] [Google Scholar]
- Andzelm J.; Rawlett A. M.; Orlicki J. A.; Snyder J. F.; Baldridge K. K. Optical Properties of Phthalocyanine and Naphthalocyanine Compounds †. J. Chem. Theory Comput. 2007, 3, 870–877. 10.1021/ct700017b. [DOI] [PubMed] [Google Scholar]
- Kobayashi N.Synthesis and Spectroscopic Properties of Phthalocyanine Analogs. In The Porphyrin Handbook; Kadish K. M., Smith K. M., Guilard R., Eds.; Elsevier: New York, 2003; Vol. 15, pp 161–262. [Google Scholar]
- Ishii K.; Kobayashi N.. The Photophysical Properties of Phthalocyanines and Related Compounds. In The Porphyrin Handbook; Kadish K. M., Smith K. M., Guilard R., Eds.; Academic Press: New York, 2003; Vol. 16, pp 1–42. [Google Scholar]
- Stillman M.; Mack J.; Kobayashi N. Theoretical Aspects of the Spectroscopy of Porphyrins and Phthalocyanines. J. Porphyrins Phthalocyanines 2002, 06, 296–300. 10.1142/S108842460200035X. [DOI] [Google Scholar]
- Martynov A. G.; Mack J.; Ngoy B. P.; Nyokong T.; Gorbunova Y. G.; Tsivadze A. Y. Electronic Structure and NH-Tautomerism of a Novel Metal-Free Phenanthroline-Annelated Phthalocyanine. Dyes Pigm. 2017, 140, 469–479. 10.1016/j.dyepig.2017.01.072. [DOI] [Google Scholar]
- Neese F. Prediction of Molecular Properties and Molecular Spectroscopy with Density Functional Theory: From Fundamental Theory to Exchange-Coupling. Coord. Chem. Rev. 2009, 253, 526–563. 10.1016/j.ccr.2008.05.014. [DOI] [Google Scholar]
- Fabian J. TD-DFT-Calculations of Vis/NIR Absorbing Compounds. Dyes Pigm. 2010, 84, 36–53. 10.1016/j.dyepig.2009.06.008. [DOI] [Google Scholar]
- Jacquemin D.; Wathelet V.; Perpète E. A.; Adamo C. Extensive TD-DFT Benchmark: Singlet-Excited States of Organic Molecules. J. Chem. Theory Comput. 2009, 5, 2420–2435. 10.1021/ct900298e. [DOI] [PubMed] [Google Scholar]
- Tsipis A. C. DFT Flavor of Coordination Chemistry. Coord. Chem. Rev. 2014, 272, 1–29. 10.1016/j.ccr.2014.02.023. [DOI] [Google Scholar]
- Mack J.; Sosa-Vargas L.; Coles S. J.; Tizzard G. J.; Chambrier I.; Cammidge A. N.; Cook M. J.; Kobayashi N. Synthesis, Characterization, MCD Spectroscopy, and TD-DFT Calculations of Copper-Metalated Nonperipherally Substituted Octaoctyl Derivatives of Tetrabenzotriazaporphyrin, Cis- and Trans-Tetrabenzodiazaporphyrin, Tetrabenzomonoazaporphyrin, and Tetrabenz. Inorg. Chem. 2012, 51, 12820–12833. 10.1021/ic301712h. [DOI] [PubMed] [Google Scholar]
- Chidawanyika W.; Mack J.; Shimizu S.; Kobayashi N.; Nyokong T. Effect of Peripheral Fused Ring Substitution on the Optical Spectroscopy and Electronic Structure of Metal Phthalocyanine Complexes. J. Porphyrins Phthalocyanines 2009, 13, 1053–1062. 10.1142/S1088424609001339. [DOI] [Google Scholar]
- Mack J.; Bunya M.; Shimizu Y.; Uoyama H.; Komobuchi N.; Okujima T.; Uno H.; Ito S.; Stillman M. J.; Ono N.; et al. Application of MCD Spectroscopy and TD-DFT to Nonplanar Core-Modified Tetrabenzoporphyrins: Effect of Reduced Symmetry on Nonplanar Porphyrinoids. Chem. – Eur. J 2008, 14, 5001–5020. 10.1002/chem.200701611. [DOI] [PubMed] [Google Scholar]
- Mack J.; Kobayashi N.; Stillman M. J. Magnetic Circular Dichroism Spectroscopy and TD-DFT Calculations of Metal Phthalocyanine Anion and Cation Radical Species. J. Porphyrins Phthalocyanines 2006, 10, 1219–1237. 10.1142/S1088424606000594. [DOI] [Google Scholar]
- Mack J.; Asano Y.; Kobayashi N.; Stillman M. J. Application of MCD Spectroscopy and TD-DFT to a Highly Non-Planar Porphyrinoid Ring System. New Insights on Red-Shifted Porphyrinoid Spectral Bands. J. Am. Chem. Soc. 2005, 127, 17697–17711. 10.1021/ja0540728. [DOI] [PubMed] [Google Scholar]
- Campetella M.; Maschietto F.; Frisch M. J.; Scalmani G.; Ciofini I.; Adamo C. Charge Transfer Excitations in TD-DFT: A Ghost-Hunter Index. J. Comput. Chem. 2017, 38, 2151–2156. 10.1002/jcc.24862. [DOI] [PubMed] [Google Scholar]
- Kovyrshin A.; De Angelis F.; Neugebauer J. Selective TD-DFT with Automatic Removal of Ghost Transitions: Application to a Perylene-Dye-Sensitized Solar Cell Model. Phys. Chem. Chem. Phys. 2012, 14, 8608. 10.1039/c2cp40840f. [DOI] [PubMed] [Google Scholar]
- Casida M. E.; Huix-Rotllant M. Progress in Time-Dependent Density-Functional Theory. Annu. Rev. Phys. Chem. 2012, 63, 287–323. 10.1146/annurev-physchem-032511-143803. [DOI] [PubMed] [Google Scholar]
- Caricato M.; Trucks G. W.; Frisch M. J.; Wiberg K. B. Electronic Transition Energies: A Study of the Performance of a Large Range of Single Reference Density Functional and Wave Function Methods on Valence and Rydberg States Compared to Experiment. J. Chem. Theory Comput. 2010, 6, 370–383. 10.1021/ct9005129. [DOI] [PubMed] [Google Scholar]
- Kuritz N.; Stein T.; Baer R.; Kronik L. Charge-Transfer-Like Π → π* Excitations in Time-Dependent Density Functional Theory: A Conundrum and Its Solution. J. Chem. Theory Comput. 2011, 7, 2408–2415. 10.1021/ct2002804. [DOI] [PubMed] [Google Scholar]
- Hirata S.; Head-Gordon M. Time-Dependent Density Functional Theory within the Tamm–Dancoff Approximation. Chem. Phys. Lett. 1999, 314, 291–299. 10.1016/S0009-2614(99)01149-5. [DOI] [Google Scholar]
- Wang Y.-L.; Wu G.-S. Improving the TD-DFT Calculation of Low-Lying Excited States for Polycyclic Aromatic Hydrocarbons Using the Tamm–Dancoff Approximation. Int. J. Quantum Chem. 2008, 108, 430–439. 10.1002/qua.21510. [DOI] [Google Scholar]
- Bannwarth C.; Grimme S. A Simplified Time-Dependent Density Functional Theory Approach for Electronic Ultraviolet and Circular Dichroism Spectra of Very Large Molecules. Comput. Theor. Chem. 2014, 1040–1041, 45–53. 10.1016/j.comptc.2014.02.023. [DOI] [Google Scholar]
- Grimme S. A Simplified Tamm-Dancoff Density Functional Approach for the Electronic Excitation Spectra of Very Large Molecules. J. Chem. Phys. 2013, 138, 244104 10.1063/1.4811331. [DOI] [PubMed] [Google Scholar]
- Bannwarth C.; Seibert J.; Grimme S. Electronic Circular Dichroism of [16]Helicene With Simplified TD-DFT: Beyond the Single Structure Approach. Chirality 2016, 28, 365–369. 10.1002/chir.22594. [DOI] [PubMed] [Google Scholar]
- Risthaus T.; Hansen A.; Grimme S. Excited States Using the Simplified Tamm–Dancoff-Approach for Range-Separated Hybrid Density Functionals: Development and Application. Phys. Chem. Chem. Phys. 2014, 16, 14408–14419. 10.1039/C3CP54517B. [DOI] [PubMed] [Google Scholar]
- Bursch M.; Hansen A.; Grimme S. Fast and Reasonable Geometry Optimization of Lanthanoid Complexes with an Extended Tight Binding Quantum Chemical Method. Inorg. Chem. 2017, 56, 12485–12491. 10.1021/acs.inorgchem.7b01950. [DOI] [PubMed] [Google Scholar]
- de Wergifosse M.; Grimme S. Nonlinear-Response Properties in a Simplified Time-Dependent Density Functional Theory (STD-DFT) Framework: Evaluation of the First Hyperpolarizability. J. Chem. Phys. 2018, 149, 024108 10.1063/1.5037665. [DOI] [PubMed] [Google Scholar]
- Caldeweyher E.; Brandenburg J. G. Simplified DFT Methods for Consistent Structures and Energies of Large Systems. J. Phys.: Condens. Matter 2018, 30, 213001 10.1088/1361-648X/aabcfb. [DOI] [PubMed] [Google Scholar]
- Seibert J.; Bannwarth C.; Grimme S. Biomolecular Structure Information from High-Speed Quantum Mechanical Electronic Spectra Calculation. J. Am. Chem. Soc. 2017, 139, 11682–11685. 10.1021/jacs.7b05833. [DOI] [PubMed] [Google Scholar]
- Neese F. The ORCA Program System. Wiley Interdiscip. Rev.: Comput. Mol. Sci. 2012, 2, 73–78. 10.1002/wcms.81. [DOI] [Google Scholar]
- Neese F. Software Update: The ORCA Program System, Version 4.0. Wiley Interdiscip. Rev.: Comput. Mol. Sci. 2018, 8, e1327 10.1002/wcms.1327. [DOI] [Google Scholar]
- Becke A. D. Density-Functional Exchange-Energy Approximation with Correct Asymptotic Behavior. Phys. Rev. A 1988, 38, 3098–3100. 10.1103/PhysRevA.38.3098. [DOI] [PubMed] [Google Scholar]
- Perdew J. P. Density-Functional Approximation for the Correlation Energy of the Inhomogeneous Electron Gas. Phys. Rev. B 1986, 33, 8822–8824. 10.1103/PhysRevB.33.8822. [DOI] [PubMed] [Google Scholar]
- Stephens P. J.; Devlin F. J.; Chabalowski C. F.; Frisch M. J. Ab Initio Calculation of Vibrational Absorption and Circular Dichroism Spectra Using Density Functional Force Fields. J. Phys. Chem. 1994, 98, 11623–11627. 10.1021/j100096a001. [DOI] [Google Scholar]
- Staroverov V. N.; Scuseria G. E.; Tao J.; Perdew J. P. Comparative Assessment of a New Nonempirical Density Functional: Molecules and Hydrogen-Bonded Complexes. J. Chem. Phys. 2003, 119, 12129–12137. 10.1063/1.1626543. [DOI] [Google Scholar]
- Zhao Y.; Truhlar D. G. The M06 Suite of Density Functionals for Main Group Thermochemistry, Thermochemical Kinetics, Noncovalent Interactions, Excited States, and Transition Elements: Two New Functionals and Systematic Testing of Four M06-Class Functionals and 12 Other Function. Theor. Chem. Acc. 2008, 120, 215–241. 10.1007/s00214-007-0310-x. [DOI] [Google Scholar]
- Yanai T.; Tew D. P.; Handy N. C. A New Hybrid Exchange–correlation Functional Using the Coulomb-Attenuating Method (CAM-B3LYP). Chem. Phys. Lett. 2004, 393, 51–57. 10.1016/j.cplett.2004.06.011. [DOI] [Google Scholar]
- Chai J.-D.; Head-Gordon M. Systematic Optimization of Long-Range Corrected Hybrid Density Functionals. J. Chem. Phys. 2008, 128, 084106 10.1063/1.2834918. [DOI] [PubMed] [Google Scholar]
- Nemykin V. N.; Hadt R. G.; Belosludov R. V.; Mizuseki H.; Kawazoe Y. Influence of Molecular Geometry, Exchange-Correlation Functional, and Solvent Effects in the Modeling of Vertical Excitation Energies in Phthalocyanines Using Time-Dependent Density Functional Theory (TDDFT) and Polarized Continuum Model TDDFT Methods: Can Modern Computational Chemistry Methods Explain Experimental Controversies?. J. Phys. Chem. A 2007, 111, 12901–12913. 10.1021/jp0759731. [DOI] [PubMed] [Google Scholar]
- Gao Y.; Solntsev P. V.; Nemykin V. N. Comparative Electronic Structures and UV-Vis Spectra of Tribenzosubporphyrin, Tribenzomonoazasubporphyrin, Tribenzodiazasubporphyrin, and Subphthalocyanine: Insight from DFT and TD-DFT Calculations. J. Mol. Graphics Modell. 2012, 38, 369–374. 10.1016/j.jmgm.2012.09.003. [DOI] [PubMed] [Google Scholar]
- Sumimoto M.; Kawashima Y.; Yokogawa D.; Hori K.; Fujimoto H. Influences of Dispersion and Long-Range Corrections on Molecular Structures of Three Types of Lithium Phthalocyanine Dimer. Int. J. Quantum Chem. 2013, 113, 272–276. 10.1002/qua.24072. [DOI] [Google Scholar]
- Yanagisawa S.; Yasuda T.; Inagaki K.; Morikawa Y.; Manseki K.; Yanagida S. Intermolecular Interaction as the Origin of Red Shifts in Absorption Spectra of Zinc-Phthalocyanine from First-Principles. J. Phys. Chem. A 2013, 117, 11246–11253. 10.1021/jp407608w. [DOI] [PubMed] [Google Scholar]
- Rhoda H. M.; Crandall L. A.; Geier G. R.; Ziegler C. J.; Nemykin V. N. Combined MCD/DFT/TD-DFT Study of the Electronic Structure of Axially Pyridine Coordinated Metallocorroles. Inorg. Chem. 2015, 54, 4652–4662. 10.1021/ic502946t. [DOI] [PubMed] [Google Scholar]
- Theisen R. F.; Huang L.; Fleetham T.; Adams J. B.; Li J. Ground and Excited States of Zinc Phthalocyanine, Zinc Tetrabenzoporphyrin, and Azaporphyrin Analogs Using DFT and TD-DFT with Franck-Condon Analysis. J. Chem. Phys. 2015, 142, 094310 10.1063/1.4913757. [DOI] [PubMed] [Google Scholar]
- Fischer S. A.; Cramer C. J.; Govind N. Excited-State Absorption from Real-Time Time-Dependent Density Functional Theory: Optical Limiting in Zinc Phthalocyanine. J. Phys. Chem. Lett. 2016, 7, 1387–1391. 10.1021/acs.jpclett.6b00282. [DOI] [PubMed] [Google Scholar]
- Rhoda H. M.; Akhigbe J.; Ogikubo J.; Sabin J. R.; Ziegler C. J.; Brückner C.; Nemykin V. N. Magnetic Circular Dichroism Spectroscopy of Meso-Tetraphenylporphyrin-Derived Hydroporphyrins and Pyrrole-Modified Porphyrins. J. Phys. Chem. A 2016, 120, 5805–5815. 10.1021/acs.jpca.6b04618. [DOI] [PubMed] [Google Scholar]
- Doble S.; Osinski A. J.; Holland S. M.; Fisher J. M.; Geier G. R.; Belosludov R. V.; Ziegler C. J.; Nemykin V. N. Magnetic Circular Dichroism of Transition-Metal Complexes of Perfluorophenyl-N-Confused Porphyrins: Inverting Electronic Structure through a Proton. J. Phys. Chem. A 2017, 121, 3689–3698. 10.1021/acs.jpca.7b02908. [DOI] [PubMed] [Google Scholar]
- Pereira T. L.; Leal L. A.; da Cunha W. F.; Timóteo de Sousa Júnior R. T.; Ribeiro Junior L. A.; Antonio da Silva Filho D. Optimally Tuned Functionals Improving the Description of Optical and Electronic Properties of the Phthalocyanine Molecule. J. Mol. Model. 2017, 23, 71 10.1007/s00894-017-3246-7. [DOI] [PubMed] [Google Scholar]
- Belosludov R. V.; Nevonen D.; Rhoda H. M.; Sabin J. R.; Nemykin V. N. Simultaneous Prediction of the Energies of Qx and Qy Bands and Intramolecular Charge-Transfer Transitions in Benzoannulated and Non-Peripherally Substituted Metal-Free Phthalocyanines and Their Analogues: No Standard TD-DFT Silver Bullet Yet. J. Phys. Chem. A 2019, 123, 132–152. 10.1021/acs.jpca.8b07647. [DOI] [PubMed] [Google Scholar]
- Hirao H. Which DFT Functional Performs Well in the Calculation of Methylcobalamin? Comparison of the B3LYP and BP86 Functionals and Evaluation of the Impact of Empirical Dispersion Correction. J. Phys. Chem. A 2011, 115, 9308–9313. 10.1021/jp2052807. [DOI] [PubMed] [Google Scholar]
- Nemykin V. N.; Sabin J. R. Profiling Energetics and Spectroscopic Signatures in Prototropic Tautomers of Asymmetric Phthalocyanine Analogues. J. Phys. Chem. A 2012, 116, 7364–7371. 10.1021/jp304386x. [DOI] [PubMed] [Google Scholar]
- Colomban C.; Kudrik E. V.; Briois V.; Shwarbrick J. C.; Sorokin A. B.; Afanasiev P. X-Ray Absorption and Emission Spectroscopies of X-Bridged Diiron Phthalocyanine Complexes (FePc)2X (X = C, N, O) Combined with DFT Study of (FePc)2X and Their High-Valent Diiron Oxo Complexes. Inorg. Chem. 2014, 53, 11517–11530. 10.1021/ic501463q. [DOI] [PubMed] [Google Scholar]
- Marenich A. V.; Cramer C. J.; Truhlar D. G. Universal Solvation Model Based on Solute Electron Density and on a Continuum Model of the Solvent Defined by the Bulk Dielectric Constant and Atomic Surface Tensions. J. Phys. Chem. B 2009, 113, 6378–6396. 10.1021/jp810292n. [DOI] [PubMed] [Google Scholar]
- Jiang H.; Hu P.; Ye J.; Ganguly R.; Li Y.; Long Y.; Fichou D.; Hu W.; Kloc C. Hole Mobility Modulation in Single-Crystal Metal Phthalocyanines by Changing the Metal-π/π-π Interactions. Angew. Chem., Int. Ed. 2018, 57, 10112–10117. 10.1002/anie.201803363. [DOI] [PubMed] [Google Scholar]
- Gao Y.; Chen Y.; Li R.; Bian Y.; Li X.; Jiang J. Nonperipherally Octa(Butyloxy)-Substituted Phthalocyanine Derivatives with Good Crystallinity: Effects of Metal-Ligand Coordination on the Molecular Structure, Internal Structure, and Dimensions of Self-Assembled Nanostructures. Chem. – Eur. J. 2009, 15, 13241–13252. 10.1002/chem.200901722. [DOI] [PubMed] [Google Scholar]
- Stillman M. J.Theoretical Aspects of the Optical Spectroscopy of Porphyrinoids. Handbook of Porphyrin Science; World Scientific Publ. Co. Pte Ltd., 2011. [Google Scholar]
- Mack J. Expanded, Contracted, and Isomeric Porphyrins: Theoretical Aspects. Chem. Rev. 2017, 117, 3444–3478. 10.1021/acs.chemrev.6b00568. [DOI] [PubMed] [Google Scholar]
- Michl J. Magnetic Circular Dichroism of Aromatic Molecules. Tetrahedron 1984, 40, 3845–3934. 10.1016/S0040-4020(01)99999-5. [DOI] [Google Scholar]
- Michl J. Electronic Structure of Aromatic π-Electron Systems as Reflected in Their MCD Spectra. Pure Appl. Chem. 1980, 52, 1549–1563. 10.1351/pac198052061549. [DOI] [Google Scholar]
- Michl J. Magnetic Circular Dichroism of Cyclic .Pi.-Electron Systems. 1. Algebraic Solution of the Perimeter Model for the A and B Terms of High-Symmetry Systems with a (4N + 2)-Electron [n]Annulene Perimeter. J. Am. Chem. Soc. 1978, 100, 6801–6811. 10.1021/ja00490a001. [DOI] [Google Scholar]
- Mack J.; Stillman M. J. Assignment of the Optical Spectra of Metal Phthalocyanines through Spectral Band Deconvolution Analysis and ZINDO Calculations. Coord. Chem. Rev. 2001, 219–221, 993–1032. 10.1016/S0010-8545(01)00394-0. [DOI] [Google Scholar]
- Nyokong T.; Gasyna Z.; Stillman M. J. Analysis of the Absorption and Magnetic Circular Dichroism Spectra of Zinc Phthalocyanine and the .Pi.-Cation-Radical Species [ZnPc(1-)].Cntdot.+. Inorg. Chem. 1987, 26, 1087–1095. 10.1021/ic00254a025. [DOI] [Google Scholar]
- Keizer S. P.; Mack J.; Bench B. A.; Gorun S. M.; Stillman M. J. Spectroscopy and Electronic Structure of Electron Deficient Zinc Phthalocyanines. J. Am. Chem. Soc. 2003, 125, 7067–7085. 10.1021/ja0299710. [DOI] [PubMed] [Google Scholar]
- Simpson S.; Van Fleet A.; Zurek E. A Computational Investigation of a Molecular Switch. J. Chem. Educ. 2013, 90, 1528–1532. 10.1021/ed400278x. [DOI] [Google Scholar]
- Mack J.; Stillman M. J.; Kobayashi N. Application of MCD Spectroscopy to Porphyrinoids. Coord. Chem. Rev. 2007, 251, 429–453. 10.1016/j.ccr.2006.05.011. [DOI] [Google Scholar]
- Kobayashi N.; Muranaka A.; Mack J.. Circular Dichroism and Magnetic Circular Dichroism Spectroscopy for Organic Chemists; Royal Society of Chemistry: London, 2011. [Google Scholar]
- Van Cott T. C.; Rose J. L.; Misener G. C.; Williamson B. E.; Schrimpf A. E.; Boyle M. E.; Schatz P. N. Magnetic Circular Dichroism and Absorption Spectrum of Zinc Phthalocyanine in an Argon Matrix between 14700 and 74000 cm-1. J. Phys. Chem. 1989, 93, 2999–3011. 10.1021/j100345a028. [DOI] [Google Scholar]
- Schaffer A. M.; Gouterman M.; Davidson E. R. Porphyrins XXVIII. Extended Hückel Calculations on Metal Phthalocyanines and Tetrazaporphins. Theor. Chim. Acta 1973, 30, 9–30. 10.1007/BF00527632. [DOI] [Google Scholar]
- Nguyen K. A.; Pachter R. Ground State Electronic Structures and Spectra of Zinc Complexes of Porphyrin, Tetraazaporphyrin, Tetrabenzoporphyrin, and Phthalocyanine: A Density Functional Theory Study. J. Chem. Phys. 2001, 114, 10757–10767. 10.1063/1.1370064. [DOI] [Google Scholar]
- Safonova E. A.; Martynov A. G.; Zolotarevskii V. I.; Nefedov S. E.; Gorbunova Y. G.; Tsivadze A. Y. Design of UV-Vis-NIR Panchromatic Crown-Phthalocyanines with Controllable Aggregation. Dalton Trans. 2015, 44, 1366–1378. 10.1039/C4DT02759K. [DOI] [PubMed] [Google Scholar]
- Mack J.; Mkhize S.; Safonova E. A.; Martynov A. G.; Gorbunova Y. G.; Tsivadze A. Y.; Nyokong T. MCD Spectroscopy and TD-DFT Calculations of Magnesium Tetra-(15-Crown-5-Oxanthreno)-Phthalocyanine. J. Porphyrins Phthalocyanines 2016, 20, 505–513. 10.1142/S1088424616500322. [DOI] [Google Scholar]
- Pastore M.; Mosconi E.; De Angelis F.; Grätzel M. A Computational Investigation of Organic Dyes for Dye-Sensitized Solar Cells: Benchmark, Strategies, and Open Issues. J. Phys. Chem. C 2010, 114, 7205–7212. 10.1021/jp100713r. [DOI] [Google Scholar]
- Gao Y.; Nemykin V. N. Modeling of the Energies and Splitting of the Qx and Qy Bands in Positional Isomers of Zinc Pyridinoporphyrazines by TD-DFT Approach: Can TD-DFT Help Distinguishing the Structural Isomers?. J. Mol. Graphics Modell. 2013, 42, 73–80. 10.1016/j.jmgm.2013.03.002. [DOI] [PubMed] [Google Scholar]
- Tussupbayev S.; Govind N.; Lopata K.; Cramer C. J. Comparison of Real-Time and Linear-Response Time-Dependent Density Functional Theories for Molecular Chromophores Ranging from Sparse to High Densities of States. J. Chem. Theory Comput. 2015, 11, 1102–1109. 10.1021/ct500763y. [DOI] [PubMed] [Google Scholar]
- Ueno L. T.; Jayme C. C.; Silva L. R.; Pereira E. B.; de Oliveira S. M.; Machado A. E. H. Photophysics and Spectroscopic Properties of Zinc Phthalocyanine Revisited Using Quantum Chemistry. J. Braz. Chem. Soc. 2012, 23, 2237–2247. 10.1590/S0103-50532012001200013. [DOI] [Google Scholar]
- Cidlina A.; Svec J.; Ludvová L.; Kuneš J.; Zimcik P.; Novakova V. Predominant Effect of Connecting Atom and Position of Substituents on Azomethine Nitrogens’ Basicity in Phthalocyanines. J. Porphyrins Phthalocyanines 2016, 20, 1122–1133. 10.1142/S1088424616500747. [DOI] [Google Scholar]
- Lee J. U.; Kim Y. D.; Jo J. W.; Kim J. P.; Jo W. H. Efficiency Enhancement of P3HT/PCBM Bulk Heterojunction Solar Cells by Attaching Zinc Phthalocyanine to the Chain-End of P3HT. J. Mater. Chem. 2011, 21, 17209. 10.1039/c1jm11563d. [DOI] [Google Scholar]
- Li R.; Zhang X.; Zhu P.; Ng D. K. P.; Kobayashi N.; Jiang J. Electron-Donating or -Withdrawing Nature of Substituents Revealed by the Electrochemistry of Metal-Free Phthalocyanines. Inorg. Chem. 2006, 45, 2327–2334. 10.1021/ic051931k. [DOI] [PubMed] [Google Scholar]
- Allouche A.-R. Gabedit-A Graphical User Interface for Computational Chemistry Softwares. J. Comput. Chem. 2011, 32, 174–182. 10.1002/jcc.21600. [DOI] [PubMed] [Google Scholar]
- Weigend F.; Ahlrichs R. Balanced Basis Sets of Split Valence, Triple Zeta Valence and Quadruple Zeta Valence Quality for H to Rn: Design and Assessment of Accuracy. Phys. Chem. Chem. Phys. 2005, 7, 3297. 10.1039/b508541a. [DOI] [PubMed] [Google Scholar]
- Izsák R.; Neese F. An Overlap Fitted Chain of Spheres Exchange Method. J. Chem. Phys. 2011, 135, 144105 10.1063/1.3646921. [DOI] [PubMed] [Google Scholar]
- Neese F.; Olbrich G. Efficient Use of the Resolution of the Identity Approximation in Time-Dependent Density Functional Calculations with Hybrid Density Functionals. Chem. Phys. Lett. 2002, 362, 170–178. 10.1016/S0009-2614(02)01053-9. [DOI] [Google Scholar]
- Weigend F. Accurate Coulomb-Fitting Basis Sets for H to Rn. Phys. Chem. Chem. Phys. 2006, 8, 1057. 10.1039/b515623h. [DOI] [PubMed] [Google Scholar]
- Grimme S.; Ehrlich S.; Goerigk L. Effect of the Damping Function in Dispersion Corrected Density Functional Theory. J. Comput. Chem. 2011, 32, 1456–1465. 10.1002/jcc.21759. [DOI] [PubMed] [Google Scholar]
- Hehre W. J.; Ditchfield R.; Pople J. A. Self-Consistent Molecular Orbital Methods. XII. Further Extensions of Gaussian—Type Basis Sets for Use in Molecular Orbital Studies of Organic Molecules. J. Chem. Phys. 1972, 56, 2257. 10.1063/1.1677527. [DOI] [Google Scholar]
- Rassolov V. A.; Pople J. A.; Ratner M. A.; Windus T. L. 6-31G * Basis Set for Atoms K through Zn. J. Chem. Phys. 1998, 109, 1223–1229. 10.1063/1.476673. [DOI] [Google Scholar]
Associated Data
This section collects any data citations, data availability statements, or supplementary materials included in this article.


