Abstract
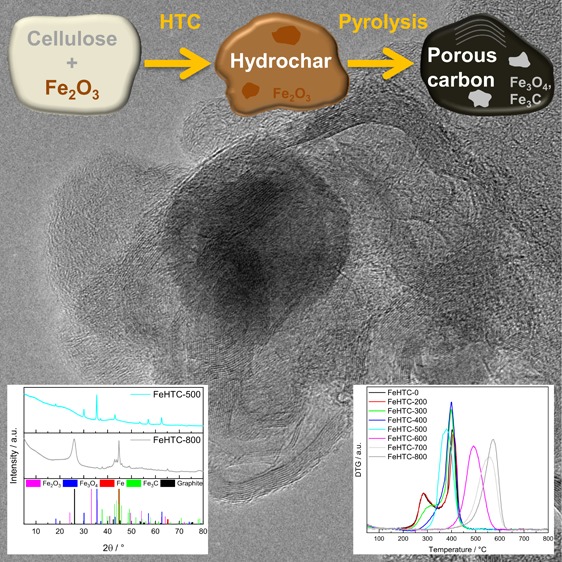
The applied pyrolysis temperature was found to strongly affect composition, structure, and oxidation behavior of pure and iron oxide nanoparticle (NP)-loaded carbon materials originating from hydrothermal carbonization (HTC) of cellulose. A strong loss of functional groups during pyrolysis at temperatures beyond 300 °C of the HTC-derived hydrochars was observed, resulting in an increase of the carbon content up to 95 wt% for the carbon materials pyrolyzed at 800 °C and an increase of the specific surface area with a maximum of 520 m2 g–1 at a pyrolysis temperature of 600 °C. Devolatilization mainly took place in the range from 300 to 500 °C, releasing light pyrolysis gases such as CO, CO2, H2O and larger oxygen-containing molecules up to C11. The presence of iron oxide NPs lowered the specific surface areas by about 200 m2 g–1 and resulted in the formation of mesopores. For the iron oxide-containing composites pyrolyzed up to 500 °C, the oxidation temperature was decreased by about 100 °C, indicating tight contact between the iron oxide NPs and the carbon matrix. For higher pyrolysis temperatures, this catalytic effect of iron oxide on carbon oxidation vanished due to carbothermal reduction to iron and iron carbide, which, however, catalyzed the graphitization of the carbon matrix. Thus, the well-controlled two-step synthesis based on a biomass-derived precursor yielded stably embedded iron NPs in a corrosion-resistant graphitic carbon matrix.
1. Introduction
Porous graphitic carbon materials are used in a variety of applications, for example, in gas separation and water purification, as electrodes in electrochemical devices, and as supports for heterogeneous catalysts. For the latter, they offer numerous advantageous properties, such as high electronic and thermal conductivity, strong resistance against chemical corrosion, and a high accessible surface area.1−4 In heterogeneous catalysis, porous graphitic carbon materials may be a viable cost-reduced alternative to carbon nanotubes (CNTs), which are used in applications such as electrocatalytic water splitting or as a support for the Fischer–Tropsch catalysts.5−9 Recently, especially biomass-derived carbon materials have received much attention because of the possible conversion of a waste product stream into a valuable product.1,10−13 Often, this conversion proceeds via ill-defined one-step pyrolysis of the carbon-rich precursor.1−4,11 One alternative is the hydrothermal carbonization (HTC) of the precursor in subcritical water before pyrolysis. Compared with dry pyrolysis, this well-controlled two-step process is considered suitable for upscaling and retains approximately three times more carbon in the product because of lower evolution of CO and CO2.14,15 Also, HTC is advantageous over dry pyrolysis of biomass because most of these feedstocks are quite humid and an initial drying step can be omitted.16 Compared with the synthesis of CNTs, the preparation of HTC-derived carbon supports does not involve a growth catalyst, thus avoiding impurities and an additional cleaning procedure. Furthermore, in situ doping during the HTC dispenses with postsynthetic functionalization and impregnation as required for metal deposition on CNTs.6,17,18
Still, the product obtained by HTC, the so-called hydrochar, needs drying and, depending on the targeted application, a subsequent pyrolysis step. The exact pyrolysis conditions such as gas-phase composition, final temperature, and heating rate affect not only the amount and chemical nature of the released volatiles but also the morphology, structure, and composition of the resulting material.19,20 Before pyrolysis, the surface of the hydrochar is rich with oxygen-containing functional groups that can be used for further nitrogen functionalization or directly act as anchor sites for catalytically active nanoparticles (NPs).6,21,22 During pyrolysis, a part of these groups decomposes, the carbon matrix starts to graphitize, and a network of pores forms. It is necessary to control all these effects in order to create a suitable support material for catalysis.
Hence, in this study, we investigate the influence of HTC and subsequent pyrolysis on the composition, structure, and chemical stability of the resulting porous carbon matrix. Furthermore, we evaluate adding iron oxide NPs to the precursor to further control HTC and pyrolysis and, thus, the properties of the final composite material. As starting material for the carbon support, we used cellulose as a pure, cheap, and nonfood biomass-derived material. The use of iron oxide NPs is promising because iron can catalyze both carbonization and graphitization in different chemical states and may then act as the actual catalyst in the desired application, such as the Fischer–Tropsch synthesis.6,17,18
2. Results
2.1. Pyrolysis
2.1.1. Temperature-Programmed Pyrolysis
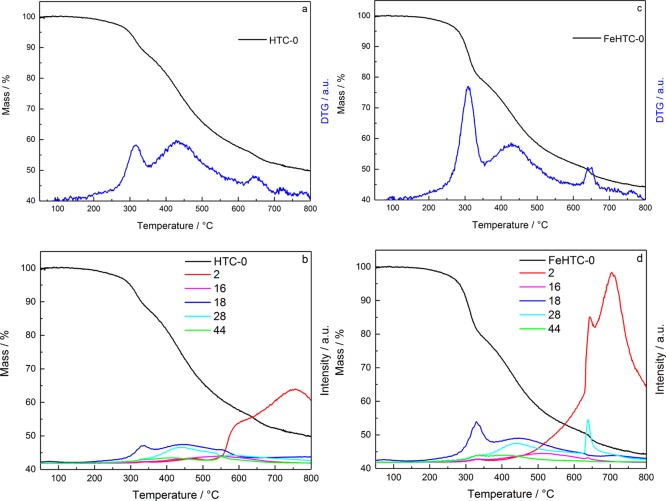
Temperature-programmed desorption (TPD) experiments were performed to evaluate devolatilization as a function of pyrolysis conditions. Figure 1 depicts the relative mass loss of the pure and iron-oxide-loaded hydrochars during heating to 800 °C in He in the thermobalance.
Figure 1.
Relative mass loss and DTG curves (a,c) and the corresponding QMS profiles (b,d) of the pure (a,b) and iron oxide-loaded hydrochar (c,d) during TPD measurements in He, applying a heating rate of 5 K min–1.
The total volatile fraction amounts to 50 and 56 wt % for the pure and the iron oxide-loaded hydrochar, respectively. The main release of volatiles occurs in the temperature range from 250 to 700 °C with the desorption maxima at about 310, 430, and 650 °C. The released volatile compounds are mostly H2 (m/z = 2), H2O (m/z = 18), and CO (m/z = 28), as identified by the online mass spectrometer (Figure 1). At low temperatures, the release of H2O takes place predominantly, whereas the mass loss in the intermediate temperature range is due to the release of H2O and CO. At high temperatures, H2 evolution is dominant. Iron oxide loading of the hydrochar results in a pronounced mass loss at around 300 °C because of the release of H2O and at around 650 °C, which coincides with the strong evolution of CO. Furthermore, a pronounced evolution of H2 at temperatures above 550 °C is present for the iron-doped sample compared with the undoped hydrochar. H2 can originate from dehydrogenation because of an increasing degree of graphitization and the elimination of hydrogen bound to aliphatic carbon atoms, which may be catalyzed by the present iron species.23
To quantify the differences in devolatilization because of the presence of iron oxide, sequential desorption experiments were performed in the thermobalance. Table 1 shows the relative mass loss per temperature step of both hydrochars.
Table 1. Relative Mass Losses per Temperature Step (100 °C) of the Pure and Iron Oxide-Loaded Hydrochar during Sequential TPD Measurements in He in a Thermobalance.
| sample | mass loss [wt %] | sample | mass loss [wt %] |
|---|---|---|---|
| HTC-0 | FeHTC-0 | ||
| HTC-200 | 4 | FeHTC-200 | 5 |
| HTC-300 | 12 | FeHTC-300 | 21 |
| HTC-400 | 16 | FeHTC-400 | 15 |
| HTC-500 | 9 | FeHTC-500 | 7 |
| HTC-600 | 5 | FeHTC-600 | 6 |
| HTC-700 | 3 | FeHTC-700 | 2 |
| HTC-800 | 1 | FeHTC-800 | 1 |
Both hydrochars exhibit the same qualitative behavior with respect to the main mass losses at pyrolysis temperatures between 300 and 500 °C. For pyrolysis temperatures higher than 400 °C, the mass loss per temperature step gradually decreases, independent of the presence of iron oxide. The onset of devolatilization is more pronounced for the iron-containing samples, and the mass loss between 300 and 500 °C is 15% higher compared with the pure sample.
2.1.2. Flash Pyrolysis
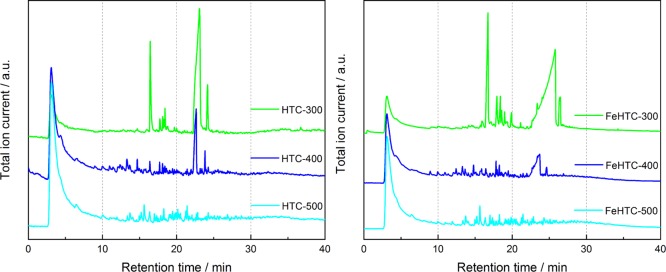
The pyrolysis–gas chromatography (GC)/mass spectrometry (MS) setup provides additional qualitative information on evolving aromatic molecules and tars by chromatographic analysis. Figure 2 displays the chromatograms of the stepwise pyrolysis of the pure and iron oxide-loaded hydrochars in the most interesting region between 300 and 500 °C.
Figure 2.
Chromatograms of the evolved species of the pure (left) and iron oxide-loaded carbon materials (right) as a function of the pyrolysis temperature during sequential flash pyrolysis in the pyrolysis–GC/MS setup.
In each step of the sequential flash pyrolysis, permanent gases, such as CO, CO2, and H2O, and light hydrocarbons elute with retention times less than 5 min as confirmed by thermogravimetric (TG)/MS analysis. At a pyrolysis temperature of 300 °C, first aromatic products appear (retention times: 6–23 min). Also, hydrocarbons (retention times: 23–33 min) are present for both hydrochars. The molecules released from the pure sample are almost entirely oxygen-functionalized, mostly monocyclic, and of a size up to C11. No large polycyclic aromatics or long-chain hydrocarbons are observed.
The product distribution of the pyrolysis at 400 °C is much broader and contains substituted, unsaturated and saturated, frequently heterocyclic 5-membered rings such as furan derivates and corresponding bicyclic compounds containing an additional aromatic ring. Increasing the temperature to 500 °C changes the product distribution significantly, as the fraction of substituted monocyclic and bicyclic aromatics increases.
For the corresponding iron oxide-loaded samples, the spectrum of evolved products differs. During pyrolysis at 300 °C, the presence of iron oxide leads to a more pronounced release of oxygen-functionalized unsaturated 5-membered rings and acyclic hydrocarbons. For pyrolysis at 400 °C, the product distribution contains much more different species compared with the pure sample, such as several substituted furan and furanone molecules as well as cyclopentane and cyclopentene derivates, mono- and bicyclic aromatic components, and acyclic O-functionalized hydrocarbons.
Beyond 600 °C, no further evolution of larger organic products was observed from either of the carbon materials (Figure S3). Yet, the intensity of the signal for permanent gases at low retention times remains high even for higher pyrolysis temperatures up to 800 °C, which corresponds to the ongoing release of small molecules, such as H2, CH4, CO, CO2, and H2O.
2.1.3. Pyrolysis Duration
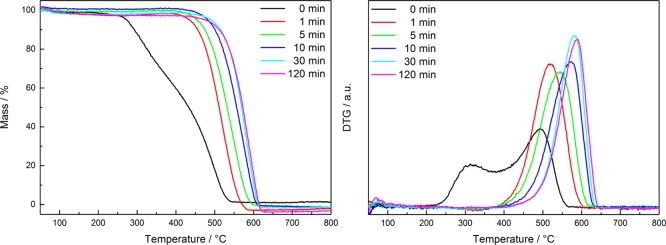
Figure 3 shows the temperature-programmed oxidation (TPO) of the pure porous carbon materials, which had been pyrolyzed at 800 °C for different durations. The hydrochar exhibits two differential thermogravimetry (DTG) maxima due to devolatilization at about 320 °C and total oxidation at 500 °C. In comparison, the carbon materials originating from pyrolysis exhibit only one mass loss step due to oxidation. Pyrolysis for 1 min at 800 °C under the applied conditions already leads to complete elimination of the low-temperature mass loss due to devolatilization.
Figure 3.
Relative mass losses (left) and DTG curves (right) of the pure carbon materials obtained by pyrolysis at 800 °C with different durations during TPO in 20% O2 in He in a thermobalance applying a heating rate of 5 K min–1.
The oxidation temperature of the pyrolysis product gradually increases as a function of the pyrolysis time from about 520 °C for 1 min to 570 °C for 10 min and 590 °C for 120 min.
2.2. Characterization
2.2.1. Elemental Analysis and Atomic Absorption Spectroscopy
Table 2 summarizes the elemental compositions per temperature step of the carbon materials pyrolyzed in the horizontal oven.
Table 2. Elemental Composition of the Carbon Materials as a Function of Pyrolysis Temperature Determined by Elemental Analysis and Atomic Absorption Spectroscopya.
| sample | C [wt %] | H [wt %] | Ob[wt %] | Fe [wt %] | calculated stoichiometryc | carbon ratio C/(H + O) [wt %] |
|---|---|---|---|---|---|---|
| HTC-0 | 65.0 | 4.2 | 30.8 | C2.8H2.4O | 65.0 | |
| HTC-200 | 66.5 | 4.4 | 29.1 | C3.0H2.4O | 66.5 | |
| HTC-300 | 69.5 | 4.0 | 26.5 | C3.5H2.4O | 69.5 | |
| HTC-400 | 78.7 | 3.4 | 17.9 | C5.9H3O | 78.7 | |
| HTC-500 | 88.4 | 2.8 | 8.8 | C13.4H5.1O | 88.4 | |
| HTC-600 | 92.5 | 2.1 | 5.4 | C22.8H6.2O | 92.5 | |
| HTC-700 | 93.2 | 1.9 | 4.9 | C25.4H6.2O | 93.2 | |
| HTC-800 | 95.1 | 0.9 | 4.0 | C31.7H3.6O | 95.1 | |
| FeHTC-0 | 60.1 | 4.8 | 33.2 | 1.9 | C2.5H2.4O | 62.0 |
| FeHTC-200 | 60.7 | 4.8 | 32.5 | 2.0 | C2.6H2.4O | 62.9 |
| FeHTC-300 | 65.8 | 4.2 | 27.9 | 2.1 | C3.2H2.5O | 67.5 |
| FeHTC-400 | 72.6 | 3.6 | 20.8 | 3.0 | C5.0H3.0O | 75.9 |
| FeHTC-500 | 81.0 | 2.9 | 12.9 | 3.2 | C9.4H4.0O | 84.9 |
| FeHTC-600 | 86.9 | 2.1 | 7.4 | 3.6 | C16.4H4.7O | 90.5 |
| FeHTC-700 | 90.2 | 0.9 | 5.1 | 3.8 | C24.9H3.0O | 94.0 |
| FeHTC-800 | 90.7 | 0.6 | 4.9 | 3.8 | C26.1H2.1O | 94.5 |
The amount of oxygen is derived from the amounts of C, H, and Fe (if present) and contains organic as well as inorganic oxygen for the iron oxide-loaded samples.
The amount of oxygen (wt %) was calculated according to O = 100 – C – H – Fe. Up to 500 °C, Fe was assumed to prevail in the state of Fe2O3. Above 500 °C, the dominant iron species was taken as Fe3C as indicated by XRD.
A systematic error of 0.3 in the stoichiometry coefficient of C cannot be excluded.
Clearly, the applied pyrolysis temperature strongly affects the elemental composition. The carbon content of the pure carbon materials increases with higher pyrolysis temperature from the initial 65 to 95 wt % at 800 °C accompanied by decreasing hydrogen and oxygen amounts.
The highest relative increase in carbon content is observed in the temperature range between 300 and 500 °C. Obviously, the presence of iron oxide has no strong effect on the elemental composition. Although the release of volatiles was about 10% higher for the iron oxide-loaded materials than for the pure ones, the loss of carbon via CO in the iron oxide-loaded sample results in approximately the same composition. During pyrolysis, the molar oxide-free composition changes from (C2.8H2.2O)n and (C2.5H2.4O)n for the pure and iron oxide-loaded hydrochars, respectively, and to (C31.7H3.6O)n and (C26.1H2.1O)n for pyrolysis at 800 °C.
For the iron oxide-loaded hydrochar, the actual iron loading amounts to 1.9 wt %, which is equivalent to 2.7 wt % Fe2O3. Accordingly, half of the amount of iron oxide added to the cellulose suspension before HTC was incorporated into the hydrochar, whereas the other half was lost during washing. The relative iron content of the material increases with higher pyrolysis temperature because of the higher degree of devolatilization resulting in 3.8 wt % Fe for FeHTC-800.
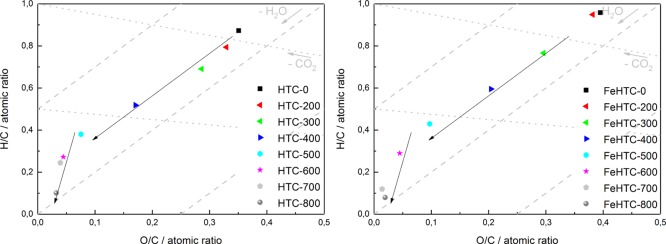
The van Krevelen diagram (Figure 4) illustrates the carbonization process, revealing a large decrease of the O/C and H/C ratios with increasing pyrolysis temperature.
Figure 4.
van Krevelen diagrams of the pure (left) and iron oxide-loaded carbon materials (right) after pyrolysis at different temperatures.
The organic oxygen content was calculated from the amounts of C, H, and the content of the present iron species. Accordingly, up to a pyrolysis temperature of about 500–600 °C, the elemental composition formally corresponds to dehydration. Beyond this temperature, a more pronounced dehydrogenation occurs with a higher slope independent of the presence of iron oxide.
2.2.2. X-ray Diffraction
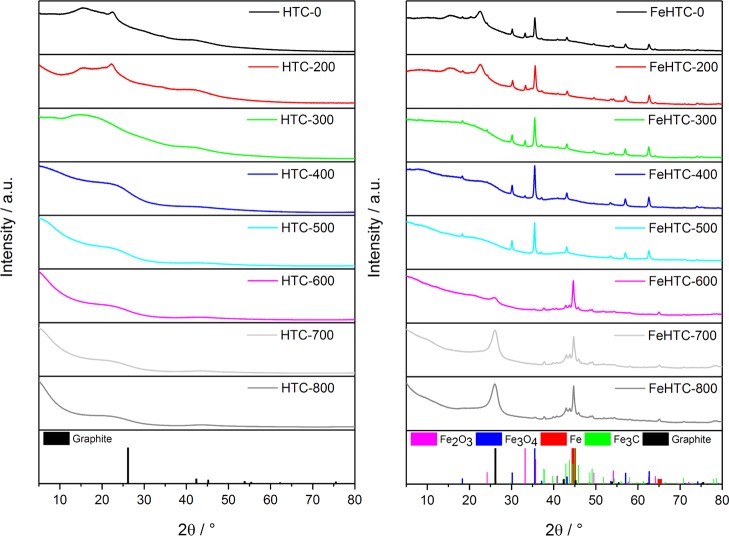
The X-ray diffraction (XRD) patterns of the pure carbon materials do not reveal the presence of a crystalline phase for any of the applied pyrolysis temperatures (Figure 5). In the presence of iron oxide, the prevailing iron phase depends on the pyrolysis temperature. For pyrolysis up to 300 °C, the XRD patterns indicate the presence of hematite (Fe2O3) and magnetite (Fe3O4). Pyrolysis at 400 and 500 °C leads to the reduction of hematite to magnetite. For pyrolysis temperatures higher than 500 °C, the iron oxides undergo carbothermal reduction to metallic iron and iron carbide (cementite, Fe3C). Furthermore, a pronounced reflection at 26° 2θ indicates emerging crystalline graphitic carbon. For the iron-doped samples pyrolyzed at 700 and 800 °C, Bragg’s law was applied to this reflection to calculate the interlayer distance yielding 3.4 Å, which is in good agreement with the (002) plane of pure graphite.
Figure 5.
XRD patterns of the pure (left) and iron oxide-loaded (right) carbon materials pyrolyzed at temperatures in the range from 200 to 800 °C.
2.2.3. Specific Surface Areas
The influence of pyrolysis temperature on the specific surface areas is illustrated in Figure 6. The as-synthesized pure hydrochar has a specific surface area of 5 m2 g–1, which slightly increases when applying the pyrolysis temperatures of 200 and 300 °C. Higher temperatures lead to a large increase of the specific surface area reaching a maximum of 520 m2 g–1 for a pyrolysis temperature of 600 °C. Beyond 600 °C, a slight decrease is observed. For the iron oxide-loaded hydrochar, a similar trend of the surface areas as a function of pyrolysis temperature is obtained. Yet, the actual surface areas for a given pyrolysis temperature are lower by about 200 m2 g–1.
Figure 6.
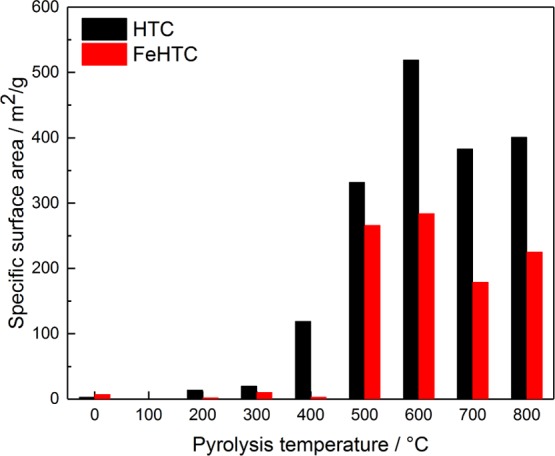
Specific surface areas as a function of the pyrolysis temperature for the pure and iron oxide-loaded carbon materials.
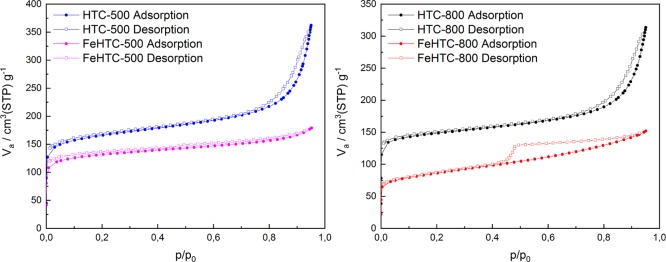
The recorded isotherms for the pure and iron oxide-loaded porous carbon materials after pyrolysis at 500 and 800 °C are shown in Figure 7, revealing that these carbon materials are porous. There is strong adsorption at low relative pressures with a higher amount of adsorbed N2 for the pure carbon material suggesting the presence of micropores. Evaluation using the t-plot method demonstrates that for the carbon materials pyrolyzed at 800 °C, the surface area is about sixfold higher than the external surface area because of these micropores. Furthermore, the t-plots provide the micropore volumes of the samples (Figure S2). They amount to 0.188 and 0.141 cm3 g–1 for the pure and iron oxide-loaded carbon materials pyrolyzed at 800 °C, respectively. The decrease of the micropore volume by about 25% because of doping is assigned to a promoting effect on the partial gasification of the carbon matrix during pyrolysis. The total amount of adsorbed N2 is slightly increasing in the medium relative pressure range for all carbon materials indicating a low amount of small mesopores. In this range, the increase in N2 adsorption of the iron oxide-loaded samples is similar to the pure samples. For the pure samples, the strong increase in the adsorption of N2 at p/p0 higher than 0.7 is likely due to capillary condensation in large mesopores and macropores. In comparison, for the iron oxide-loaded samples, there is no increase at high p/p0 indicating the absence of larger pores. Pyrolysis of the iron oxide-loaded carbon material at 800 °C leads to a marked hysteresis between the adsorption and desorption isotherms, which is not observed on applying a pyrolysis temperature of 500 °C. The isotherms reveal that for FeHTC-800, a different porous structure evolved compared with the pure and iron oxide-loaded samples pyrolyzed at lower temperatures. The origin of the hysteresis is assigned to the desorption from cavities in the material arising from the graphitization process during pyrolysis. The transmission electron microscopy (TEM) images presented in Figure 11 demonstrate the detachment of graphitic carbon layers from iron-containing particles causing voids in the nanometer range.
Figure 7.
N2 physisorption isotherms of the pure and iron oxide-loaded porous carbon materials after pyrolysis at 500 °C (left) and 800 °C (right).
Figure 11.
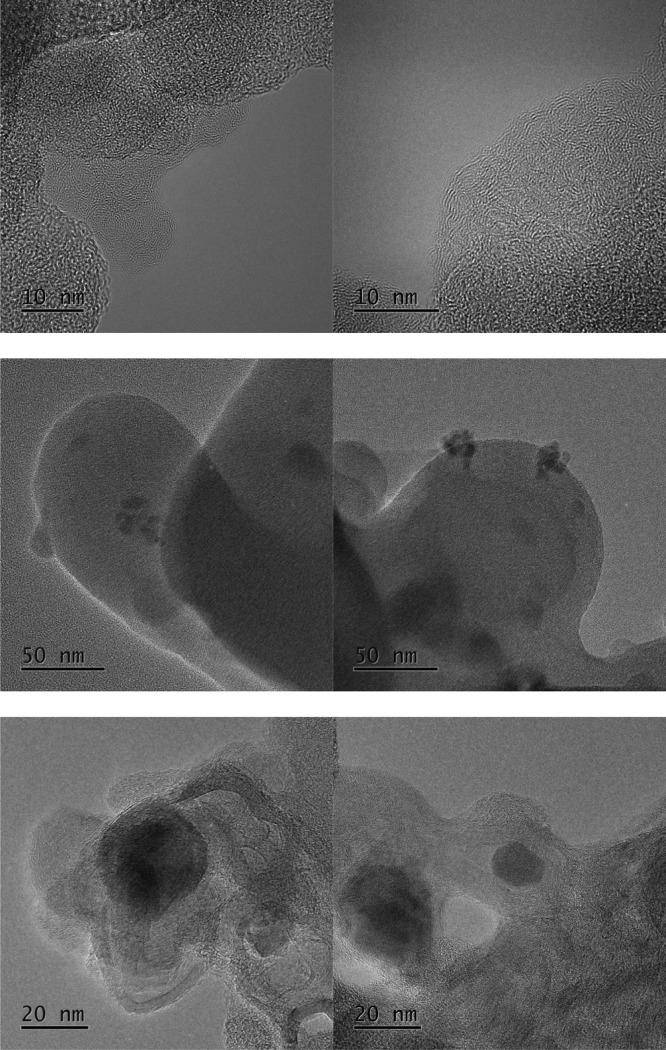
TEM images of the pure carbon materials treated at 800 °C (top) and the iron oxide-loaded composites pyrolyzed at 500 °C (middle) and 800 °C (bottom).
2.2.4. NMR Spectroscopy
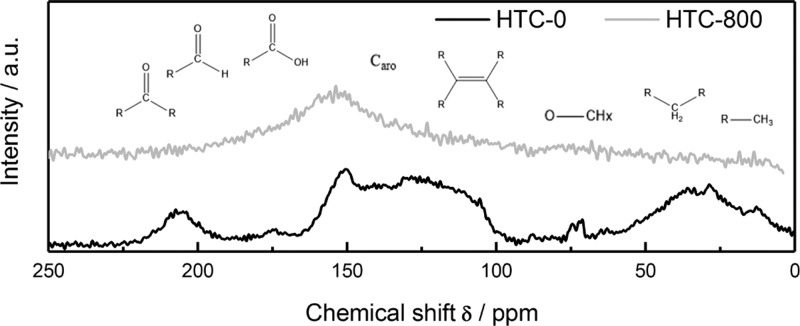
Figure 8 shows the NMR spectra of the pure hydrochar and the corresponding carbon material pyrolyzed at 800 °C.
Figure 8.
13C NMR spectra of the pure hydrochar and the resulting porous carbon material after pyrolysis at 800 °C for 1 h.
Carbon atoms can be classified by their chemical shifts in 13C NMR spectra into sp3-hybridized carbon atoms below 100 ppm, sp2-hybridized carbon atoms between 100 and 160 ppm, and carbonyl species (170–225 ppm).24−26 The NMR spectrum of the pure hydrochar reveals the presence of various carbon species, including a broad distribution of aliphatic carbon atoms in CH3 and CH2 groups at low chemical shifts. In the range from 100 to 160 ppm, sp2-hybridized carbon atoms in carbon double bonds (C=C), aromatic structures, and chemical bonds to an oxygen atom (C=C–O) are present. Hydrochar contains oxygen functional groups, such as carbonyl groups in aldehydes, ketones, or carboxylic acids (175–215 ppm) or sp3-hybridized carbon atoms bound to an oxygen atom, for example, in alcohols or ethers (∼75 ppm).24−26 Pyrolysis at 800 °C leads to the removal of aliphatic carbon atoms and O-functional groups. The broad signal from 120 to 170 ppm corresponds to carbon in double bonds and aromatic rings.
2.2.5. Attenuated Total Reflection–IR Spectroscopy
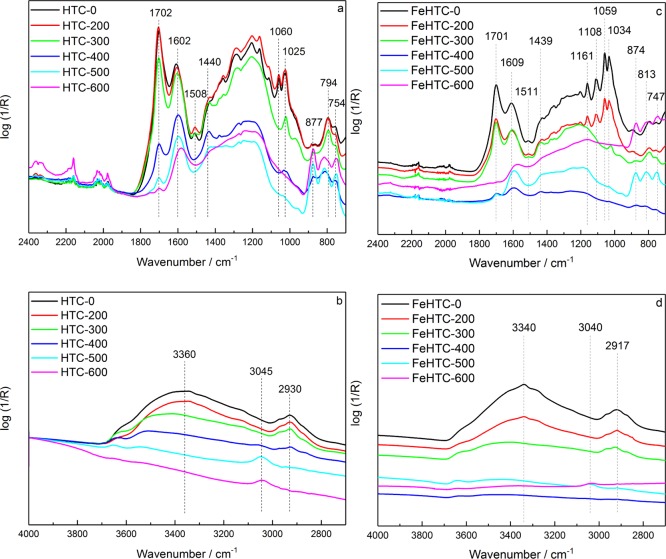
The attenuated total reflection (ATR)–IR spectra of the pure carbon materials (Figure 9) contain intensive bands for aromatic C=C stretching vibrations at about 1600 cm–1,27,28 skeletal C=C vibrations at around 1500 cm–1,14,27,29 and aromatic out-of-plane vibrations in the range of 900–700 cm–1.30,31
Figure 9.
ATR–IR spectra of the pure (a,b) and iron oxide-loaded carbon materials (c,d) as a function of the pyrolysis temperature.
C=O stretching vibrations occur at 1700 cm–1,31,32 which decrease in intensity with higher pyrolysis temperature. Also, a broad band in the range from 3600 to 3200 cm–1 is visible, originating from O–H stretching vibrations.33 Bands between 1470 and 1370 cm–1 are mainly due to different CH vibration modes,27,29,30 and the ones between 1200 and 1000 cm–1 indicate the presence of C–O groups.27,30,32
Up to a pyrolysis temperature of 300 °C, changes in the recorded spectra are minor. For higher temperatures, the structure changes significantly indicated by a decrease of the C=C and C=O bands and an increase of the aromatic out-of-plane bands. In addition, the aliphatic C–H vibrations corresponding to the band at around 2920 cm–1 disappear with increasing pyrolysis temperature.30,31 Simultaneously, the intensity of the band at 3045 cm–1 assigned to aromatic C–H vibrations31,33 rises.
Overall, the ATR–IR spectra of the pure and iron oxide-loaded materials show the same qualitative trends with respect to the applied pyrolysis temperatures, that is, a decrease of the number of O-functional groups and aliphatic CHx groups as well as an increasing degree of aromatization with increasing pyrolysis temperature. ATR–IR measurements of the material pyrolyzed at 700 and 800 °C were not conclusive because of the increased absorbance of the samples and the very low content of functional groups.
2.2.6. Raman Spectroscopy
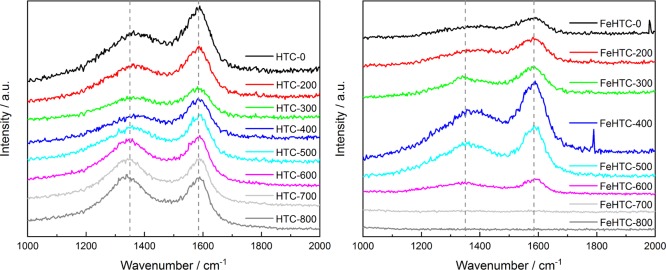
Raman spectroscopy elucidates structural changes as a function of the pyrolysis temperature (Figure 10). Compared with XRD, Raman measurements monitor structural properties also at a short-range order.34,35 The normalized Raman spectrum of the carbon materials exhibits two broad and overlapping peaks at about 1350 and 1585 cm–1. These bands are typical for carbonaceous materials and can be assigned to the D and G bands, respectively.
Figure 10.
Raman spectra of the pure (left) and iron oxide-loaded carbon materials (right) as a function of the pyrolysis temperature in the range from 200 to 800 °C.
Amorphous and disordered carbon materials consist of sp2-hybridized and sp3-hybridized carbon atoms. In pure graphite, only the G band is present at about 1581 cm–1. The G mode of E2g symmetry is caused by in-plane stretching of bonds of sp2-hybridized carbon atoms and is therefore not limited to aromatic rings.36 The D band at about 1350 cm–1 originates from a vibration mode with A1g symmetry because of graphene layer edges in disordered graphitic lattice.34,35 It is caused by the breathing vibration of sp2-hybridized carbon atoms in sixfold rings.36
The Raman spectra were fitted by a Lorentzian (L) function for the D peak and a Breit–Wigner–Fano (BWF) curve for the G peak. The BWF function, besides being strongly recommended for the best fitting of the asymmetrical G peak shape, can also take residual Raman intensity at about 1450 cm–1 into account without using an additional peak.36
The pyrolysis of hydrochars in a large temperature range implies very different Raman spectral features. Therefore, it is necessary to adopt a consistent fit for all samples: the BWF and L line pair is a satisfying mode to fit Raman spectra of all carbons from graphite to amorphous carbons.36 An additional L line was also used to fit a shoulder on the side of the D peak (named D4 at about 1230 cm–1) visible on the more amorphous samples.
Although in graphitic materials only one D line is observed, polycyclic aromatic hydrocarbon (PAH) molecules show few modes around 1300 cm–1.37 Thus, the substructure of the D peak and, specifically, the clear appearance of the D4 peak as a shoulder of the D peak can be attributed to some merging of different PAH moieties present in the structure.38
The intensity ratio of the D and G bands (I(D)/I(G)) is often used as an indicator of structural order. The I(D)/I(G) ratio increases for graphitic carbon materials with long-range order in graphitic layers compared with pure graphite, when defects like borders of aromatic clusters occur. In contrast, for materials composed of few aromatic clusters of small size, the intensity of the D mode is dominated by the fraction of sixfold rings in the cluster. Therefore, in the latter case, an increasing I(D)/I(G) ratio implies ordering.36
For the pure hydrochar, the height of the D band at 1350 cm–1 is significantly lower than the height of the G band. With increasing pyrolysis temperature, the ratio of the D and G bands gradually increases (Figure 10 and Table 3).
Table 3. Ratios of the D and G Band Intensities of the Pure and Iron Oxide-Loaded Samples as a Function of the Pyrolysis Temperature Determined by Raman Spectroscopy.
| sample | I(D)/I(G) [-] | sample | I(D)/I(G) [-] |
|---|---|---|---|
| HTC-0 | 0.54 | FeHTC-0 | 0.47 |
| HTC-200 | 0.62 | FeHTC-200 | 0.48 |
| HTC-300 | 0.69 | FeHTC-300 | 0.51 |
| HTC-400 | 0.53 | FeHTC-400 | 0.56 |
| HTC-500 | 0.68 | FeHTC-500 | 0.60 |
| HTC-600 | 0.92 | FeHTC-600 | 0.64 |
| HTC-700 | 0.98 | FeHTC-700 | a |
| HTC-800 | 1.01 | FeHTC-800 | a |
The calculation of the I(D)/I(G) ratios for FeHTC-700 and FeHTC-800 was omitted due to the low intensities of the corresponding Raman spectra.
As the synthesized porous carbon material is rather amorphous, this observation reveals ongoing thermal annealing of defects and therefore the increasing graphitization for carbon materials pyrolyzed at higher temperatures. For the iron oxide-loaded samples, the analysis of the spectra is less conclusive as the overall intensity of the detected Raman spectra is lower compared with the pure materials. The G band is clearly observable for the samples pyrolyzed up to 600 °C, whereas the peak of the D band is less sharp.
Iron oxide-loaded samples pyrolyzed at 700 and 800 °C show no peaks in the range between 1000 and 2000 cm–1, which might be a consequence of the changed scattering properties because of the structural changes occurring during carbothermal reduction. However, this could not be resolved with the applied acquisition times requiring further Raman studies, including optimized detection conditions also at lower wavenumbers for the iron oxide NPs. The ratios of the intensities of the D and G bands summarized in Table 3 also show an increase of the I(D)/I(G) ratio with increasing pyrolysis temperatures up to 600 °C as for the pure carbon materials.
2.2.7. Transmission Electron Microscopy
TEM measurements were performed for additional information on structural ordering caused by iron oxide loading and thermal treatment.
Figure 11 shows the pure carbon material pyrolyzed at 800 °C and the iron oxide-loaded samples treated at 500 and 800 °C. The pure sample pyrolyzed at 800 °C is predominantly amorphous, but some fringes exist at the shell of the particles. Owing to the layer distance of about 0.35 nm, these are identified as graphitic layers. However, the domains of graphitic ordering are scarce, of low range, and contain only a few layers in a stack. Therefore, a pyrolysis temperature of 800 °C is not suitable to prepare a highly graphitic carbon material based on the HTC of pure cellulose.
In Figure 11, the dark spheres in the TEM images of the iron oxide-loaded composites represent the incorporated iron particles. The pyrolysis of the iron oxide-loaded HTC carbon material at 500 °C results in a highly amorphous carbon material. No evidence of structural ordering, even on a small scale, can be observed. In contrast, FeHTC-800 contains both amorphous and ordered fractions. Fringes are present in multilayer stacks composed of several to 30 layers, whose distance of about 3.5 Å is consistent with the graphite (002) plane. These graphitic domains are several nm long taking into account the bent shape. Yet, no strict core–shell type structures are observed. The absence of graphitic layers around the iron particles and a less ordered shell might be due to carbon layers becoming detached from the iron carbide particles during the thermal treatment.39
2.3. Resistance to Oxidation
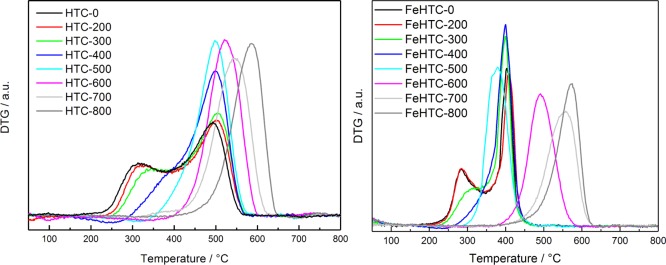
TPO experiments were performed to detect the effect of pyrolysis-induced changes in composition and structure on the oxidation behavior (Figure 12). The oxidation profile of the pure hydrochar exhibits two mass loss peaks, one at about 320 °C and the other at 500 °C.
Figure 12.
DTG curves of the pure (left) and iron oxide-loaded carbon materials (right) during TPO in 20% O2 in He in a thermobalance applying a heating rate of 5 K min–1.
The first mass loss is due to devolatilization, and the second one originates from the oxidation of the remaining carbon matrix. For the pure material, pyrolysis in the range of 200–500 °C leads to a gradual decrease of the intensity of the devolatilization signal, whereas the carbon oxidation temperature stays constant at 500 °C. For pyrolysis temperatures higher than 500 °C, devolatilization is no longer observed. The peak maximum temperature of carbon oxidation continuously increases with increasing pyrolysis temperature from 500 °C up to 585 °C for the sample pyrolyzed at 800 °C.
Loading the hydrochar with iron oxide also results in an oxidation profile with two mass loss peaks. However, the first DTG peak due to devolatilization is shifted by about 30 °C to lower temperatures, and the oxidation temperature is decreased by about 100 °C clearly revealing the catalytic influence of the Fe2O3 NPs. Up to a pyrolysis temperature of 500 °C, the trend of decreased mass loss due to devolatilization without shifting the oxidation temperature is identical to the pure sample. For pyrolysis temperatures of 600 °C and higher, the TPO peaks are shifted to higher temperatures but not as much as TPO peaks of the corresponding pure samples. The peak temperature for FeHTC-800 is only 10 °C lower than the oxidation temperature of the corresponding HTC-800 (Table 4).
Table 4. Oxidation Temperatures (TOx) of the Pyrolyzed Pure and Iron Oxide-Loaded Carbon Materials as a Function of the Pyrolysis Temperature Determined during TPO Experiments.
| sample | TOx [°C] | sample | TOx [°C] |
|---|---|---|---|
| HTC-0 | 493 | FeHTC-0 | 404 |
| HTC-200 | 501 | FeHTC-200 | 408 |
| HTC-300 | 504 | FeHTC-300 | 399 |
| HTC-400 | 499 | FeHTC-400 | 400 |
| HTC-500 | 500 | FeHTC-500 | 380 |
| HTC-600 | 522 | FeHTC-600 | 491 |
| HTC-700 | 545 | FeHTC-700 | 557 |
| HTC-800 | 585 | FeHTC-800 | 574 |
Analysis of the composition of the product gas stream during TPO of the porous carbon materials reveals that during the initial mass loss of the pure and iron oxide-loaded material, mainly H2O, CO, and CO2 evolve (Figure S3, Supporting Information). The major product of the second mass loss is CO2. Pyrolysis at 800 °C results in only a single high-temperature mass loss during TPO, producing CO2 and low amounts of CO and H2O.
3. Discussion
The performed experiments address the effects of the pyrolysis temperature and the presence of iron oxide on the elemental composition, structural properties, and oxidation behavior of the porous carbon materials prepared by HTC of cellulose and subsequent pyrolysis of the resulting hydrochars. Several techniques were applied to analyze structural changes of the material during pyrolysis, which consistently reveal the decrease of O-functional groups and aliphatic CH groups as well as an increase of aromaticity when increasing the pyrolysis temperature. TPD experiments using the pure and iron oxide-loaded hydrochars show that the main mass loss occurs at pyrolysis temperatures between 300 and 500 °C, followed by a gradual decrease of devolatilization at higher pyrolysis temperatures (Figure 1, Table 1). Thus, a significant change in composition occurs between 300 and 500 °C (Table 2), resulting in an increase of the degree of carbonization and evolution of volatile components, mainly H2O, H2, CO, CO2, and larger tar-like compounds. The latter contain aliphatic and aromatic hydrocarbons and oxygen-functionalized molecules up to C11 (Figure 2). At pyrolysis temperatures beyond 600 °C, the composition of devolatilization products changes from tars to small molecules, such as H2, CH4, CO, CO2, and H2O (Figures 2 and S1, Supporting Information), which may originate from the cracking of originally heavier molecules or from structural ordering and decomposition of functional groups with higher thermal stability such as lactone, phenol, and carbonyl groups.40 Initially, the prepared hydrochar has a carbon content of 65 wt %. Higher pyrolysis temperatures lead to a further decrease of the hydrogen and oxygen fraction, so that materials pyrolyzed at 800 °C contain up to 95 wt % carbon.
According to the van Krevelen diagram (Figure 4), changes in elemental composition can be divided into a low-temperature regime, where the decomposition processes formally correspond to dehydration, and a more intense dehydrogenation starting at 600 °C, which is presumably caused by an increasing degree of aromatization. Obviously, devolatilization occurs on a shorter time scale than structural rearrangements in the carbon materials. However, the small differences between pyrolysis duration of 30 and 120 min confirm that the procedure of pyrolyzing the hydrochars for 60 min is adequate.
Although there is no noticeable effect of iron on the carbonization, the presence of iron oxide favors the release of H2O, CO, and H2 during pyrolysis. During pyrolysis, the initially loaded Fe2O3 NPs are reduced to Fe3O4 at 500 °C, whereas the carbon matrix stays X-ray amorphous. Beyond this pyrolysis temperature, the iron oxide species are further reduced to metallic iron and iron carbide indicating carbothermal reduction
At higher temperatures, graphitization of the iron-loaded carbon materials is observed by XRD. The pure carbon materials hardly contain any graphitic domains. Long-range order would be required for the presence of sharp reflections, which were not detected. Clearly, the generated iron carbide NPs catalyze the graphitization of the amorphous carbon matrix.17,41,42 Carbon atoms can diffuse into the iron carbide NPs at elevated temperatures, enabling the growth of graphitic layers around the carbide cores forming core–shell NPs.41,42 Consistent with the XRD patterns, TEM images reveal that the presence of iron benefits the graphitization of the carbon matrix under certain conditions.13 Because of carbidization of iron oxide during the pyrolysis at higher temperatures, structural ordering and graphitization of the carbon matrix is enabled.39 No significant increase in structural order of the carbon matrix occurs during pyrolysis when iron is present as iron oxide.
Although the specific surface area of the hydrochars is rather low, the release of volatiles during pyrolysis causes the formation of pores resulting in higher specific surface areas. Beyond 600 °C, a slight decrease is observed which is attributed to the coalescence or closure of pores.43 For the iron oxide-loaded composites, a similar trend of the surface areas as a function of pyrolysis temperature is obtained. Yet, the actual surface areas are lower. A more pronounced release of H2O as identified by TPD experiments may lead to carbon gasification catalyzed by iron resulting in less micropores and a lower specific surface area.44
The release of volatiles during pyrolysis is known to lead to micropores in the material.45,46 Large mesopores and macropores, present in the pure carbon matrix, are due to interstices formed by clustering of primary particles to aggregates. Compared with the pure materials, the iron oxide-loaded composites contain small mesopores, less micropores, but no macropores. Pyrolysis of the iron-loaded composites at 800 °C results in a different porous structure compared with pyrolysis at 500 °C and the pure samples. An altered texture containing ink-bottle shaped pores is presumably due to the graphitization process as graphitic layers detach from the iron and iron carbide particles causing interstices. A similar hysteresis for iron- and iron carbide-containing carbon materials has been reported in the literature.17
The increase in oxidation temperature of the carbon materials pyrolyzed at higher temperatures is attributed to a higher degree of aromatization and a lower content of reactive functional groups. Loading the hydrochar with iron oxide NPs significantly decreases the temperature of devolatilization and oxidation by about 100 °C. Thus, iron oxide has a catalytic influence on both devolatilization and oxidation for the composites pyrolyzed up to 500 °C. The iron oxide-loaded composites pyrolyzed above 600 °C show a much lower decrease in the oxidation temperature. The XRD results for those pyrolysis temperatures show clearly that the initially present iron oxide NPs in the hydrochar had been carbothermally reduced to iron carbide NPs covered by graphitic shells as indicated by TEM. In this state, iron is no longer catalytically active for oxidation but instead for graphitization of the surrounding carbon matrix.
Further studies are in progress using the porous carbon samples and the iron NP/graphitic carbon composites obtained by pyrolysis at 800 °C as the support and catalyst in the Fischer–Tropsch synthesis, respectively. The concept of loading biomass-derived precursors with catalytically active NP before HTC and subsequent pyrolysis is quite versatile. It can be adapted to produce Ni-based catalysts for methanation, Co-based catalysts for the synthesis of higher alcohols, or to NiFe- and CoFe-based electrocatalysts applicable in the oxygen evolution reaction.
4. Conclusions
Porous carbon is a potentially suitable material as catalyst support in a variety of applications. Pure and iron oxide-loaded porous carbon materials were synthesized by pyrolysis of hydrochars originating from HTC of cellulose. The main release of volatiles was found to occur between 300 and 500 °C. The tars produced during flash pyrolysis were aliphatic and aromatic, oxygen-functionalized, and of small size (≤C11). Devolatilization was accompanied by an increasing carbon content and structural changes of the material because of the decomposition of aliphatic and oxygen-containing functional groups. For pyrolysis temperatures beyond 500 °C, an increasing degree of structural ordering and graphitization was observed.
The addition of iron oxide to cellulose did not have a significant influence on the carbonization of the material during HTC or the subsequent pyrolysis at lower temperatures, but it changed the spectrum of released volatiles. More importantly, it affected the morphology and structure of the resulting porous carbon matrix. The addition of iron oxide NPs lowered the specific surface area of the composites by up to 200 m2 g–1 and led to the formation of mesopores. Furthermore, Fe2O3 catalyzed the oxidation of the carbon matrix, thus lowering the oxidation temperatures significantly by up to 100 °C.
However, pyrolysis temperatures above 600 °C led to carbothermal reduction of iron oxide to metallic iron and iron carbide (Fe3C). These species were catalytically inactive for oxidation but catalyzed the graphitization of the carbon matrix leading to a more corrosion-resistant composite. Thus, by adding iron oxide NP before HTC, a very close contact with the carbon matrix was achieved resulting in iron or iron carbide NPs strongly embedded in a graphitic carbon matrix.
5. Experimental Section
5.1. Synthesis of HTC-Derived Hydrochars
Pure hydrochar was synthesized by subjecting a mixture of 60 g α-cellulose (Sigma-Aldrich) and 300 mL deionized water to 200 °C and approximately 16 bar for 24 h in a polytetrafluoroethylene inset of a 500 mL stainless steel autoclave.14 Similarly, a hydrochar containing 5 wt % iron oxide was prepared by adding 1.5 g of nanoscale Fe2O3 (Alfa Aesar, 20–40 nm) to the cellulose dispersion. This iron oxide precursor also contained a minor fraction of Fe3O4 as determined by XRD. After HTC, the obtained suspensions were filtered and washed with deionized water until a neutral pH was reached. The resulting solids were dried for 24 h at 105 °C in an oven with hot air ventilation.
5.2. Pyrolysis of HTC-Derived Hydrochars
Pyrolysis of the synthetic hydrochars was investigated using different conditions and heating rates. Temperature-programmed experiments in inert atmosphere were performed in a thermobalance applying a heating rate of 5 K min–1 to investigate mass loss and evolved gases. Furthermore, sequential desorption experiments in a thermobalance were carried out by stepwise increase of the treatment temperature. Stepwise flash pyrolysis was investigated using a pyrolysis–GC/MS setup, in which the heating rate was several orders of magnitude higher than in the thermobalance. This setup enabled us to study the evolution of larger aromatic molecules and hydrocarbons.
5.2.1. Temperature-Programmed Pyrolysis
TG analysis was carried out in a magnetic suspension balance (Rubotherm) with an online mass spectrometer (ThermoStar, Pfeiffer) using about 30 mg sample. Mass loss during pyrolysis was monitored by TPD experiments in the thermobalance by heating at 5 K min–1 to 800 °C in 100 mL min–1 He (purity 99.999%). The amount of volatiles released as a function of pyrolysis temperature was determined by stepwise experiments in the thermobalance applying a sequential temperature increase in steps of 100 °C (heating rate 10 K min–1) in He. The corresponding mass loss was recorded each time after 60 min at the corresponding temperature.
5.2.2. Flash Pyrolysis
Pyrolysis gases were analyzed using a gas chromatograph equipped with a high-temperature pyrolysis injector and an online mass spectrometer as the detector (pyrolysis–GC/MS). The setup consists of a multishot pyrolyzer (EGA/PY-3030D, Frontier Lab) and a GC/MS system (GCMS-QP2010 Ultra, Shimadzu). The pyrolyzer was heated by a ceramic heater, and the evolving gases were flushed with He (purity: 99.999%) as the carrier gas to the GC separation column for subsequent online analysis. As separation column, the Ultra ALLOY capillary column (UA+-5, 30 m length, 0.25 mm i.d., 0.25 μm film thickness, Frontier Lab) with 5% diphenyl 95% dimethyl polysiloxane as the stationary phase was used.
The analyzer of the mass spectrometer is a quadrupole mass filter with a mass range of m/z = 1.5–1090 and a mass resolution (full width at half-maximum) of 0.5–2.0 unified atomic mass unit. The instrument detection limit is ≤10 fg for the standard substance octafluoronaphthalene. The injector was set to a temperature of 200 °C and a split ratio of 1:20 leading to a column flow of 1.42 mL min–1. The temperature of the GC oven was programmed to be constant for 5 min at 40 °C with subsequent heating to 300 °C with a linear temperature rate of 10 K min–1. The final temperature was kept constant for 10 min. Ionization in the quadrupole mass spectrometer was accomplished at 70 eV in the electron impact mode. The mass-to-charge ratio was detected in the range of 10–500.
For the measurement, approximately 0.5 mg of the sample was placed in a sample cup, which fell freely into the oven preheated to temperatures between 100 and 800 °C in 100 °C steps resulting in a heating rate in the order of magnitude of 103 K s–1. After the first measurement at 100 °C, the sample was lifted in the closed system above the oven, the oven temperature was set 100 °C higher and after reaching this temperature, the cooled-down sample fell freely again into the oven to monitor the next temperature step.
5.2.3. Variation of Pyrolysis Temperature
Subsequent pyrolysis of the pure and iron oxide-loaded hydrochars took place in a horizontal oven using flowing N2 (70 mL min–1, purity 99.999%). Approximately 1 g of the hydrochar was placed in a quartz boat and pyrolyzed at different temperatures in the range of 200–800 °C (steps of 100 °C) applying a heating rate of 5 K min–1 and holding the final pyrolysis temperature for 60 min.
5.2.4. Variation of Pyrolysis Duration
Additionally, carbon materials were prepared with different pyrolysis durations in the same setup as before and preheated to 800 °C by varying the residence time from 1 to 5, 10, 30, and 120 min.
The resulting material is labeled as HTC for the pure and FeHTC for the iron oxide-loaded composites followed by the pyrolysis temperature in degree Celsius or the duration of pyrolysis in minutes. The hydrochars are labeled (Fe)HTC-0.
5.3. Characterization
Subsequent to pyrolysis at different temperatures, the obtained carbon materials were extensively characterized with respect to structure and reactivity. The composition of the synthesized samples was determined by elemental analysis (C, H) applying a EURO EA 3000 elemental analyzer (HEKAtech) and a Vario EL (Elementar Hanau). Atomic absorption spectroscopy was performed in a flame spectrometer (SpectrAA 220, Varian) to determine the actual iron content (wt % Fe) in the sample. Iron-containing phases present in the composites were identified by XRD in the range from 5° to 80° 2θ employing a PANalytical MPD diffractometer. The specific surface area of the samples was determined by a BELSORP-max (BEL Japan) performing N2 physisorption measurements at 77 K. The obtained isotherms were evaluated according to the Brunauer–Emmett–Teller method. TEM images were derived by a Cs-corrected transmission electron microscope (JEOL 2200FS) with a point resolution of 0.19 nm (200 kV). The samples were suspended in ethanol, and the dispersion was treated in an ultrasonic bath. A copper grid with a holey carbon film was applied as the sample holder. Analysis of the obtained TEM images was done using the software DigitalMicrograph (GATAN). ATR–IR spectra were recorded in the range from 4000 to 500 cm–1 to investigate the functional groups applying a Nicolet 6700 FTIR (Thermo Scientific) spectrometer with a diamond ATR accessory DuraSamplIR II (Smiths Detection) with a resolution of 2 cm–1 and performing 100 scans. 13C magic angle spinning solid-state (MAS) NMR experiments were conducted using a DPX ∼300 MHz (7 T) spectrometer (Bruker) with a MAS spinning rate of 14 kHz. To enhance carbon sensitivity, proton-to-carbon cross polarization was carried out. 20 000 scans per sample were performed, and calibration of the 13C chemical shifts was achieved by adamantane (δ = 38.48 ppm). Raman measurements were carried out by employing a confocal Raman microscope (alpha300 R/A/S) from WITec equipped with a frequency-doubled Nd:YAG laser with a wavelength of 532 nm. The laser beam with an intensity of about 10 mW was directed into the microscope through a single-mode optical fiber and then focused on the sample surface with a magnifying objective (magnification = 20, numerical aperture NA = 0.4). The scattered light was detected by a spectrometer unit (UHTS300) consisting of a diffraction grating (600 grooves per mm) and a back-illuminated electron multiplying charge-coupled device (1600 × 200 pixels, cooled to −60 °C) after collection with the same objective. The spectra were recorded in the spectral range of 0–3700 cm–1. For every sample, 50 spectra were collected with an integration time of 1 s for each spectrum and averaged automatically by the software. All experiments were performed at ambient temperature and pressure. Glass slides were used as sample holders for all Raman measurements. The recorded spectra were baseline-corrected and fitted according to the G and D bands. Finally, the oxidation behavior was investigated in TPO experiments in a magnetic suspension balance (Rubotherm) applying a heating rate of 5 K min–1 to 800 °C in 20% O2 (purity 99.995%) diluted in He (purity 99.999%).
Acknowledgments
The financial support by the SFB/Transregio 129 (Oxyflame) and the Cluster of Excellence RESOLV (EXC 1069) funded by Deutsche Forschungsgemeinschaft (DFG) is gratefully acknowledged.
Supporting Information Available
The Supporting Information is available free of charge on the ACS Publications website at DOI: 10.1021/acsomega.8b03369.
Relative mass losses, DTG curves, and QMS profiles during TPD of the pure and iron oxide-loaded hydrochars before and after pyrolysis at 500 °C, t-plots based on the N2 physisorption measurements of the pure and iron oxide-loaded porous carbon materials pyrolyzed at 800 °C, relative mass losses and the QMS profiles during TPO of the pure and iron oxide-loaded hydrochars and the corresponding chars pyrolyzed at 800 °C, chromatograms of the evolved species of the pure iron oxide-loaded hydrochars, detailed lists and visualization of all detected compounds evolving during the stepwise pyrolysis of all samples at all temperatures (PDF)
The authors declare no competing financial interest.
Supplementary Material
References
- Matos I.; Bernardo M.; Fonseca I. Porous carbon: A versatile material for catalysis. Catal. Today 2017, 285, 194–203. 10.1016/j.cattod.2017.01.039. [DOI] [Google Scholar]
- Yang Y.; Chiang K.; Burke N. Porous carbon-supported catalysts for energy and environmental applications: A short review. Catal. Today 2011, 178, 197–205. 10.1016/j.cattod.2011.08.028. [DOI] [Google Scholar]
- Trogadas P.; Fuller T. F.; Strasser P. Carbon as catalyst and support for electrochemical energy conversion. Carbon 2014, 75, 5–42. 10.1016/j.carbon.2014.04.005. [DOI] [Google Scholar]
- Lee J.; Kim J.; Hyeon T. Recent progress in the synthesis of porous carbon materials. Adv. Mater. 2006, 18, 2073–2094. 10.1002/adma.200501576. [DOI] [Google Scholar]
- Kundu S.; Wang Y.; Xia W.; Muhler M. Thermal stability and reducibility of oxygen-containing functional groups on multiwalled carbon nanotube surfaces: A quantitative high-resolution XPS and TPD/TPR study. J. Phys. Chem. C 2008, 112, 16869–16878. 10.1021/jp804413a. [DOI] [Google Scholar]
- Schulte H. J.; Graf B.; Xia W.; Muhler M. Nitrogen- and oxygen-functionalized multiwalled carbon nanotubes used as support in iron-catalyzed, high-temperature Fischer-Tropsch synthesis. ChemCatChem 2011, 4, 350–355. 10.1002/cctc.201100275. [DOI] [Google Scholar]
- Kundu S.; Nagaiah T. C.; Xia W.; Wang Y.; Dommele S. V.; Bitter J. H.; Santa M.; Grundmeier G.; Bron M.; Schuhmann W.; et al. Electrocatalytic activity and stability of nitrogen-containing carbon nanotubes in the oxygen reduction reaction. J. Phys. Chem. C 2009, 113, 14302–14310. 10.1021/jp811320d. [DOI] [Google Scholar]
- Masa J.; Xia W.; Sinev I.; Zhao A.; Sun Z.; Grützke S.; Weide P.; Muhler M.; Schuhmann W. MnxOy/NC and CoxOy/NC Nanoparticles Embedded in a Nitrogen-Doped Carbon Matrix for High-Performance Bifunctional Oxygen Electrodes. Angew. Chem., Int. Ed. 2014, 53, 8508–8512. 10.1002/anie.201402710. [DOI] [PubMed] [Google Scholar]
- Zhao P.; Xu W.; Hua X.; Luo W.; Chen S.; Cheng G. Facile Synthesis of a N-Doped Fe3C@CNT/Porous Carbon Hybrid for an Advanced Oxygen Reduction and Water Oxidation Electrocatalyst. J. Phys. Chem. C 2016, 120, 11006–11013. 10.1021/acs.jpcc.6b03070. [DOI] [Google Scholar]
- Antolini E. Nitrogen-doped carbons by sustainable N- and C-containing natural resources as nonprecious catalysts and catalyst supports for low temperature fuel cells. Renew. Sustain. Energy Rev. 2016, 58, 34–51. 10.1016/j.rser.2015.12.330. [DOI] [Google Scholar]
- Liu Y.; Ruan J.; Sang S.; Zhou Z.; Wu Q. Iron and nitrogen co-doped carbon derived from soybeans as efficient electro-catalysts for the oxygen reduction reaction. Electrochim. Acta 2016, 215, 388–397. 10.1016/j.electacta.2016.08.090. [DOI] [Google Scholar]
- Yan L.; Yu J.; Houston J.; Flores N.; Luo H. Biomass derived porous nitrogen doped carbon for electrochemical devices. Green Energy Environ. 2017, 2, 84–99. 10.1016/j.gee.2017.03.002. [DOI] [Google Scholar]
- Neeli S. T.; Ramsurn H. Synthesis and formation mechanism of iron nanoparticles in graphitized carbon matrices using biochar from biomass model compounds as a support. Carbon 2018, 134, 480–490. 10.1016/j.carbon.2018.03.079. [DOI] [Google Scholar]
- Düdder H.; Wütscher A.; Stoll R.; Muhler M. Synthesis and characterization of lignite-like fuels obtained by hydrothermal carbonization of cellulose. Fuel 2016, 171, 54–58. 10.1016/j.fuel.2015.12.031. [DOI] [Google Scholar]
- Düdder H.; Lotz K.; Wütscher A.; Muhler M. The influence of iron oxide on the oxidation kinetics of synthetic char derived from thermogravimetric analysis and fixed-bed experiments under isothermal and temperature-programmed conditions. Fuel 2017, 201, 99–104. 10.1016/j.fuel.2016.09.076. [DOI] [Google Scholar]
- Hu B.; Wang K.; Wu L.; Yu S.-H.; Antonietti M.; Titirici M.-M. Engineering carbon materials from the hydrothermal carbonization process of biomass. Adv. Mater. 2010, 22, 813–828. 10.1002/adma.200902812. [DOI] [PubMed] [Google Scholar]
- Thompson E.; Danks A. E.; Bourgeois L.; Schnepp Z. Iron-catalyzed graphitization of biomass. Green Chem. 2015, 17, 551–556. 10.1039/c4gc01673d. [DOI] [Google Scholar]
- Hoekstra J.; Beale A. M.; Soulimani F.; Versluijs-Helder M.; Geus J. W.; Jenneskens L. W. Base metal catalyzed graphitization of cellulose: A combined Raman spectroscopy, temperature-dependent X-ray diffraction and high-resolution transmission electron microscopy study. J. Phys. Chem. C 2015, 119, 10653–10661. 10.1021/acs.jpcc.5b00477. [DOI] [Google Scholar]
- Baccile N.; Laurent G.; Coelho C.; Babonneau F.; Zhao L.; Titirici M.-M. Structural Insights on Nitrogen-Containing Hydrothermal Carbon Using Solid-State Magic Angle Spinning 13C and 15N Nuclear Magnetic Resonance. J. Phys. Chem. C 2011, 115, 8976–8982. 10.1021/jp2015512. [DOI] [Google Scholar]
- Lin Y.-C.; Cho J.; Tompsett G. A.; Westmoreland P. R.; Huber G. W. Kinetics and mechanism of cellulose pyrolysis. J. Phys. Chem. C 2009, 113, 20097–20107. 10.1021/jp906702p. [DOI] [Google Scholar]
- Xia W.; Yin X.; Kundu S.; Sánchez M.; Birkner A.; Wöll C.; Muhler M. Visualization and functions of surface defects on carbon nanotubes created by catalytic etching. Carbon 2011, 49, 299–305. 10.1016/j.carbon.2010.09.025. [DOI] [Google Scholar]
- Li C.; Zhao A.; Xia W.; Liang C.; Muhler M. Quantitative studies on the oxygen and nitrogen functionalization of carbon nanotubes performed in the gas phase. J. Phys. Chem. C 2012, 116, 20930–20936. 10.1021/jp306866q. [DOI] [Google Scholar]
- Shi L.; Liu Q.; Zhou B.; Guo X.; Li Z.; Cheng X.; Yang R.; Liu Z. Interpretation of methane and hydrogen evolution in coal pyrolysis from the bond cleavage perspective. Energy Fuels 2016, 31, 429–437. 10.1021/acs.energyfuels.6b02482. [DOI] [Google Scholar]
- Baccile N.; Laurent G.; Babonneau F.; Fayon F.; Titirici M.-M.; Antonietti M. Structural Characterization of Hydrothermal Carbon Spheres by Advanced Solid-State MAS 13C NMR Investigations. J. Phys. Chem. C 2009, 113, 9644–9654. 10.1021/jp901582x. [DOI] [Google Scholar]
- Titirici M.-M.; Antonietti M.; Baccile N. Hydrothermal carbon from biomass: A comparison of the local structure from poly- to monosaccharides and pentoses/hexoses. Green Chem. 2008, 10, 1204. 10.1039/b807009a. [DOI] [Google Scholar]
- Baccile N.; Falco C.; Titirici M.-M. Characterization of biomass and its derived char using13C-solid state nuclear magnetic resonance. Green Chem. 2014, 16, 4839–4869. 10.1039/c3gc42570c. [DOI] [Google Scholar]
- Poletto M.; Zattera A. J.; Santana R. M. C. Structural differences between wood species: Evidence from chemical composition, FTIR spectroscopy, and thermogravimetric analysis. J. Appl. Polym. Sci. 2012, 126, E337–E344. 10.1002/app.36991. [DOI] [Google Scholar]
- Balachandran M. Role of Infrared Spectroscopy in Coal Analysis-An Investigation. Am. J. Anal. Chem. 2014, 05, 367–372. 10.4236/ajac.2014.56044. [DOI] [Google Scholar]
- Odeh A. O. Oualitative and quantitative ATR-FTIR analysis and its application to coal char of different ranks. J. Fuel Chem. Technol. 2015, 43, 129–137. 10.1016/s1872-5813(15)30001-3. [DOI] [Google Scholar]
- Schwanninger M.; Rodrigues J. C.; Pereira H.; Hinterstoisser B. Effects of short-time vibratory ball milling on the shape of FT-IR spectra of wood and cellulose. Vib. Spectrosc. 2004, 36, 23–40. 10.1016/j.vibspec.2004.02.003. [DOI] [Google Scholar]
- Chen Y.; Mastalerz M.; Schimmelmann A. Characterization of chemical functional groups in macerals across different coal ranks via micro-FTIR spectroscopy. Int. J. Coal Geol. 2012, 104, 22–33. 10.1016/j.coal.2012.09.001. [DOI] [Google Scholar]
- Uchimiya M.; Wartelle L. H.; Klasson K. T.; Fortier C. A.; Lima I. M. Influence of pyrolysis temperature on biochar property and function as a heavy metal sorbent in soil. J. Agric. Food Chem. 2011, 59, 2501–2510. 10.1021/jf104206c. [DOI] [PubMed] [Google Scholar]
- Wütscher A.; Wedler C.; Seibel C.; Hiltrop D.; Fieback T. M.; Muhler M.; Span R. On the alternating physicochemical characteristics of Colombian coal during pyrolysis. J. Anal. Appl. Pyrolysis 2017, 123, 12–19. 10.1016/j.jaap.2017.01.007. [DOI] [Google Scholar]
- Sadezky A.; Muckenhuber H.; Grothe H.; Niessner R.; Pöschl U. Raman microspectroscopy of soot and related carbonaceous materials: Spectral analysis and structural information. Carbon 2005, 43, 1731–1742. 10.1016/j.carbon.2005.02.018. [DOI] [Google Scholar]
- Patel M.; Azanza Ricardo C. L.; Scardi P.; Aswath P. B. Morphology, structure and chemistry of extracted diesel soot-Part I: Transmission electron microscopy, Raman spectroscopy, X-ray photoelectron spectroscopy and synchrotron X-ray diffraction study. Tribol. Int. 2012, 52, 29–39. 10.1016/j.triboint.2012.03.. [DOI] [Google Scholar]
- Ferrari A. C.; Robertson J. Interpretation of Raman spectra of disordered and amorphous carbon. Phys. Rev. B: Condens. Matter Mater. Phys. 2000, 61, 14095–14107. 10.1103/physrevb.61.14095. [DOI] [Google Scholar]
- Castiglioni C.; Mapelli C.; Negri F.; Zerbi G. Origin of the D line in the Raman spectrum of graphite: A study based on Raman frequencies and intensities of polycyclic aromatic hydrocarbon molecules. J. Chem. Phys. 2001, 114, 963. 10.1063/1.1329670. [DOI] [Google Scholar]
- Russo C.; Ciajolo A. Effect of the flame environment on soot nanostructure inferred by Raman spectroscopy at different excitation wavelengths. Combust. Flame 2015, 162, 2431–2441. 10.1016/j.combustflame.2015.02.011. [DOI] [Google Scholar]
- Ding F.; Rosén A.; Campbell E. E. B.; Falk L. K. L.; Bolton K. Graphitic encapsulation of catalyst particles in carbon nanotube production. J. Phys. Chem. B 2006, 110, 7666–7670. 10.1021/jp055485y. [DOI] [PubMed] [Google Scholar]
- Pereira M. F. R.; Soares S. F.; Órfão J. J. M.; Figueiredo J. L. Adsorption of dyes on activated carbons: Influence of surface chemical groups. Carbon 2003, 41, 811–821. 10.1016/s0008-6223(02)00406-2. [DOI] [Google Scholar]
- Maldonado-Hódar F. J.; Moreno-Castilla C.; Rivera-Utrilla J.; Hanzawa Y.; Yamada Y. Catalytic graphitization of carbon aerogels by transition metals. Langmuir 2000, 16, 4367–4373. 10.1021/la991080r. [DOI] [Google Scholar]
- Rodríguez-Manzo J. A.; Pham-Huu C.; Banhart F. Graphene growth by a metal-catalyzed solid-state transformation of amorphous carbon. ACS Nano 2011, 5, 1529–1534. 10.1021/nn103456z. [DOI] [PubMed] [Google Scholar]
- Angın D. Effect of pyrolysis temperature and heating rate on biochar obtained from pyrolysis of safflower seed press cake. Bioresour. Technol. 2013, 128, 593–597. 10.1016/j.biortech.2012.10.150. [DOI] [PubMed] [Google Scholar]
- Xia W.; Hagen V.; Kundu S.; Wang Y.; Somsen C.; Eggeler G.; Sun G.; Grundmeier G.; Stratmann M.; Muhler M. Controlled etching of carbon nanotubes by iron-catalyzed steam gasification. Adv. Mater. 2007, 19, 3648–3652. 10.1002/adma.200700763. [DOI] [Google Scholar]
- Parihar A.; Sripada P.; Bambery K.; Garnier G.; Bhattacharya S. Investigation of functional group changes in biomass during slow pyrolysis using synchrotron based infra-red microspectroscopy and thermogravimetry-infra-red spectroscopy. J. Anal. Appl. Pyrolysis 2017, 127, 394–401. 10.1016/j.jaap.2017.07.010. [DOI] [Google Scholar]
- Wang S.; Dai G.; Yang H.; Luo Z. Lignocellulosic biomass pyrolysis mechanism: A state-of-the-art review. Prog. Energy Combust. Sci. 2017, 62, 33–86. 10.1016/j.pecs.2017.05.004. [DOI] [Google Scholar]
Associated Data
This section collects any data citations, data availability statements, or supplementary materials included in this article.


