

Abstract

G protein-coupled receptors (GPCRs) constitute the key component of cellular signal transduction. Accurately annotating the biological functions of GPCR proteins is vital to the understanding of the physiological processes they involve in. With the rapid development of text mining technologies and the exponential growth of biomedical literature, it becomes urgent to explore biological functional information from various literature for systematically and reliably annotating these known GPCRs. We design a novel three-stage approach, TM–IMC, using text mining and inductive matrix completion, for automated prediction of the gene ontology (GO) terms of the GPCR proteins. Large-scale benchmark tests show that inductive matrix completion models contribute to GPCR-GO association prediction for both molecular function and biological process aspects. Moreover, our detailed data analysis shows that information extracted from GPCR-associated literature indeed contributes to the prediction of GPCR–GO associations. The study demonstrated a new avenue to enhance the accuracy of GPCR function annotation through the combination of text mining and induction matrix completion over baseline methods in critical assessment of protein function annotation algorithms and literature-based GO annotation methods. Source codes of TM–IMC and the involved datasets can be freely downloaded from https://zhanglab.ccmb.med.umich.edu/TM-IMC for academic purposes.
1. Introduction
G protein-coupled receptors (GPCRs), also known as seven-transmembrane domain receptors, constitute a large protein family of integral membrane receptors that detect molecules outside the cell and activate internal signal transduction pathways and, ultimately, cellular responses. GPCRs are involved in many human diseases, such as central nervous system disorders and diabetes.1 The GPCR database, GPCRdb, has served the community for over 20 years and has recently been extended to include a more multidisciplinary audience. The accurate annotation of biological functions of GPCR proteins is thus crucial for understanding the physiological processes that they involve in. As GPCRs are often unstable in vitro and difficult to be purified,2 it is hard to obtain their functions via direct biological assays. Development of advanced computational methods for automated GPCR function annotation is therefore in great demand.
There are multiple ways to describe biological functions of proteins; gene ontology (GO)3 is a major initiative unifying the representation of gene and gene product attributes across all species, and is the most widely used function annotation vocabulary and also convenient for computer automation. GO depicts biological functions from three aspects: molecular function (MF), biological process (BP), and cellular component (CC).3 As the CC of GPCRs is almost always “plasma membrane”, this work focuses on the MF and BP aspects.
There have been a large number of computational methods developed for GO function prediction of general proteins.4 These methods can be divided into four categories.4 The first is based on the sequence homology transferal, in which a similarity search is performed for the full-length sequence of a target protein against the proteins with known biological functions, as implemented by GoFDR,5 blast2GO,6 and BAR.7 The second is based on sequence composition: the DeepGO8 program and CAFA3 (CAFA, critical assessment of protein function annotation algorithms) winner GoLabeler9 use sequence composition as one of their features. The third category of methods is based on structure templates, which are designed to infer the function of the target proteins from structurally similar function templates, with COFACTOR10 and ProFunc11 being classical examples. The fourth category is based on biological networks, including protein–protein interaction (PPI), genomic neighborhood, and co-expression patterns. For example, Jones-UCL12 and MS-k-nearest neighbor (KNN)13 in CAFA112 use PPI as one of their features. The differences among these four approaches are usually not distinct, as many state-of-the-art methods combine multiple kinds of functional annotation information. For example, most of the successful methods in CAFA, including Jones-UCL,12 MS-KNN,13 and CombFunc,14 are meta approaches that combine multiple categories of features. Wang et al. (2013) introduce profile–sequence search, profile–profile search, and domain co-occurrence networks for protein function prediction.15 Cao and Cheng (2016) introduce protein–protein and gene–gene interaction networks generated by Hi-C technique16 in protein function prediction.17 Cao et al. (2017) for the first time converted the protein function prediction problem into a language translation problem, and propose a new way to describe the GO space and sequence space, and finally use the neural machine translation method for the protein function prediction problem.18 However, with the rapid development of sequencing techniques, it is cheap and fast to produce protein sequences but relatively expensive and slow to obtain valuable function information from protein contents because of the shortage of traditional biological experimental techniques. Protein function prediction has faced a long outstanding challenge to fill the gap between the massive amount of protein sequences and their biological function.19 In addition, despite the significant effort and success, most of these algorithms are developed for general protein annotation and very few algorithms are available specifically for GPCR function annotations, although the focus on a specific protein family can enhance the specificity and accuracy of the method development. This motivates our development of a GPCR-specific function prediction algorithm.
Distinct from the aforementioned function prediction methods, our prediction approach is designed to take advantage of the enormous growth of literature related with GPCRs in public repositories. As more than 110 000 publications were returned by querying in PubMed using the keyword of “GPCRs”, there is an increasing urgency to improve the performance of GO annotations of GPCRs by text mining (TM) to explore massive functional information among these literature. Despite multiple attempts in the past, few studies have proven to be useful with regard to assisting real-world GO curation.20 A text-mining challenge for GO annotation in BioCreative IV was organized with two subtasks: (I) to automatically locate text passages that contain GO-relevant information (a text-retrieval task) and (II) to automatically identify relevant GO terms for the genes in a given article (a concept-recognition task),20 and multiple machine learning-based methods had been proposed, such as a naïve Bayes (NB) classifier, support vector machine (SVM), and so forth.20 Wong and Shatkay (2013) had developed a KNN classifier using text-based features for predicting protein GO functions.21 You and Zhu (2017) proposed an ensemble approach DeepText2GO, which integrates both text-based and sequence homology-based methods, to large-scale GO annotations of proteins.22
Although a few methods of mining GO functions from literature have been put forward over the past decade, much progress is still necessary for addressing the remaining challenges to facilitate real-world GO curation. It mainly includes: (1) in the literature-based GO annotation challenge at BioCreative IV, only about 1/3 of the annotated GO terms can be exactly matched in the corresponding articles.20 It means that massive information related with GO terms is hidden in literature; thus, it is important to design new methods to mine these hidden information. (2) There are lots of irrelevant mentions which share names with GO terms in literature, for example, the GO term “growth” is a common word, but additional contextual information should be needed to determine if this high-level term could be used for GO annotations.20 New GO annotation methods must be able to filter irrelevant mentions automatically. (3) In the GO function prediction of GPCR proteins, only “positive” labels are observed and no experimentally verified negative samples, that is, typically most entries are missing (“unlabeled”), indicating that it is essentially a positive-unlabeled learning problem rather than a traditional supervised learning problem (positive–negative learning) which has been widely used in the GO function prediction of proteins. Moreover, GPCR proteins usually have multiple GO functions. Thus, the GPCR function prediction can be equivalently formalized as the GPCR-GO association matrix completion task. Here, text information of GPCR proteins and GO terms are respectively named as the GPCR feature space and the GO feature space, and the GO label spaces of GPCR proteins are called as the GPCR-GO association matrix in this paper. (4) Most related studies only consider the protein information and ignore the information of label space (GO terms) that are also critical to annotating the biological functional terms.
In this work, we propose a novel approach, TM–IMC, for automatically predicting GPCR’s biological functions, as represented in GO terms, by combining TM and inductive matrix completion (IMC). The approach consists of three stages. First, vector presentation of text information is implemented by the Word2Vec tool23 which uncovers functional information of GO terms implied in literature and automatically filter irrelevant words shared names with GO terms in article. Then, we formulate the multiple vector transformation for each GPCR protein or each GO term as a multi-instance learning task, and adopt the novel multi-instance learning algorithm miFV24 to obtain a single vector. Finally, we convert the function prediction problem into the GPCR-GO association matrix completion task, and construct a positive-unlabeled IMC model25 where text information of GPCR proteins and GO terms are taken into account simultaneously. Experimental results show that text information significantly contributes to the improvement of the model performance. Source codes and datasets are made freely available to the academic community at https://zhanglab.ccmb.med.umich.edu/TM-IMC.
2. Results and Discussion
2.1. Contributions of IMC
In this paper, the GO function prediction of GPCR proteins is converted into the GPCR-GO association matrix completion task, and a positive-unlabeled IMC model was constructed for this task. Here, the contribution of the IMC model on the prediction of GPCR-GO associations was examined in control with five state-of-the-art matrix completion methods including ALM,26 SVT,27 FPCA,28 LMaFit,29 and Maxide.30 The ALM method applied the augmented Lagrange multiplier method for exact recovery of corrupted low-rank matrices.26 The FPCA method adopted fixed point and Bregman iterative algorithms for solving the linearly constrained matrix rank minimization problem.28 The LMaFit method solved a low-rank factorization problem for matrix completion by a nonlinear successive over-relaxation algorithm that only requires solving a linear least squares problem per iteration.29 The SVT method approximated the matrix completion with minimum nuclear norm by a singular value thresholding algorithm.27 The Maxide method speedups matrix completion with side information by reducing the requirement on the number of observed entries.30 The programs of these methods can be downloaded online or obtained from the original authors and most of them have been successfully applied in similar studies.30,31 All the control methods are run with the default parameter setting.
Figure 1 shows the contribution of IMC models in GPCR-GO association prediction for MF and BP, in control with five state-of-the-art matrix completion methods. The results also show that our IMC-based methods TM–IMC can generate a higher number of correct GPCR-GO association prediction over all r range than all the control matrix completion methods. For example, for the MF aspect, when the r value is equal to 100 (i.e., the top-100 GPCR proteins with the highest score for each GO term are evaluated), the recall of TM–IMC is close to 0.40, whereas the runner-up method SVT is 0.35. The worst method FPCA has a recall of 0.16, approximately 0.24 lower than TM–IMC (Figure 1). For the BP aspect, it is shown that the recall of TM–IMC is about 0.48, which is higher than that of the second and third best methods from SVT (0.37) and FPCA (0.36), respectively. The worst performance is reached by Alm (0.16), only one-third of that of TM–IMC (Figure 1).
Figure 1.
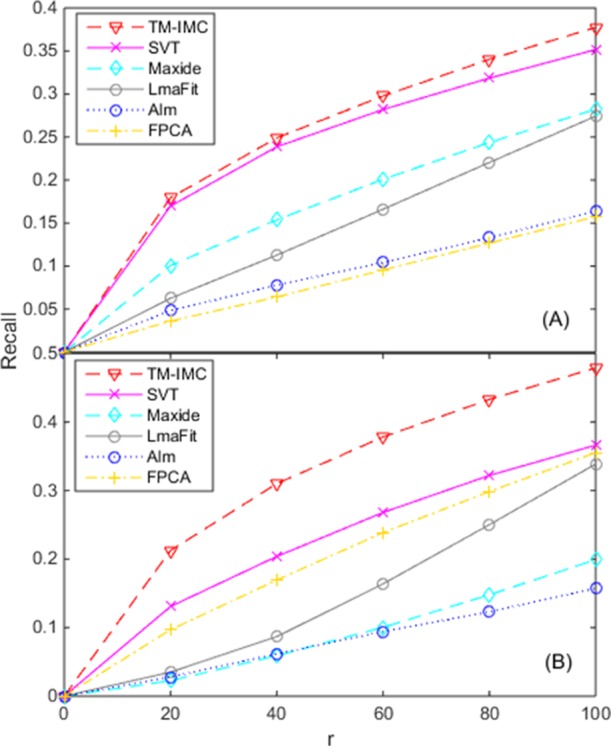
Contribution of IMC models in GPCR-GO association prediction for (A) MF and (B) BP. The horizontal axis denotes the top-r GPCRs with the highest score for each GO term that is evaluated.
2.2. Contributions of GPCR Text Information
A critical component of TM–IMC is the feature vectors representing each GPCR (orange matrix in Figure 8). As explained in previous sections, these feature vectors are constructed from the text of GPCR-associated literature. In this section, we demonstrate the usefulness of text features in comparison to baseline features derived from sequence. To facilitate the comparison, we group the appending GPCR features into four groups of information: amino acid triplet information, amino acid correlation (AAC) information, evolutionary information, and secondary structure information, as discussed in detail in the following paragraphs.
Figure 8.

Schematic of TM–IMC. The approach consists of three stages: vector representation of text information by Word2Vec, transformation of multiple instances into single vector by miFV, and construction of IMC prediction models.
2.2.1. Amino Acid Triplet Information
We divide 20 amino acids into 6 classes according to their dipole moment and side chain volume of amino acids,32 that is, class A: Ala, Gly, Val; class B: Ile, Leu, Phe, Pro; class C: Tyr, Met, Thr, Ser, Cys; class D: His, Asn, Gln, Tpr; class E: Arg, Lys; F: Asp, Glu. Then, the amino acid triplet frequency (conjoint triad) in a GPCR protein is calculated by33
| 1 |
where a, b, c ∈ {A, ..., F}; Nabc represents the number of each kind of amino acid triplet that occurred in a protein; n is the length of the amino acid sequence. For each GPCR, the conjoint triad feature dimension is 216.
2.2.2. AAC Information
Given the 6 amino acid classes, the AAC of each two classes of amino acids in a GPCR protein is computed by
| 2 |
where i, j ∈ {A, ..., F}; Pi and Pj represent the frequencies of the i-th and j-th class of amino acids that occurred in a protein, respectively; Pij(k) denotes the joint frequency of the i-th and j-th class of amino acids with k interval residues that occurred in a protein, and k ∈ {2, 4, 8, 16}. For each GPCR protein, the AAC feature dimension is 144.
2.2.3. Evolutionary Information
Evolutionary information of a GPCR protein in terms of its position-specific scoring matrices (PSSMs) is generated using the PSI-BLAST program34 against the NCBI-NR database by three iterations with the expected value of 0.01. For each GPCR, the PSSMs contain 42 × n elements, where n is the length of the amino acid sequence. The PSSM elements are scaled to fall within the range 0–1 by the standard logistic function
| 3 |
As the length of the amino acid sequence is different for different proteins, the sizes of the PSSM elements are diverse for GPCR proteins. In this paper, the 42 elements for each residue are regarded as an instance, such that each GPCR can be presented as a bag of n instances. Then, the miFV algorithm24 is used to convert the bag of instances into a vector with the dimension of 200 for each GPCR protein.
2.2.4. Secondary Structure Information
The PSIPRED program35 is used to predict the secondary structures of GPCR proteins. Here, the secondary structure consists of three types, i.e., helix (H), sheet (E), and coil (C). The propensity of secondary structure element correlation (SSC) can reflect the motif information of secondary structures of GPCRs, which is very important for understanding biological functions of GPCRs. The SSC in a GPCR protein is calculated by
| 4 |
where m, n ∈ {H, E, C}; Pm and Pn denote the frequencies of the m-th and n-th type of secondary structure elements in a protein, respectively; Pmn(k) represents the joint frequency of the m-th and n-th type of secondary structure elements with k interval residues in a protein, and k ∈ {0, 2, 4, 8, 16}. For each GPCR, the SSC feature dimension is 72.
Figure 2 represents the dependence of the recall of TM–IMC on the combination of different feature sets. It is shown that the performance of predicting the GPCR-GO associations using GPCR text information is always better than those of the models that solely relied on amino acid triplet information, AAC information, evolutionary information or secondary structure information. For example, for the MF aspect, when r is equal to 100, the performance of our model is about 0.38, which is 0.11 higher than the worst model that relied on the secondary structure information; and for the BP aspect, when r = 100, the performance of our model is about 0.48, which is 0.15 bigger than the worst model that relied on the secondary structure information (Figure 2). Moreover, it is observed that the predictive performance is higher when text information is combined with other features. For example, for the MF aspect, when r = 100, about 0.03 improvement is achieved for the model based on amino acid triplet information, 0.06 improvement for evolution information, 0.07 improvement for amino acid association information, and 0.12 improvement for secondary structure information; and for the BP aspect, when r is equal to 100, approximately 0.10 enhancement is reached for the model that relied on amino acid triplet information, 0.14 enhancement for amino acid association information, 0.15 enhancement for evolution information, and 0.19 enhancement for secondary structure information (Figure 2). The results demonstrate that the GPCR text information indeed contributes to the prediction of GPCR-GO associations, probably because GPCR text information provides different classification clues from their sequences or structures. This suggests a future direction for further improvement of the TM–IMC program where we can supplement the current TM-based features with sequence-derived information.
Figure 2.
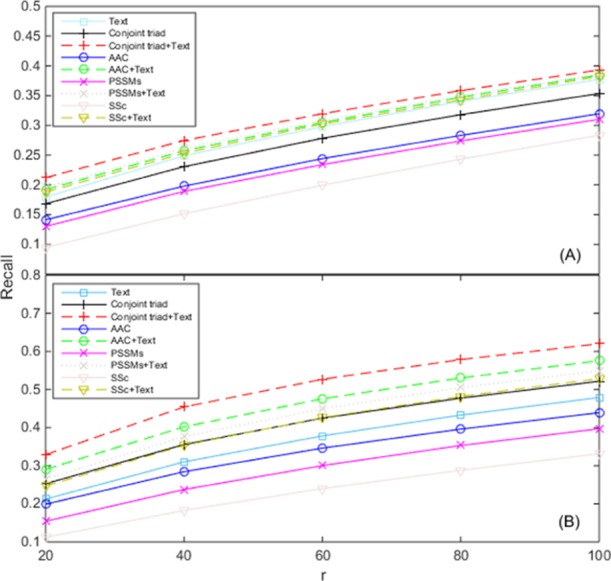
Contribution of text information of GPCR proteins on the prediction of GPCR-GO associations about (A) MF and (B) BP. The legend shows various protein information. The horizontal axis denotes the top-r GPCRs with the highest score for each GO term that are evaluated. In all experiments, the same GO text information is used for generating the GO features, whereas the GPCR features respectively arises from the text information, the amino acid triplet information (conjoint triad), amino acid association information (AAC), evolution information (PSSMs), secondary structure information (SSC), and their appending with the text information.
2.3. Impact of GPCR Text Information Entries
The protein-level text information of GPCRs extracted from the UniProt database contains multiple entries from protein name, organism, keywords for MF or BP, and titles of related publications. In Figure 3, we examine the contribution of each entry of GPCR text information to the prediction accuracy of the GPCR-GO associations.
Figure 3.
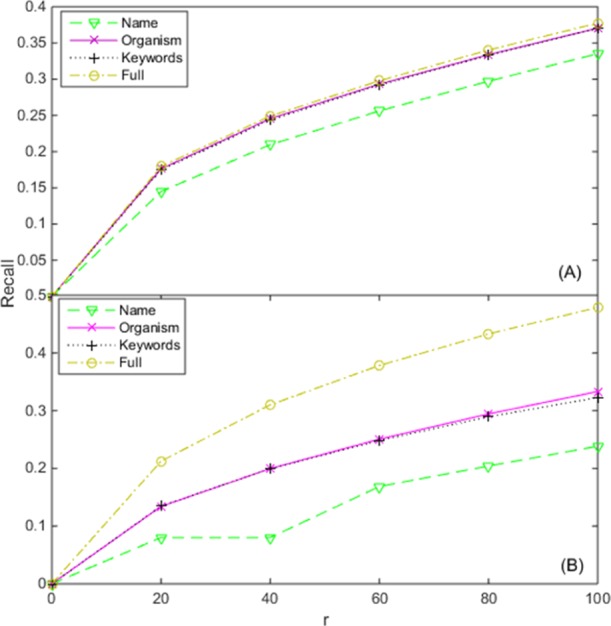
Contribution of various text information entries of GPCR proteins on the prediction of GPCR-GO associations about (A) MF and (B) BP. The legend shows various text information entries of GPCR proteins. Name: removing of the entry of protein name; organism: removing of the entry of organism; keywords: removing of the entry of keywords for MF or BP; full: no entry is removed. The horizontal axis denotes the top-r GPCRs with the highest score for each GO term that is evaluated.
As it is shown in Figure 3, the model performance will become worse for both MF and BP aspects, when removing each entry of GPCR text information from TM–IMC. This suggests that all the entries have had a positive impact on the TM–IMC models. We also tried to remove the entry of “titles of related publications”; no results are returned for both MF and BP aspects because most predictive scores in each column of the association matrix are the same and the evaluation criterion cannot be calculated. Thus, no data are listed for this entry in Figure 3. This error happens as most of the GPCR text information we extract belongs to the entry of “titles of related publications”, and when it is deleted, the remaining information cannot discriminate the differences among GPCR proteins. Overall, based on the impact to the performance of TM–IMC, the importance of the GPCR text information to the prediction of GPCR-GO associations for both MF and BP aspects can be approximately ranked as: titles of related publications > protein name > keywords for MF > organism.
2.4. Effect of Rank and Iteration Parameters and Single Vector Converting
There are several critical parameters and options in TM–IMC which have been carefully determined in our training datasets. Here, we examine how the performance of GPCR-GO predictions is affected by these parameters and options in our testing dataset.
The first key parameter of TM–IMC is the rank k of the association matrix, where Figures 4A and 5A present the dependence of performance of TM–IMC on different k values for MF and BP aspects, respectively. For the MF aspect, the performance of TM–IMC increases when k increases from 10; when k increases to 50, the model achieves a peak performance, and when k increases to 200, the performance remains almost unchanged. However, the performance decreases when k = 300 (Figure 4A). Similar trends happen on the BP aspect (Figure 5A). The default value for parameter k was set to 50 in TM–IMC for both MF and BP aspects.
Figure 4.
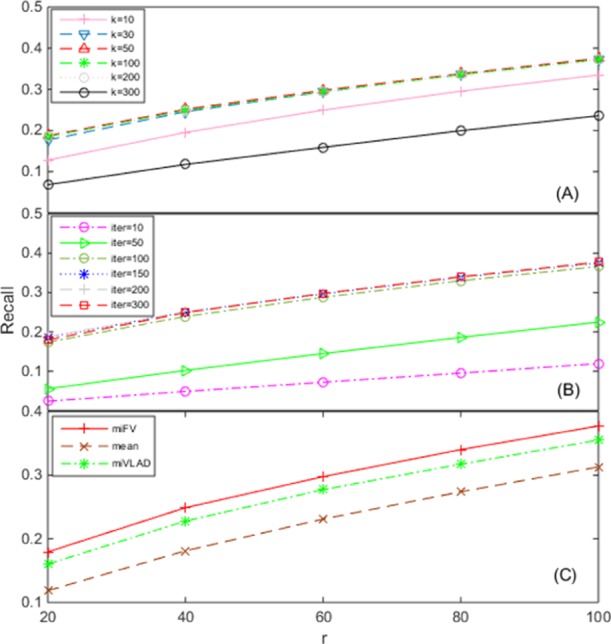
Dependence of TM–IMC performance for predicting GO MFs of GPCR proteins on the (A) rank k of the GPCR-GO association matrix, (B) number of iteration of alternative optimization (Iter), and (C) method for multiple instances to the single vector conversion. The horizontal axis denotes the top-r GPCRs with the highest score for each GO term that is evaluated.
Figure 5.
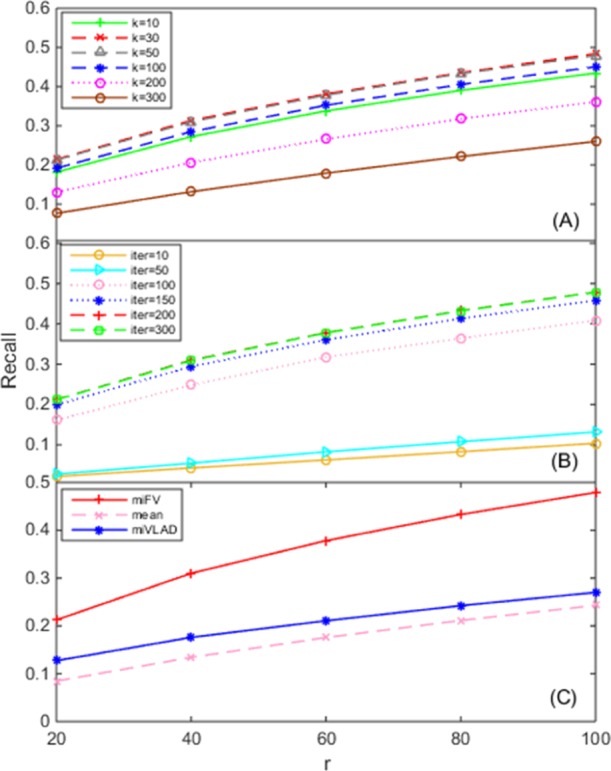
Dependence of TM–IMC performance for predicting GO BPs of GPCR proteins on the (A) rank k of the GPCR-GO association matrix, (B) number of iterations of alternative optimization (Iter), and (C) method for multiple instances to single vector conversion. The horizontal axis denotes the top-r GPCRs with the highest score for each GO term that is evaluated.
Another important parameter is the number of iterations (Iter) for terminating the alternative optimization in the induction matrix completion stage. As seen from Figures 4B and 5B, with the increase of the parameter Iter (starting from 10), the model performance has obvious increases; when Iter reaches 150, the improvement gets saturated. The default Iter value was set to 150 in TM–IMC for both MF and BP aspects.
Finally, a critical step in the TM–IMC pipeline is the transformation of the multiple instances into a single vector (Figure 8). TM–IMC has three options to complete the vector transformation, including the miFV algorithm, the miVLAD algorithm,24 and the mean method. The miFV uses the Fisher vector representation, whereas the miVLAD adopts the vector of locally aggregated descriptors representation.24 In the mean method, the single vector is generated by simply averaging each dimension of all instances in one bag. The performance of GPCR-GO predictions using each of the three methods is displayed in Figures 4C and 5C, which shows that miFV slightly outperforms miVLAD, and also outperforms the average based method on both MF and BP aspects. The default method for the transformation of multiple instances into a single vector is set to miFV in TM–IMC for both MF and BP aspects.
2.5. Comparison with Baseline Methods in CAFA
The CAFA is an experiment designed to provide a large-scale assessment of computational methods dedicated to predicting protein function.12,36 Three baseline methods which were used to predict protein function in CAFA include naïve baseline, BLAST, and PSI-BLAST.12,36 To illustrate the effectiveness of our method in function prediction of GPCR proteins, these baseline methods were compared in this paper. For naïve baseline, the prediction score for each term is assigned by the prior probability of that term in the database of experimentally annotated proteins. If a term “receptor activity” is with the relative frequency of 0.067, each target protein was appointed by the score 0.067 for that term. Therefore, the same predictions were assigned to all targets by the naïve method.12,36 For BLAST, it relies on the BLAST hits by querying the proteins with experimentally annotated functions. The prediction score for a specific term was arranged by the greatest sequence identity between the target protein and the BLAST hits with that term experimentally verified. The highest one was saved if a term was hit with multiple sequence identity scores.12,36 For PSI-BLAST, a sequence profile was produced by querying the UniRef90 sequence library37 by three iterations under an E-value cutoff of 0.01. These profiles are then searched for in the UniProt-GOA database of experimentally annotated proteins to assign terms to the target sequence.12,36 In order to validate the effectiveness of our approach objectively, similar with the CAFA experiments, the GO performance is mainly evaluated by the Fmax measure,14 which calls the maximum harmonic average between precision and recall over all thresholds
| 5 |
where t is the decision threshold with the range from 0 to 1, and pr(t) and re(t) denote the precision and recall value at the threshold t. As it is shown in Figure 6, TM–IMC can achieve a higher prediction performance in GO prediction of GPCRs for MF and BP than all the baseline methods in CAFA, indicating that our method is effective in predicting the GO biological functions of GPCRs.
Figure 6.

Performance of TM–IMC in GPCR-GO association predictions for MF and BP in control with three baseline methods in CAFA.
2.6. Comparison with Literature-Based GO Annotation Methods
A text-mining task for literature-based GO annotation in BioCreative IV challenge20 was organized and multiple machine learning-based methods were proposed, such as NB20 and SVM.20 In addition, KNN21 and an ensemble approach22 had also been successfully applied in literature-based GO annotation for proteins. Here, we compare with these methods where random forest represents an excellent ensemble learning method. Because of different datasets and text-based features used in literature-based GO annotation methods, performance comparison was implemented for predicting GO functions of GPCRs by adopting the features we extracted and the Fmax measure evaluated in CAFA.12,36 As shown in Figure 7, our method TM–IMC has higher F-measure than all literature-based machine learning methods in predicting GO functions of GPCRs on both MF and BP aspects. This is probably because our method TM–IMC has taken into account both the text information of GPCR proteins and GO terms simultaneously, whereas that of GPCRs is only considered by the control methods.
Figure 7.

Performance comparison of TM–IMC in predicting GO functions of GPCRs in control with literature-based GO annotation methods. NB: naïve Bayes; SVM: support vector machine; KNN: k-nearest neighbor; RF: random forest.
3. Conclusions
In this paper, we propose a novel approach TM–IMC for TM-based GPCR function prediction. The method includes three stages. First, the text information is represented by using the TM tool Word2Vec. Then, a bag of instances describing specific function terms are transformed into single vector by the multi-instance learning algorithm miFV. Finally, the protein function prediction is formulated as the protein-function association matrix completion problem, which can be solved by the IMC method.
The approach is applied to the GO biological function prediction of GPCRs. The results on the large-scale benchmark tests show that TM–IMC can generate accurate and robust function predictions. Detailed data analysis shows that GPCR text information has the major contribution on the improvement of the performance. The source codes and databases of TM–IMC have been made freely available through the public platform GitHub at https://zhanglab.ccmb.med.umich.edu/TM-IMC, where users can use the package to predict the GO MFs or BPs of GPCR proteins, as well as to design their own models to solve their problems on the basis of our proposed general learning framework, including creating models for the function prediction of other proteins (Supporting Information 1). Also, function determination for GPCRs is ridiculously difficult; thus, in the future more information should be taken into consideration to help solve this task, especially for the de-orphanization of GPCRs.
4. Databasets and Methods
4.1. Datasets
To prepare the dataset, we first download the list of all 3052 GPCRs curated by the UniProt database (https://www.uniprot.org/docs/7tmrlist).38 A sequence clustering using blastclust34 is performed at a sequence identity cutoff of 90%, to remove the redundant GPCR entries; this results in 1874 nonredundant GPCR proteins.
Next, the “gene_association.goa_ref_uniprot” file is downloaded from the UniProt-GOA ftp site (ftp://ftp.ebi.ac.uk/pub/databases/GO/goa/),38 from which the GO terms of all proteins in the nonredundant GPCR dataset are obtained (but ignoring the GO terms with inferred from electronic annotation or no biological data available evidence codes). For each GO term associated with a GPCR, its parent GO terms, as defined by Jan 2018 version of obo format GO (“go.obo” file from http://geneontology.org/page/download-ontology), are also added for depicting its MFs or BPs.
Overall, the nonredundant GPCR protein dataset contains a total of 479 and 3917 unique GO terms for MF and BP aspects, respectively Here, GO terms associated with more than 60% of GPCRs are removed, because they are mostly noninformative terms such as “protein binding” or “GPCR activity”. Finally, we obtained 1674 GPCR proteins with 209 GO terms for MF and 1277 GPCR proteins with 1406 GO terms for BP, respectively, which constitutes the final GPCR and GO set of this study.
4.2. TM–IMC Pipeline
The TM–IMC approach includes three stages: vector representation of text information, transformation of multiple instances into single vector, and construction of IMC prediction models. A schematic illustration of the pipeline is depicted in Figure 8.
4.2.1. Vector Representation of Text Information
For each GPCR, the text information extracted from the UniProt database includes four entries: protein name, organism, keywords for MF or BP, and titles of related publications. A query of literature is performed by entering the keyword “receptor” in the biomedical literature database PubMed, where more than one million articles will be retrieved. The abstracts of these articles are treated as the vocabulary, where a vector representation of text information of each GPCR protein is implemented using the Word2Vec tool23 developed by Google, which has been trained to reconstruct linguistic contexts of words. Other keywords “G protein-coupled receptors” and “GPCRs” were respectively implemented for a query of literature in PubMed to check the performance impact of the vocabularies. As shown in Table S1 in the Supporting Information, there is little difference in performance when different keywords are used.
Word2Vec23 was used to train each word among the GPCR text information into a vector of floats. It mainly includes two model architectures to produce a distributed representation of words: the continuous skip-gram model and the continuous bag-of-words (CBOW) model. The skip-gram model predicts its surrounding words given the current word, whereas the CBOW model predicts the current word based on the context surrounding.
The skip-gram model’s objective function is to maximize the likelihood of the prediction of contextual words for GPCR proteins when given the center word. Let ω = {ω1, ω2, ω3, ..., ωT} be a sequence of training words for GPCR proteins; we wish to maximize
| 6 |
where c is the parameter indicating the window size of context words, ωt is the center word and ωt+i is one of the surrounding words. Then, the probability of predicting the word ωo given the word ωi is defined as
| 7 |
where υω and υω′ are the “input” and “output” vector representations of ω, and W is the number of words in the vocabulary. This is referred to as the softmax objective. However, for larger vocabularies it is inefficient to compute υωi as it can be time-consuming. This problem can be addressed by using the hierarchical softmax objective function and resorting to negative sampling.39 The CBOW model in Word2Vec is similar to the skip-gram model, which can predict the center word ω0 given a representation of the surrounding words ω–c, ..., ω–1, ω1, ..., ωc.23
Whereas Word2Vec is a tool for converting a word into a vector, two entries of the GPCR text information, i.e., the keywords for MF or BP and the titles of related publications, mostly exist in the form of phrases or sentences. To obtain the vector representation of these two entries, the vector for each word among a phrase or sentence is obtained by Word2Vec, and then the vector for each phrase or sentence is generated by averaging all words’ vectors. Finally, a vector is depicted for each entity, such that each GPCR protein can be represented as a bag of instances.
The scheme of vector presentation for each GO term is similar to that of a GPCR protein. First, the text information for each term is obtained from the “go.obo” file, including name, def, and synonym information. Then, a query of the PubMed database is implemented using the keyword “gene function”, and about 1.8 million papers are returned. The abstracts of these returned papers are regarded as the vocabulary, and the Word2Vec tool is performed to convert the GO term text information into vectors. Finally, a vector is presented for each entity, so that each GO term can also be represented as a bag of instances.
4.2.2. Transformation of Multiple Instances into a Single Vector
For each GPCR, it has a bag of instances. We can use the miFV algorithm24 to convert the bag of instances of each GPCR into a Fisher vector based on a Gaussian mixture model (GMM). Let us assume that the i-th GPCR is Xi = {xi1, ..., xij, ..., xini}, where xij is its j-th instance. In the multi-instance learning, we assume that the instances in Xi are independently and identically distributed. Thus, a natural choice of getting the probability of the i-th GPCR protein sample is a GMM. We can estimate the parameters of the GMM on the training GPCR bags using maximum likelihood estimation
| 8 |
where the component pk denotes the k-th Gaussian
| 9 |
and λ = {ωk, μk, ∑k, k = 1, 2, ..., K} is the parameter set of the K-component GMM, and ωk, μk, and ∑k are the mixed weight, mean vector, covariance matrix of the k-th Gaussian, respectively.
Following eq 3, the Fisher vector of the i-th GPCR (Xi) can be written as24
| 10 |
| 11 |
| 12 |
| 13 |
Here, fλXi is the Fisher vector of the i-th GPCR, where fωkXi, fμkXi, and fσkXi represent their mixture weight, mean, and covariance Fisher vector, respectively. γj(k) is the probability of xij generated by the k-th Gaussian model. For the i-th GPCR, assuming that it contains ni instances and the dimension of an instance is d, the dimension of the Fisher vector for each GPCR should be (2d + 1) × K, where K is the number of Gaussian components in GMM models.
Similarly, for each GO term, we employ the miFV algorithm24 to transform a package of multiple vectors into a Fisher vector whose dimension is (2d + 1) × K.
4.2.3. IMC Prediction Models
To facilitate the description, the above Fisher vectors of GPCR proteins and GO terms are respectively named as the GPCR feature space and the GO feature space, and the GO label spaces of GPCR proteins are called as the GPCR-GO association matrix in this paper.
Let P ∈ RNgr×Ngo denote the GPCR-GO association matrix, where Ngr and Ngo are the numbers of GPCR proteins and GO terms, respectively. Pij = 1 means that the i-th GPCR protein has the observed j-th GO MF, otherwise Pij = 0. Suppose that X ∈ RNgr×fgr represent the GPCR feature space which contains Ngr GPCR proteins, where xi ∈ Rfgr denotes the i-th GPCR protein. Assume that Y ∈ RNgo×fgo denote the GO feature space which contains Ngo GO terms, where yj ∈ Rfgo denotes the j-th GO term.
We adopt the positive-unlabeled IMC method25 to learn the GPCR-GO associations. This method intends to achieve the whole associations Z = WHT through the observed association matrix P, where Z ∈ Rfgr×fgo, W ∈ Rfgr×k and H ∈ Rfgo×k, and k is small. IMC assumes that the GPCR-GO association matrix Z is low rank, and the optimization problem we address is
| 14 |
where Ω are the observed entries of
GPCR-GO associations; the first term  is the loss function, i.e., l(a,b) = (a – b)2, which penalizes the deviation of estimated
entries from the observations. The second term is the regularization
term to control the model complexity and avoid overfitting, where
λ is the regularization parameter for balancing the loss function
term and the regularization constraint term. In TM–IMC, the
hyperparameter lambda is determined by threefold cross-validation.
is the loss function, i.e., l(a,b) = (a – b)2, which penalizes the deviation of estimated
entries from the observations. The second term is the regularization
term to control the model complexity and avoid overfitting, where
λ is the regularization parameter for balancing the loss function
term and the regularization constraint term. In TM–IMC, the
hyperparameter lambda is determined by threefold cross-validation.
The objective function (9) is nonconvex, which can be solved by an alternating minimization scheme (i.e., fix W and solve for H, and vice versa).40 When fixing W and updating H, eq 9 can be written as
| 15 |
where x̃i = WT × xi ∈ Rk. When fixing H and updating W, eq 9 can be written as
| 16 |
where ỹj = HT × yj ∈ Rk. Equations 10 and 11 are convex functions that can be solved using the conjugate gradient iterative procedure.
Finally, for any association Zab ∉ Ω, we can predict the association of the a-th GPCR protein and the b-th GO term by calculating xaTWHTyb.
4.3. Evaluation Criteria
The performance of TM–IMC is examined in the standard threefold cross-validation procedure, in which the known GPCR-GO associations are split into three equally sized groups. The TM–IMC model is first trained in two randomly selected groups, and then tested in the third remaining sample group. This procedure is repeated three times to ensure that each group is tested once, where the average performance in the three repeats is reported.
For each GO term in our data set, we rank all GPCRs by how strongly the method predicts them to be associated with the GO term. We first compute the true positive associations in the top-r GPCRs with the highest score for each GO term, and then the recall value, that is, the ratio that the true positive associations for all GO terms against all observed entries of GPCR-GO associations, are adopted to assess the models, as the measure of the performance of different matrix completion methods.31,41 As wet lab biologists can usually only perform experimental assays on a small number of proteins, that is a small value of r is desired, we mainly report the result up to r ≤ 100.
Supporting Information Available
The Supporting Information is available free of charge on the ACS Publications website at DOI: 10.1021/acsomega.8b02454.
Performance dependence on keywords for querying literature in PubMed; Code Usage (PDF)
This work was supported in part by the National Science Foundation of China (61872198, 81771478 and 61571233), the Natural Science Foundation of the Higher Education Institutions of Jiangsu Province (18KJB416005), the key University Science Research Project of Jiangsu Province (17KJA510003), the Natural Science Foundation of Nanjing University of Posts and Telecommunications (NY218092) and the National Science Foundation (DBI1564756).
The authors declare no competing financial interest.
Supplementary Material
References
- Heng B. C.; Aubel D.; Fussenegger M. An overview of the diverse roles of G-protein coupled receptors (GPCRs) in the pathophysiology of various human diseases. Biotechnol. Adv. 2013, 31, 1676–1694. 10.1016/j.biotechadv.2013.08.017. [DOI] [PubMed] [Google Scholar]
- Tautermann C. S. GPCR structures in drug design, emerging opportunities with new structures. Bioorg. Med. Chem. Lett. 2014, 24, 4073–4079. 10.1016/j.bmcl.2014.07.009. [DOI] [PubMed] [Google Scholar]
- Ashburner M.; Ball C. A.; Blake J. A.; Botstein D.; Butler H.; Cherry J. M.; Davis A. P.; Dolinski K.; Dwight S. S.; Eppig J. T.; Harris M. A.; Hill D. P.; Issel-Tarver L.; Kasarskis A.; Lewis S.; Matese J. C.; Richardson J. E.; Ringwald M.; Rubin G. M.; Sherlock G. Gene Ontology: tool for the unification of biology. Nat. Genet. 2000, 25, 25–29. 10.1038/75556. [DOI] [PMC free article] [PubMed] [Google Scholar]
- Erdin S.; Lisewski A. M.; Lichtarge O. Protein Function Prediction: Towards Integration of Similarity Metrics. Curr. Opin. Struct. Biol. 2011, 21, 180–188. 10.1016/j.sbi.2011.02.001. [DOI] [PMC free article] [PubMed] [Google Scholar]
- Gong Q.; Ning W.; Tian W. GoFDR: a sequence alignment based method for predicting protein functions. Methods 2016, 93, 3–14. 10.1016/j.ymeth.2015.08.009. [DOI] [PubMed] [Google Scholar]
- Conesa A.; Götz S. Blast2GO: A comprehensive suite for functional analysis in plant genomics. Int. J. Plant Genom. 2008, 2008, 1–12. 10.1155/2008/619832. [DOI] [PMC free article] [PubMed] [Google Scholar]
- Profiti G.; Martelli P. L.; Casadio R. The Bologna Annotation Resource (BAR 3.0): improving protein functional annotation. Nucleic Acids Res 2017, 45, W285–W290. 10.1093/nar/gkx330. [DOI] [PMC free article] [PubMed] [Google Scholar]
- Kulmanov M.; Khan M. A.; Hoehndorf R. DeepGO: predicting protein functions from sequence and interactions using a deep ontology-aware classifier. Bioinformatics 2017, 34, 660–668. 10.1093/bioinformatics/btx624. [DOI] [PMC free article] [PubMed] [Google Scholar]
- You R.; Zhang Z.; Xiong Y.; Sun F.; Mamitsuka H.; Zhu S. GOLabeler: improving sequence-based large-scale protein function prediction by learning to rank. Bioinformatics 2018, 34, 2465. 10.1093/bioinformatics/bty130. [DOI] [PubMed] [Google Scholar]
- Zhang C.; Freddolino P. L.; Zhang Y. COFACTOR: improved protein function prediction by combining structure, sequence and protein–protein interaction information. Nucleic Acids Res. 2017, 45, W291. 10.1093/nar/gkx366. [DOI] [PMC free article] [PubMed] [Google Scholar]
- Laskowski R. A.The ProFunc Function Prediction Server. Protein Function Prediction: Methods and Protocols; Humana Press, 2017; pp 75–95. [DOI] [PubMed] [Google Scholar]
- Radivojac P.; Clark W. T.; Oron T. R.; Schnoes A. M.; Wittkop T.; Sokolov A.; Graim K.; Funk C.; Verspoor K.; Ben-Hur A.; Pandey G.; Yunes J. M.; Talwalkar A. S.; Repo S.; Souza M. L.; Piovesan D.; Casadio R.; Wang Z.; Cheng J.; Fang H.; Gough J.; Koskinen P.; Törönen P.; Nokso-Koivisto J.; Holm L.; Cozzetto D.; Buchan D. W. A.; Bryson K.; Jones D. T.; Limaye B.; Inamdar H.; Datta A.; Manjari S. K.; Joshi R.; Chitale M.; Kihara D.; Lisewski A. M.; Erdin S.; Venner E.; Lichtarge O.; Rentzsch R.; Yang H.; Romero A. E.; Bhat P.; Paccanaro A.; Hamp T.; Kaßner R.; Seemayer S.; Vicedo E.; Schaefer C.; Achten D.; Auer F.; Boehm A.; Braun T.; Hecht M.; Heron M.; Hönigschmid P.; Hopf T. A.; Kaufmann S.; Kiening M.; Krompass D.; Landerer C.; Mahlich Y.; Roos M.; Björne J.; Salakoski T.; Wong A.; Shatkay H.; Gatzmann F.; Sommer I.; Wass M. N.; Sternberg M. J. E.; Škunca N.; Supek F.; Bošnjak M.; Panov P.; Džeroski S.; Šmuc T.; Kourmpetis Y. A. I.; van Dijk A. D. J.; Braak C. J. F. t.; Zhou Y.; Gong Q.; Dong X.; Tian W.; Falda M.; Fontana P.; Lavezzo E.; Di Camillo B.; Toppo S.; Lan L.; Djuric N.; Guo Y.; Vucetic S.; Bairoch A.; Linial M.; Babbitt P. C.; Brenner S. E.; Orengo C.; Rost B.; Mooney S. D.; Friedberg I. A large-scale evaluation of computational protein function prediction. Nat. Methods 2013, 10, 221. 10.1038/nmeth.2340. [DOI] [PMC free article] [PubMed] [Google Scholar]
- Lan L.; Djuric N.; Guo Y.; Vucetic S. MS-k NN: protein function prediction by integrating multiple data sources. BMC Bioinf. 2013, 14, S8. 10.1186/1471-2105-14-S3-S8. [DOI] [PMC free article] [PubMed] [Google Scholar]
- Wass M. N.; Barton G.; Sternberg M. J. E. CombFunc: predicting protein function using heterogeneous data sources. Nucleic Acids Res. 2012, 40, W466–W470. 10.1093/nar/gks489. [DOI] [PMC free article] [PubMed] [Google Scholar]
- Wang Z.; Cao R.; Cheng J. Three-Level Prediction of Protein Function by Combining Profile-Sequence Search, Profile-Profile Search, and Domain Co-Occurrence Networks. BMC Bioinf. 2013, 14, S3. 10.1186/1471-2105-14-S3-S3. [DOI] [PMC free article] [PubMed] [Google Scholar]
- Cao R.; Cheng J. Deciphering the association between gene function and spatial gene-gene interactions in 3D human genome conformation. BMC Genomics 2015, 16, 1–13. 10.1186/s12864-015-2093-0. [DOI] [PMC free article] [PubMed] [Google Scholar]
- Cao R.; Cheng J. Integrated protein function prediction by mining function associations, sequences, and protein-protein and gene-gene interaction networks. Methods 2016, 93, 84–91. 10.1016/j.ymeth.2015.09.011. [DOI] [PMC free article] [PubMed] [Google Scholar]
- Cao R.; Freitas C.; Chan L.; Sun M.; Jiang H.; Chen Z. ProLanGO: Protein Function Prediction Using Neural Machine Translation Based on a Recurrent Neural Network. Molecules 2017, 22, 1732. 10.3390/molecules22101732. [DOI] [PMC free article] [PubMed] [Google Scholar]
- Cruz L. M.; Trefflich S.; Weiss V. A.; Castro M. A. A. Protein Function Prediction. Methods Mol. Biol. 2017, 1654, 55–75. 10.1007/978-1-4939-7231-9_5. [DOI] [PubMed] [Google Scholar]
- Mao Y.; Van Auken K.; Li D.; Arighi C. N.; McQuilton P.; Hayman G. T.; Tweedie S.; Schaeffer M. L.; Laulederkind S. J. F.; Wang S.-J.; Gobeill J.; Ruch P.; Luu A. T.; Kim J.-j.; Chiang J.-H.; Chen Y.-D.; Yang C.-J.; Liu H.; Zhu D.; Li Y.; Yu H.; Emadzadeh E.; Gonzalez G.; Chen J.-M.; Dai H.-J.; Lu Z. Overview of the gene ontology task at BioCreative IV. Database 2014, 2014, bau086. 10.1093/database/bau086. [DOI] [PMC free article] [PubMed] [Google Scholar]
- Wong A.; Shatkay H. Protein function prediction using text-based features extracted from the biomedical literature: the CAFA challenge. BMC Bioinf. 2013, 14, S14. 10.1186/1471-2105-14-S3-S14. [DOI] [PMC free article] [PubMed] [Google Scholar]
- You R.; Zhu S.. DeepText2Go: Improving large-scale protein function prediction with deep semantic text representation. 2017 IEEE International Conference on Bioinformatics and Biomedicine (BIBM); IEEE, 2017; pp 42–49. [DOI] [PubMed]
- Mikolov T.; Sutskever I.; Chen K.; Corrado G.; Dean J.. Distributed Representations of Words and Phrases and their Compositionality. Advances in Neural Information Processing Systems, 2013; Vol. 26, pp 3111–3119.
- Wei X.-S.; Wu J.; Zhou Z.-H. Scalable Algorithms for Multi-Instance Learning. IEEE Trans. Neural Netw. Learn. Syst. 2017, 28, 957–987. 10.1109/TNNLS.2016.2519102. [DOI] [PubMed] [Google Scholar]
- Jain P.; Dhillon I. S.. Provable Inductive Matrix Completion. 2013, arXiv:abs/1306.0626. arXiv preprint. [Google Scholar]
- Lin Z.; Chen M.; Ma Y.. The augmented lagrange multiplier method for exact recovery of corrupted low-rank matrices. 2010, arXiv:1009.5055. arXiv preprint. [Google Scholar]
- Cai J.-F.; Candès E. J.; Shen Z. A singular value thresholding algorithm for matrix completion. SIAM J. Optim. 2010, 20, 1956–1982. 10.1137/080738970. [DOI] [Google Scholar]
- Ma S.; Goldfarb D.; Chen L. Fixed point and Bregman iterative methods for matrix rank minimization. Math. Program. 2009, 128, 321–353. 10.1007/s10107-009-0306-5. [DOI] [Google Scholar]
- Wen Z.; Yin W.; Zhang Y. Solving a low-rank factorization model for matrix completion by a nonlinear successive over-relaxation algorithm. Math. Program. Comput. 2012, 4, 333. 10.1007/s12532-012-0044-1. [DOI] [Google Scholar]
- Xu M.; Jin R.; Zhou Z.-H.. Speedup matrix completion with side information: Application to multi-label learning. Advances in Neural Information Processing Systems, 2013; Vol. 26, pp 2301–2309.
- a Natarajan N.; Dhillon I. S. Inductive matrix completion for predicting gene-disease associations. Bioinformatics 2014, 30, i60–i68. 10.1093/bioinformatics/btu269. [DOI] [PMC free article] [PubMed] [Google Scholar]; b Singh-Blom U. M.; Natarajan N.; Tewari A.; Woods J. O.; Dhillon I. S.; Marcotte E. M. Correction: Prediction and Validation of Gene-Disease Associations Using Methods Inspired by Social Network Analyses. PLoS One 2013, 8, e58977 10.1371/journal.pone.0058977. [DOI] [PMC free article] [PubMed] [Google Scholar]
- Wu J.; Liu H.; Duan X.; Ding Y.; Wu H.; Bai Y.; Sun X. Prediction of DNA-binding residues in proteins from amino acid sequences using a random forest model with a hybrid feature. Bioinformatics 2008, 25, 30–35. 10.1093/bioinformatics/btn583. [DOI] [PMC free article] [PubMed] [Google Scholar]
- Wu J.; Hu D.; Xu X.; Ding Y.; Yan S.; Sun X. A novel method for quantitatively predicting non-covalent interactions from protein and nucleic acid sequence. J. Mol. Graph. Model. 2011, 31, 28–34. 10.1016/j.jmgm.2011.08.001. [DOI] [PubMed] [Google Scholar]
- Altschul S.; Madden T. L.; Schäffer A. A.; Zhang J.; Zhang Z.; Miller W.; Lipman D. J. Gapped BLAST and PSI-BLAST: a new generation of protein database search programs. Nucleic Acids Res. 1997, 25, 3389–3402. 10.1093/nar/25.17.3389. [DOI] [PMC free article] [PubMed] [Google Scholar]
- McGuffin L. J.; Bryson K.; Jones D. T. The PSIPRED protein structure prediction server. Bioinformatics 2000, 16, 404–405. 10.1093/bioinformatics/16.4.404. [DOI] [PubMed] [Google Scholar]
- Jiang Y.; Oron T. R.; Clark W. T.; Bankapur A. R.; D’Andrea D.; Lepore R.; Funk C. S.; Kahanda I.; Verspoor K. M.; Ben-Hur A. An expanded evaluation of protein function prediction methods shows an improvement in accuracy. Genome Biol. 2016, 17, 184. 10.1186/s13059-016-1037-6. [DOI] [PMC free article] [PubMed] [Google Scholar]
- Suzek B. E.; Wang Y.; Huang H.; McGarvey P. B.; Wu C. H. UniRef clusters: a comprehensive and scalable alternative for improving sequence similarity searches. Bioinformatics 2014, 31, 926. 10.1093/bioinformatics/btu739. [DOI] [PMC free article] [PubMed] [Google Scholar]
- The Universal Protein Resource. Nucleic Acids Res. 2008, 35, 193–197. [Google Scholar]
- Goldberg Y.; Levy O.. word2vec Explained: deriving Mikolov et al.’s negative-sampling word-embedding method. 2014, arXiv:1402.3722. arXiv preprint. [Google Scholar]
- Yu H.-F.; Jain P.; Kar P.; Dhillon I.. Large-scale multi-label learning with missing labels. International Conference on Machine Learning, 2014; pp 593–601.
- Mordelet F.; Vert J.-P. ProDiGe: Prioritization Of Disease Genes with multitask machine learning from positive and unlabeled examples. BMC Bioinf. 2011, 12, 389. 10.1186/1471-2105-12-389. [DOI] [PMC free article] [PubMed] [Google Scholar]
Associated Data
This section collects any data citations, data availability statements, or supplementary materials included in this article.