Abstract
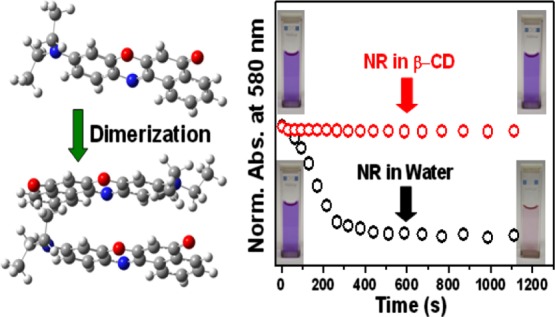
The present work, based on various spectroscopic investigations, vividly demonstrates the self-association of Nile red (NR) in aqueous medium. The rapid decrease in the absorbance as well as emission of NR in water bears the signature of the aggregation process. Appearance of a new blue-shifted absorption band in addition to the original one and a drastic decrease in the emission intensity imply that the aggregation is of H-type. Poor solubility of NR in water, hydrophobic interaction, and the planar structure of the dye are ascribed to favor the formation of the aggregate in the aqueous medium. Absorption-based kinetic studies reveal the aggregation process to be second order, thereby establishing the aggregate to be a dimer. Similar kinetic profiles of the absorbance of NR in the presence and absence of light confirm that the aggregation process is not photoassisted. The presence of an isosbestic point in the absorbance spectra and an isoemissive point in the time-resolved area normalized emission spectra bears the evidence of equilibrium between the dimeric and the monomeric species of NR in the ground state as well as in the photoexcited state. Encapsulation of the monomer of NR within the hydrophobic cavity of β-cyclodextrin is demonstrated to prevent the aggregation process.
1. Introduction
Aggregation of dye molecules has acquired much importance because of their versatile optoelectronic applications as photosensitizers,1 environment-sensitive dyes,2 designers of artificial light-harvesting antenna complexes, and so forth.3,4 Nature also exploits the electronic properties of the molecular aggregates in light-harvesting systems where chlorophyll chromophores are responsible for the energy-transfer process in the photosynthetic reactors.5
Most of the interesting photophysical properties of these aggregates originate from the strong coupling between the transition dipole moments of the adjacent dye molecules, leading to new electronic excitations delocalized over more than one monomer units.6 On the basis of the spatial orientations of the monomer units in the aggregates, two types of aggregates are characterized. In the first case, the absorption band corresponding to the aggregated form is bathochromically shifted with respect to that of the monomer band and in the second case, a blue-shifted band arises for the aggregated species. The former one is designated as J-aggregate as a tribute to Jelley,7 and the latter one is termed as H-aggregate for its distinctive hypsochromic shift of the absorption band.8 It is generally observed that end-to-end interaction between the dye molecules results in J-aggregates and H-aggregates are formed because of the π–π stacking of the monomer dye units.6 Further, J-aggregates are characterized by high fluorescence quantum yield, whereas H-aggregates have remarkably reduced fluorescence.6,8 The characteristic shifts in the absorption spectrum due to the self-association of the dye molecules are explained in terms of molecular exciton coupling theory, that is, coupling of the transition moments of the constituent dye molecules.8 Many theories have been proposed to explain the nature of the forces facilitating the self-association of the molecules in solution.9,10 The forces such as van der Waals interaction, intermolecular hydrogen bonding, dispersion force, hydrophobic interaction, hydrogen bonding with solvents, electrostatic interaction, and so forth play significant roles for the aggregation phenomenon.
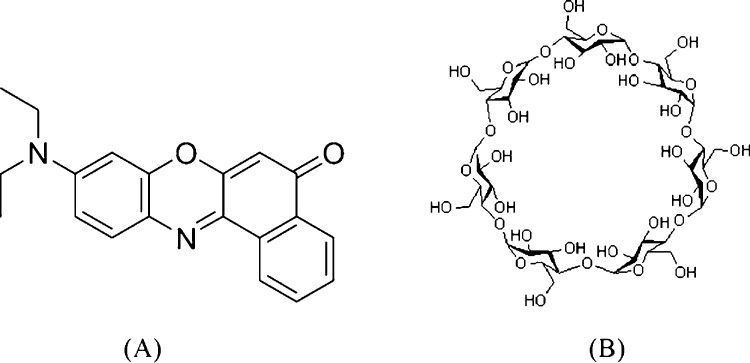
9-Diethylamino-5-benzo[a]phenoxazinone, commonly known as Nile red (NR) (Scheme 1A), has acquired much attention during the past few decades owing to its intense fluorescence in various media and its solvatochromic behavior.11−17 A twisted intramolecular charge-transfer (CT) state that arises due to the rotation of the diethylamino group attached to the rigid structure of the molecule rationalizes the positive solvatochromism of the fluorophore.18 The large spectral shifts in the absorption and emission bands in solvents of different polarities indicate nearly complete CT from the diethylamino group acting as an electron donor to the quinoid part acting as an electron acceptor. Because of its extreme sensitivity toward solvent polarity, NR has been exploited to study various microheterogeneous environments such as micelles, reverse micelles, cyclodextrins, liposomes, proteins, DNA, zeolites, and so forth.15,17−26 It has also been successfully used as an effective marker to develop simple but prospective strategies to deliver model drugs to targets as well as to excrete excess adsorbed drugs from the cell membranes.27−30
Scheme 1. Skeletal Structures of (A) NR and (B) β-CD.
Though NR is extensively used to monitor different hydrophobic environments, poor solubility in water (<1 μg mL–1)12 has restricted its use in the aqueous medium. Dutta et al. indicated the formation of organized aggregates of NR in binary solvent mixtures.18 Recently, Kurniasih et al. have reported the formation of nonemissive dimers or H-type aggregates of the dye in the aqueous surfactant and/or micellar solution.31 This interesting behavior of NR prompted us to unravel the intricacies underlying its behavior in the aqueous medium exploiting various steady-state and time-resolved spectroscopic techniques, and it has been categorically demonstrated that NR indeed forms H-aggregate in the aqueous medium even at very low concentration (micromolar range). Moreover, through host–guest interaction, it has been shown that in the presence of β-cyclodextrin (β-CD) (Scheme 1B), the aggregation of NR is prevented because of the formation of the inclusion complex between NR and β-CD.
2. Results and Discussion
2.1. Aggregation of NR in Water
2.1.1. Absorption Studies
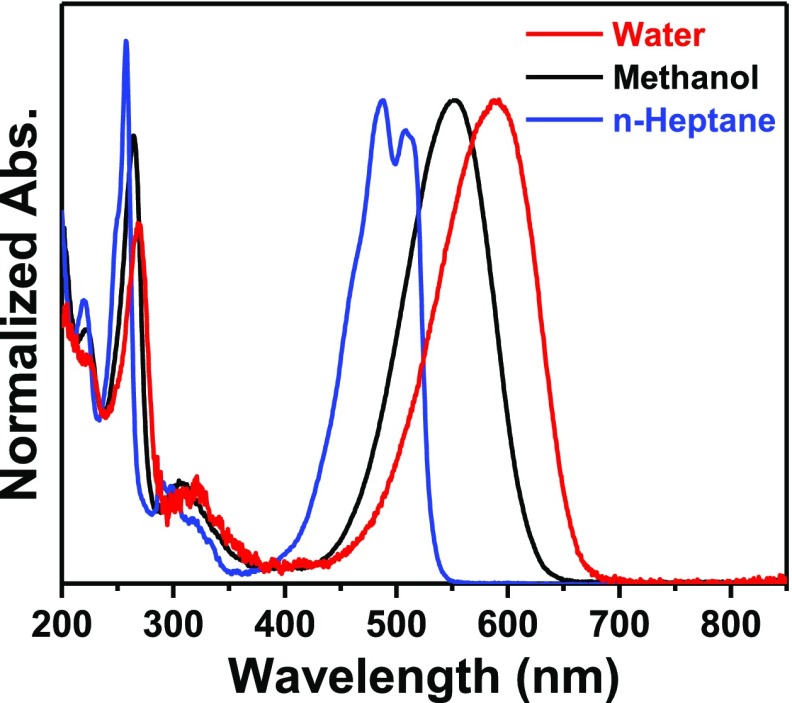
Absorption spectra of NR in water, methanol (MeOH), and n-heptane (Figure 1) depict large bathochromic shift of the absorption maximum with increasing solvent polarity. This observation is rationalized from the stabilization of the CT state of the dye in solvents of higher polarity.18 As various classes of dye molecules, such as cyanines,6 xanthenes,32−34 coumarins,35−39 phenazinium dyes,40 and so forth, form molecular aggregates revealing development of additional bands in their absorption spectra, the absorption spectra of NR were studied in three different solvents as a function of concentration of the dye.
Figure 1.
Normalized absorption spectra of NR in water, methanol, and n-heptane.
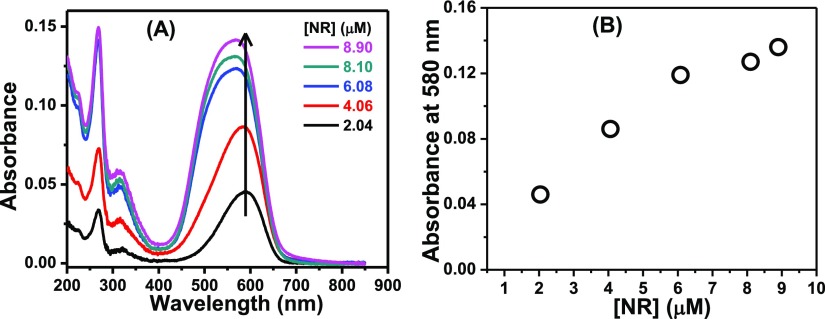
With increasing concentration of NR in MeOH and n-heptane, neither any deformity nor any new band was observed in the absorption spectra of the probe. The absorbance values in both these solvents followed Beer’s law negating the chance of the formation of any aggregated species. However, in water, the absorption spectrum became broad (Figure 2A) and the absorbance values with a variation of concentration deviated from Beer’s law (Figure 2B). These observations suggest the formation of aggregates of NR in the aqueous medium.
Figure 2.
(A) Absorption spectra of NR in water as a function of its concentration. The concentrations of NR are provided in the legends. (B) Plot for verification of Beer’s law.
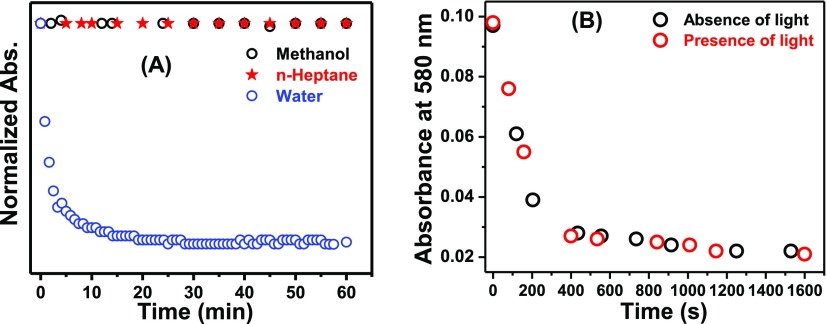
It is pertinent to mention here that the initial color of the aqueous solution of NR readily faded out on standing. However, no such fading of color was observed for the solutions of NR in MeOH and n-heptane. To account for this observation, the absorbance values at the corresponding absorption maxima (λmax) of NR in these three solvents were plotted as a function of time (Figure 3A). Figure 3A clearly depicts that there is negligible change in the absorbance values of NR in MeOH and n-heptane even on keeping the solutions for 1 h. On the contrary, a fast decay of the absorbance was observed in water which justifies the disappearance of color and indicates the self-association of NR in the aqueous medium. Poor solubility of NR in water, hydrophobic interaction, and the π–π stacking interaction owing to its planar structure (see Quantum Chemical Calculations) are ascribed to play roles for the formation of its aggregate in the aqueous medium.
Figure 3.
(A) Normalized absorbance of NR in different media as a function of time. λmoni = λmax. (B) Decays of the absorbances of NR in water in the presence and absence of light. [NR] = 6 μM.
To investigate whether the aggregation of NR in water is photoinduced or not, the decay of the absorbance was studied both in the presence and absence of light. To carry out the experiment, the same concentrations of NR were taken in two identical cells and the absorbance values of both the solutions were monitored. One of the cells was kept under constant illumination in the spectrophotometer, and the other one was under dark. At different time intervals, the absorbances of both the solutions were noted and plotted against time (Figure 3B). Identical decay profiles of the absorbances for both the situations rule out the process to be photoassisted.
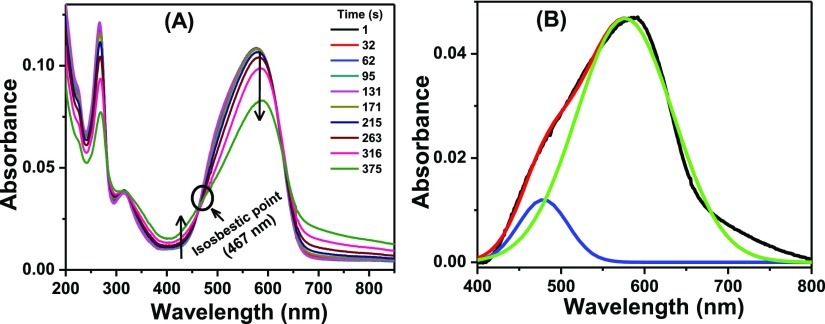
To study the ground state aggregation of NR in the aqueous medium, single-shot absorption spectra were recorded at different times. Figure 4A portraying the alteration in the absorption spectrum of the dye in aqueous medium at different times reveals that the absorbance at 580 nm (λmax) decreased and the spectra got widened with the progress of time giving rise to a new band at around 475 nm, resulting in an isosbestic point. Apparent rise in the absorbance values at the longer wavelength region of the spectrum (700–850 nm) is because of the modification of the baseline reflecting increased turbidity of the solution.35 Presence of any new band in this red-shifted region was discarded from the emission study (vide infra). The new blue-shifted band peaking at ∼475 nm is attributed to the H-aggregate of NR. Resolution of the absorption spectrum of NR after aggregation gave two distinct peaks at 478 and 576 nm (Figure 4B) corresponding to the aggregated and the monomeric forms of NR, respectively. Appearance of the isosbestic point establishes that the aggregate form remains in equilibrium with the monomeric form in the ground state.
Figure 4.
(A) Single-shot absorption spectra of NR in water at different times. The legends contain corresponding time intervals in seconds. [NR] = 6 μM. (B) Resolved absorption spectrum of NR in water after aggregation.
2.1.2. Absorption-Based Kinetic Study of the Aggregation Process
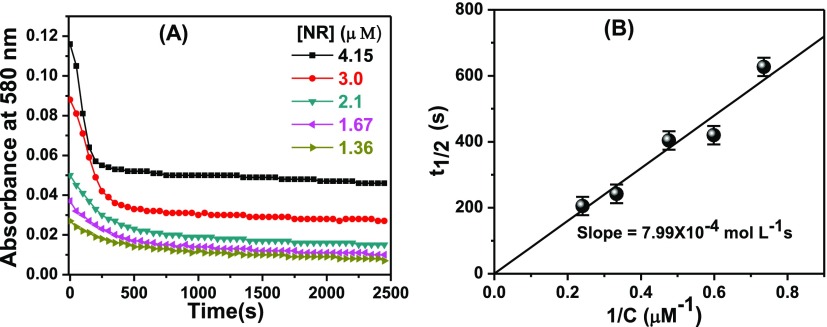
To shed light on the kinetic aspect of the aggregation process and to assess the nature of aggregation, decays of the absorbances with varying initial concentrations of NR in aqueous solutions were monitored at 580 nm (Figure 5A). Figure 5A reveals that with an increase in the initial concentration of the dye, decay of the absorbance became faster. From the decays, the half-life (t1/2) values were determined and they are listed against the initial concentrations of NR in Table 1.
Figure 5.
(A) Decay of the absorbance of aqueous solution of NR at different initial concentrations. The legends give the concentrations of NR. (B) Plot of the half-life (t1/2) values against initial concentrations of NR in aqueous solutions.
Table 1. Half-Life Values of Decays of Absorbance of NR in Water for Different Initial Concentrations.
| initial conc. of NR (μM) | half-life (t1/2) (s) |
|---|---|
| 4.15 | 205 |
| 3.0 | 242 |
| 2.1 | 404 |
| 1.67 | 420 |
| 1.36 | 627 |
As the half-life values are dependent on the initial concentrations of NR, it is obvious that the decay process does not follow first-order kinetics. An acceptable linearity of the half-life values against inverse of the initial concentrations of NR (Figure 5B) passing through the origin establishes the process to follow a second-order kinetics. The rate constant of the aggregation process was also determined from the plot which came out to be 1.25 × 10³ L mol–1 s–1 at 300 K. Thus, the kinetic analysis establishes that the aggregate of NR is a dimeric species.
2.1.3. Emission Studies
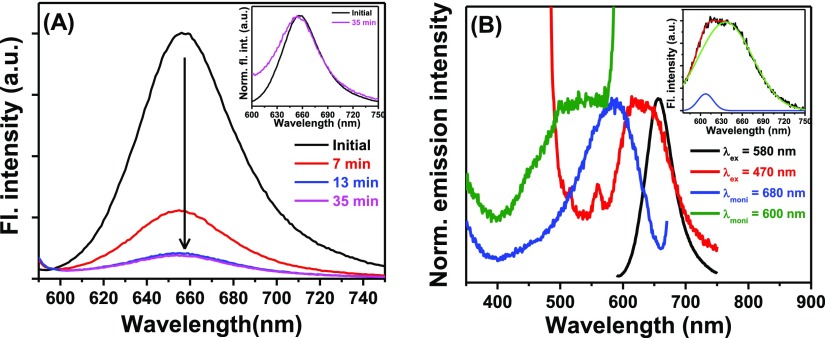
In addition to the absorption studies, fluorescence and fluorescence excitation spectra were also investigated to identify the aggregated form of NR in water. On exciting the aqueous solution of the dye at 580 nm, the peak maximum of the emission band was obtained at 656 nm (Figure 6A) that corresponds to the monomeric form of NR in water. Figure 6A further reveals that the emission intensity of NR in water decreased steadily with time. This substantial decrease in the emission intensity is attributed to the formation of the H-dimer of the dye in the solution as it is known that the H-aggregates have remarkably low fluorescence quantum yields.6,8 Because of the formation of the dimer, a blue shift (∼4 nm) was observed in the emission peak maximum of NR with the passage of time (inset of Figure 6A). In accordance with the absorption spectrum (Figure 4), when the aqueous solution of NR was excited at 470 nm, an emission spectrum of broad nature (Figure 6B, red) was obtained. On resolving the spectrum, one peak of higher intensity at 635 nm (green) and another peak of much lower intensity at 607 nm (blue) (inset of Figure 6B) were obtained. The peak with higher intensity is ascribed to the monomeric form and that with lower intensity is attributed to the H-dimer of NR. To establish that the apparent increase in the absorbance in the red region (700–850 nm) in the absorption spectrum of NR (Figure 4) is not due to any new species, the aqueous solution of the dye was excited at 750 nm that yielded no emission. On the basis of all of these experimental findings, any chance of the formation of J-aggregate was ruled out.
Figure 6.
(A) Emission spectra of NR in aqueous solution at different times. λex = 580 nm. The inset represents the normalized emission spectra of NR at two different times. (B) Normalized excitation and emission spectra of the aqueous solution of NR. Excitation and monitoring wavelengths are provided in the legends. The inset depicts the resolved emission spectrum of an aqueous solution of NR when excited at 470 nm.
To capture the fluorescence excitation spectra corresponding to NR and its H-dimer, monitoring wavelengths were chosen at two extremes of the emission spectra, that is, at 680 and 620 nm (Figure 6B). Monitoring at 680 and 620 nm, the excitation maxima were found to be at 588 and 500 nm (with a hump at around 450 nm in the latter case), respectively. The excitation maximum at 500 nm agreed with the blue-shifted absorption band (Figure 4) corresponding to the H-dimer of NR. These two visibly different excitation spectra (blue and olive) confirmed the existence of two different ground state species in the solution.
2.1.4. Time-Resolved Emission Studies
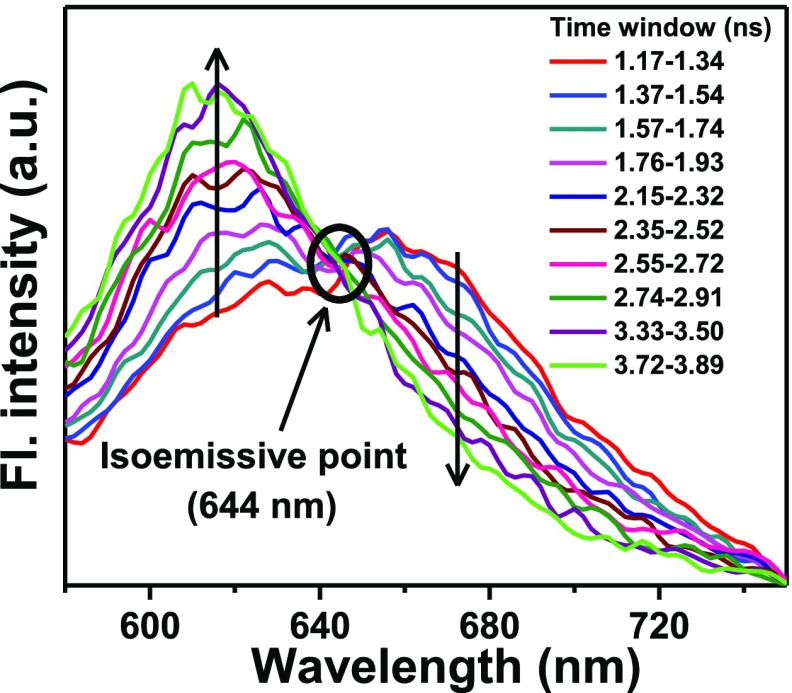
The time-resolved emission measurement serves as a very useful tool to investigate the excited-state behavior of NR in the aqueous medium. The lifetime values of the monomeric form of NR monitoring at 680 nm and that of the dimeric form monitoring at 600 nm were both in the picosecond region, being 443 ± 5020,22 and 565 ± 50 ps, respectively. Even this small difference in the lifetime values prompted us to perform the time-resolved area normalized emission spectral (TRANES) measurements41−43 within the wavelength region 580–750 nm (Figure 7) to find out if there is any equilibrium between the monomeric and the dimeric forms of NR in the photoexcited state. With increasing time, the band around 615 nm increased at the cost of the band at 665 nm. Clear observation of an isoemissive point at 644 nm unequivocally ascertained the coexistence of the two different species of NR and confirmed the equilibrium between the monomeric and dimeric species of NR in its excited state. Similar coexistence of the monomer and aggregates of various coumarin dyes has been recently demonstrated by Verma and Pal through TRANES study.38,39
Figure 7.
TRANES of NR in water upon photoexcitation at 560 nm. Time windows are provided in the legends.
2.2. Effect of β-CD on the Aggregation Process
2.2.1. Absorption Studies
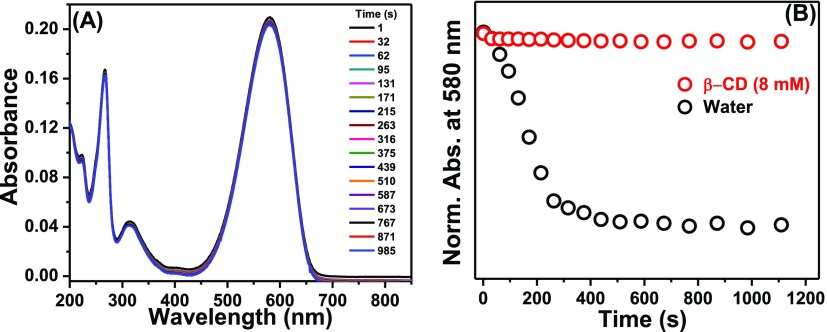
In the present work, our target was to find out if the self-association of NR in the aqueous medium could be prevented by host–guest interaction. For the purpose, β-CD was chosen as the suitable host as the interaction of NR with β-CD has already been investigated in detail by several groups22,24,29,30 and the formation of 1:1 NR−β-CD inclusion complex is confirmed by steady-state and time-resolved measurements.24 We intended to avoid the unwanted complications arising out of the multiple probe/CD stoichiometries (such as 1:1, 1:2, and 2:1) in γ-CD because of its bigger cavity size25 and therefore chose β-CD as the host to study the preventive action of the CD toward aggregation of NR in the simplest situation as β-CD is known to form 1:1 complex with NR. To divulge the effect of β-CD on the aggregation process of NR in water, we designed our experiments in two ways. In the first case, the stock solution of NR was directly added to 8 mM aqueous solution of β-CD and thoroughly shaken to make the solution homogeneous. Under this situation, the bluish color of the solution persisted for a much longer time which is evident from the single-shot absorption spectra of the solution (Figure 8A), showing negligible spectral change with time. A comparison of the kinetic profiles of the absorbance of NR at 580 nm in the presence of β-CD with that in the aqueous medium (Figure 8B) implied that the aggregation of NR was prevented in the presence of β-CD.
Figure 8.
(A) Single-shot absorption spectra of an aqueous solution of NR in the presence of 8 mM β-CD at different times. The legends represent corresponding times in seconds. (B) Decays of the absorbances of NR in water and in 8 mM β-CD solution. [NR] = 6 μM.
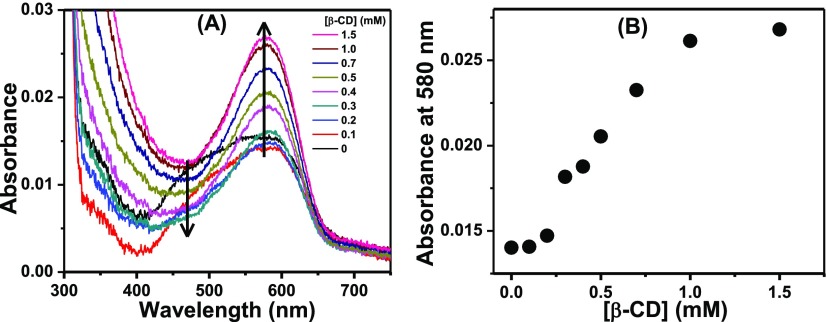
In the second case, an aqueous solution of NR was kept overnight to allow completion of the aggregation process. The broad nature of the absorption spectrum of this solution clearly bears the signature of the H-dimer of NR in the solution together with its monomeric form (Figure 9A). With the gradual addition of β-CD to this aqueous solution of NR, the absorbance of the hypsochromically shifted band corresponding to the dimeric form decreased and that of the monomer band increased (Figure 9A). This is because in the presence of β-CD, the monomeric form of NR got encapsulated within its hydrophobic cavity, thereby shifting the existing equilibrium between the monomeric and the dimeric forms of NR toward the monomer in accordance with the Le Chatelier’s principle.44 Plot of the absorbance values at 580 nm (absorption maximum of the monomer) against the concentrations of β-CD (Figure 9B) revealed that the absorbance of the monomer increased gradually until the final attainment of a plateau region.
Figure 9.
(A) Absorption spectra of NR in the aqueous medium with the addition of β-CD. The legends contain the concentrations of β-CD. (B) Variation of the absorbance of the aqueous solution of NR at 580 nm as a function of β-CD.
2.2.2. Emission Studies
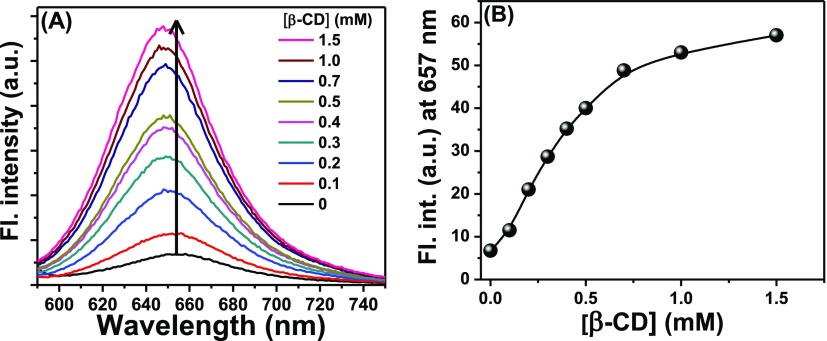
Steady-state emission measurements were performed to monitor the spectral modifications of an aqueous solution of NR in the presence of β-CD. From Figure 10A, it was observed that the emission intensity of NR in the aqueous medium increased steadily with the addition of β-CD because of the gradual increase in the monomeric form of NR at the cost of the H-dimer. A blue shift of ∼7 nm in the emission maximum indicated that the probe entered into a relatively less polar environment relative to water which, in turn, implied its encapsulation within the cavity of the β-CD.22,24,29,30 The emission intensity gradually increased with increasing concentration of β-CD and finally attained a plateau (Figure 10B) revealing a similar pattern as observed for its absorbance in a similar situation.
Figure 10.
(A) Emission spectra of NR with the addition of β-CD. The legends contain the concentrations of β-CD. (B) Variation of the fluorescence intensity of NR solution with the addition of β-CD.
2.3. Fluorescence Anisotropy Study
Fluorescence anisotropy serves as a useful tool to assay the rotational restriction imposed on a fluorophore by its immediate environment.45 In most of the low viscous pure solvents, the photoexcited fluorophore rotates very fast within its fluorescence lifetime, revealing very low (close to zero) values of fluorescence anisotropy. However, increase in the viscosity of the medium or enhanced effective volume of the probe due to some specific interaction within the probe molecules (like formation of aggregates, as in the present case) or between the probe and the solvent might restrict the rotation process leading to an increase in its fluorescence anisotropy.45,46
Steady-state fluorescence anisotropy measurement was exploited in the present work because different effective volumes of the monomer, dimer, and β-CD encapsulated monomer of NR are expected to influence the rotational motion and hence the fluorescence anisotropy values of NR differently. To monitor the anisotropy of the monomer of NR in water, the excitation and monitoring wavelengths were chosen as 580 and 680 nm, respectively. On the other hand, for the dimer, 470 and 620 nm were selected as the corresponding wavelengths for reasons already discussed. The same sets of measurements were also carried out in the presence of 8 mM β-CD. All of the fluorescence anisotropy data are collected in Table 2. The table reveals that the fluorescence anisotropy of NR monitored at 620 nm is much higher than that at 680 nm, indicating that the effective volume of the dimer is appreciably larger than that of the monomer, as expected. The slight enhanced fluorescence anisotropy of the monomer upon addition of β-CD provides evidence of its encapsulation within the cyclodextrin cavity.22,30 On the contrary, the anisotropy value monitored for the dimer form in the presence of β-CD was reduced from its value in water as the equilibrium was shifted toward the monomer. However, the anisotropy value did not go down to the anisotropy value of the monomer in water because the contributions came from the β-CD-encapsulated complex as well as from some amount of dimer of NR present in the system.
Table 2. Fluorescence Anisotropy of NR in Different Environments.
| fluorescence
anisotropy |
|||
|---|---|---|---|
| excitation wavelength (nm) | monitoring wavelength (nm) | NR in water | NR + 8 mM β-CD |
| 580 | 680 | 0.06 | 0.09 |
| 470 | 620 | 0.15 | 0.11 |
2.4. Dynamic Light Scattering Measurements
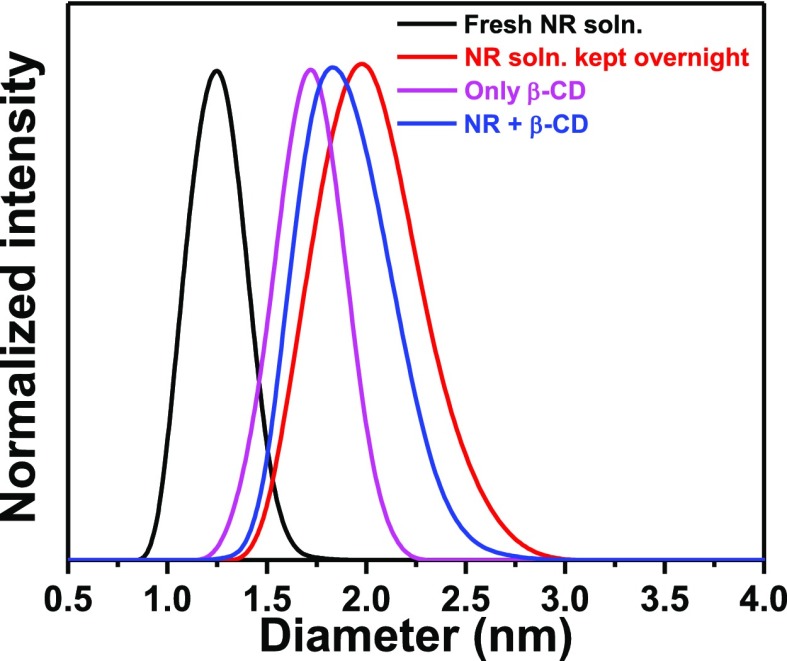
To get further support in favor of the size-related conclusions drawn from the fluorescence anisotropy measurements of the different species of NR, dynamic light scattering (DLS) technique was adopted to get an idea about their dimensions in solution. Figure 11 portrays the size distribution of an aqueous solution of NR in different situations. A sharp size distribution with a peak at ∼1.2 nm was obtained for a freshly prepared aqueous solution of NR containing mainly its monomer. On keeping this solution overnight, the size distribution, as expected, was found to be a broad one with a peak at ∼2 nm. Higher hydrodynamic diameter of the H-dimer formed in the aqueous solution, kept overnight, accounted for this observation, and the broader nature of the size distribution suggested existence of both the monomeric and dimeric species in this solution of NR.
Figure 11.
Size (diameter) distribution of NR in different conditions.
To divulge the effect of β-CD, first, the hydrodynamic diameter of only β-CD was measured and the diameter came out to be ∼1.7 nm which is in good agreement with the literature reports.47 In the presence of NR, the diameter of β-CD was found to be ∼1.8 nm which might be due to the entrapment of the monomer in the cavity of β-CD. Hence, from the DLS study, it can be inferred that the effective dimensions of NR in different environments are in accordance with that assessed from the fluorescence anisotropy measurements.
2.5. Quantum Chemical Calculations
Quantum chemical calculations were exploited to rationalize the experimental findings and to find out the probable geometries or orientations of the NR monomers in forming the H-dimer. The energy minimized geometry of NR monomer in the aqueous medium was obtained at the density functional theory (DFT) level using Becke’s three-parameter hybrid functional B3 with the nonlocal correlation function of Lee–Yang–Parr abbreviated as B3LYP with the basis set 6-311++G**.48−50 The resultant geometry was found to be planar in nature (Figure 12A) with two ethyl groups sticking out of the plane in the opposite directions. This planar geometry of NR goes very much in favor of formation of the H-dimer.
Figure 12.
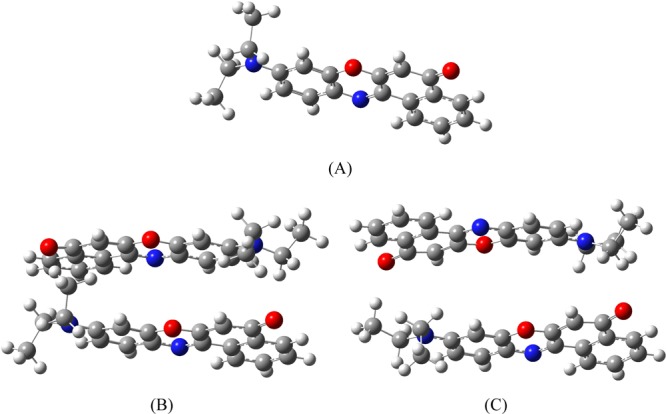
(A) Global energy minimized structures of monomer form, (B) cis dimer, and (C) trans dimer of NR. Atomic notations—gray: carbon, off-white: hydrogen, red: oxygen, and blue: nitrogen.
Different orientations of the NR monomers to form the H-dimer of the dye were optimized at the same level as exploited for the monomer (Figure 12B,C). The cis dimer is defined as the one in which the individual heterocyclic oxygen/nitrogen atoms are located face-to-face. On the contrary, the trans dimer has the heterocyclic oxygen of one monomer facing the nitrogen atom of the other one. It was found that the cis dimer (E = −7.6 kcal mol–1) was energetically more stabilized over the trans (E = −3.1 kcal mol–1) by 4.5 kcal mol–1.
To provide additional support to the formation of the H-dimer of NR, an endeavor was made to justify the experimental absorption spectrum of NR. Making use of our limited facility of the quantum chemical calculations, the simulated absorption spectrum of the NR monomer was obtained with a peak maximum at 564 nm in water which qualitatively agreed with the experimental one. On the other hand, the simulated absorption spectrum of the cis dimer with the peak maximum at 530 nm was found to be hypsochromically shifted compared to that of the monomer peak of 564 nm. This blue-shifted simulated spectrum of cis dimer of NR went in line with the hypsochromically shifted absorption band for the H-dimer found experimentally and thus validated the aggregation of the probe in water.
2.6. Molecular Docking Study
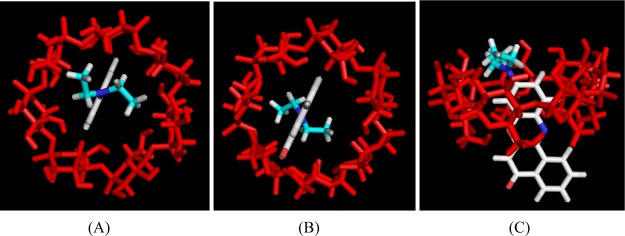
Molecular docking simulation was carried out to perceive the mode/pattern of encapsulation of NR monomer within the cavity of β-CD.51−54 The most stable docked conformer of NR in β-CD was found to have the phenoxazone moiety of the NR monomer entering through the primary/wider rim of the β-CD and protruding out of the secondary/narrower rim. For clarity, different projectional views of the most stable docked conformer of NR have been demonstrated in Figure 13. On docking the dimer to β-CD several times, the most stable docked conformer of the monomer was obtained repeatedly. Thus, it confirmed that the dimer is big enough to enter the cavity of the β-CD and in the presence of β-CD, the NR monomer is really encapsulated within CD resulting in the shift of the equilibrium from the dimer toward the monomer.
Figure 13.
Lowest energy docked structures of NR monomer within the β-CD cavity: (A) top view from the wider opening, (B) bottom view from the narrower opening of β-CD, and (C) side view.
3. Conclusions
In conclusion, the self-association of NR in the aqueous medium has been established emphatically through vivid spectroscopic investigations. Its poor solubility in water and hydrophobic interaction along with the π–π stacking interaction favored by its planar structure are accounted for the formation of the aggregate in the aqueous medium. The hypsochromic shift in the absorption spectrum and drastic decrease in the emission intensity with the passage of time confirm that the self-association of NR is of H-type. Absorption-based kinetic studies establish the H-aggregate to be a dimeric species. The presence of an isosbestic point in the absorption spectra and an isoemissive point in the TRANES reveals the existence of equilibrium between the H-dimer and the monomer of NR in both ground and excited electronic states. The experimental results are rationalized from the quantum chemical calculations and molecular docking studies. Exploiting the host–guest chemistry of NR with β-CD, it is demonstrated that the formation of the dimer of NR is prevented in the presence of β-CD because of the encapsulation of the monomeric form of NR within the hydrophobic cavity of β-CD.
4. Experimental Section
4.1. Materials
NR, β-CD, and spectroscopic grade solvents, that is, methanol and n-heptane were procured from Sigma-Aldrich (USA) and used without further purification. Deionized water from a Milli-Q water purification system (Millipore) was used for making all of the aqueous solutions.
4.2. Methods
To overcome the solubility problem of NR in water, a concentrated stock solution of the dye was prepared in methanol. Different steady-state and time-resolved experiments were performed using a very small amount of the methanol stock solution of the dye in water. By using different amounts of the stock solution of NR in methanol, the concentration variation studies were performed in the aqueous medium. The volumes of methanol in the final experimental solutions were kept below 2%. All of the experiments were performed in air equilibrated solutions at room temperature (300 K).
Absorption studies were carried out on a Shimadzu UV-2450 absorption spectrophotometer (Shimadzu Corporation, Japan). Single-shot absorption spectra at different time intervals were acquired with a PerkinElmer UV/visible spectrophotometer (model no. 8453). A HORIBA Jobin Yvon Fluoromax-4 spectrofluorometer was employed for steady-state fluorescence and fluorescence anisotropy measurements. Fluorescence anisotropy (r) is defined as45
where IVV and IVH are the emission intensities obtained with the excitation and emission polarizers set at (0°, 0°) and (0°, 90°), respectively. The G factor is given by45
where IHV and IHH correspond to the emission signals for excitation and emission polarizers set at (90°, 0°) and (90°, 90°), respectively.
A FluoroCube instrument (Horiba Jobin Yvon), with a laser diode (IBH, UK) working at 560 nm and a TBX photon detector, was used for the time-resolved fluorescence decay measurements, adopting the time-correlated single-photon counting technique.45 The technical details regarding fluorescence lifetime measurements have already been described in some of our earlier works.22,30 Time-resolved emission spectral (TRES) measurements of NR in water was performed on the same Horiba Jobin Yvon FluoroCube instrument over the entire emission spectral range (580–750 nm) with an interval of 2 nm. At each preset wavelength, the emission was collected for a period of 180 s. The emission spectra were sliced for a distinct time window at different decay times. Time-resolved area normalized emission spectra were constructed by normalizing the areas under the individual emission spectra obtained from the TRES measurements using the Origin 7.5 software.41−43 Smoothing on the raw data of TRANES was performed by exploiting the Origin software to increase the clarity of the set of spectra, without distorting the science in it.
DLS measurements were performed using a Nano-ZS90 Malvern instrument (model DLS-nano ZS, Zetasizer, Nano series) equipped with a 4 mW He–Ne laser (λ = 632.8 nm) and a thermostatic sample chamber. The hydrodynamic sizes of the samples were measured using DTS software associated with the instrument. Prior to the measurements, samples were filtered through a 0.10 μm syringe filter (Merck Millipore Ltd.) to remove any dust particle.
Quantum chemical calculations were performed using Gaussian 09 software48 for obtaining the energy minimized structure of NR. The ground state calculations were carried out using DFT with Becke’s three-parameter hybrid functional B3 with nonlocal correlation function of Lee–Yang–Parr abbreviated as B3LYP49,50 with the basis set 6-311++G**. To assess the effect of solvent on the ground state, the conductor polarizable continuum model55,56 was employed.
AutoDock-vina program (version 1.1.2) from The Scripps Research Institute57−59 was exploited for the molecular docking simulations. For the docking study, the geometries of the monomer and the dimer of NR were first optimized using the Gaussian 09 program48 and the output files were converted into compatible Protein Data Bank (PDB) files. The required crystal structure of β-CD was obtained from PDB. Prior to the docking study, MGL Tools (version 1.5.6) were used to convert the receptor and ligand coordinate files into PDBQT format. A three-dimensional grid box of dimension 40 × 40 × 40 was constructed with a grid spacing of 0.375 Å. The grid box was created in such a fashion that it would be large enough to include not only the respective CD cavities but also the whole CD structures. For docking simulation, 20 different conformations were taken into account to find out the lowest energy docked conformer. The PyMOL software package was used for visualization of the docked poses and analyzing the corresponding conformations.60
Acknowledgments
Financial support from the Department of Science and Technology (project no. EMR/2016/001087), Govt. of India, is gratefully acknowledged. A.R. and S.D. thank C.S.I.R. and U.G.C., respectively, for their research fellowships. The authors are also thankful to Prof. Ambikesh Mahapatra and Prof. Subhash Chandra Bhattacharya of the same department for single-shot absorption and DLS measurements, respectively.
The authors declare no competing financial interest.
References
- Tani T.Photographic Sensitivity; Theory and Mechanisms; Oxford University Press: New York, 1995. [Google Scholar]
- Zhang Z.; Fan J.; Cheney P. P.; Berezin M. Y.; Edwards W. B.; Akers W. J.; Shen D.; Liang K.; Culver J. P.; Achilefu S. Activatable molecular systems using homologous near-infrared fluorescent probes for monitoring enzyme activities in vitro, in cellulo, and in vivo. Mol. Pharmaceutics 2009, 6, 416–427. 10.1021/mp800264k. [DOI] [PMC free article] [PubMed] [Google Scholar]
- Sengupta S.; Würthner F. Chlorophyll J-aggregates: From bioinspired dye stacks to nanotubes, liquid crystals, and biosupramolecular electronics. Acc. Chem. Res. 2013, 46, 2498–2512. 10.1021/ar400017u. [DOI] [PubMed] [Google Scholar]
- Lim J.; Paleček D.; Caycedo-Soler F.; Lincoln C. N.; Prior J.; von Berlepsch H.; Huelga S. F.; Plenio M. B.; Zigmantas D.; Hauer J. Vibronic origin of long-lived coherence in an artificial molecular light harvester. Nat. Commun. 2015, 6, 7755. 10.1038/ncomms8755. [DOI] [PMC free article] [PubMed] [Google Scholar]
- Deisenhofer J.; Epp O.; Miki K.; Huber R.; Michel H. Structure of the protein subunits in the photosynthetic reaction centre of rhodopseudomonas viridis at 3Å resolution. J. Mol. Biol. 1985, 318, 618–624. 10.1038/318618a0. [DOI] [PubMed] [Google Scholar]
- Mishra A.; Behera R. K.; Behera P. K.; Mishra B. K.; Behera G. B. Cyanines during the 1990s: A review. Chem. Rev. 2000, 100, 1973–2012. 10.1021/cr990402t. [DOI] [PubMed] [Google Scholar]
- Jelley E. E. Spectral absorption and fluorescence of dyes in the molecular state. Nature 1936, 138, 1009–1010. 10.1038/1381009a0. [DOI] [Google Scholar]
- Kasha M. Energy transfer mechanisms and the molecular exciton model for molecular aggregates. Radiat. Res. 1963, 20, 55–70. 10.2307/3571331. [DOI] [PubMed] [Google Scholar]
- Rohatgi K. K.; Mukhopadhyay A. K. Thermodynamics of dye dimerization. Chem. Phys. Lett. 1971, 12, 259–260. 10.1016/0009-2614(71)85059-5. [DOI] [Google Scholar]
- Rohatgi K. K.; Mukhopadhyay A. K. Hypochromism and exciton interaction in halofluorescein dyes. J. Phys. Chem. 1972, 76, 3970–3973. 10.1021/j100670a014. [DOI] [Google Scholar]
- Greenspan P.; Mayer E. P.; Fowler S. D. Nile red: A selective fluorescent stain for intracellular lipid droplets. J. Cell Biol. 1985, 100, 965–973. 10.1083/jcb.100.3.965. [DOI] [PMC free article] [PubMed] [Google Scholar]
- Greenspan P.; Fowler S. D. Spectrofluorometric studies of the lipid probe, nile red. J. Lipid Res. 1985, 26, 781–789. [PubMed] [Google Scholar]
- Reichardt C. Solvatochromic Dyes as solvent polarity indicators. Chem. Rev. 1994, 94, 2319–2358. 10.1021/cr00032a005. [DOI] [Google Scholar]
- Yablon D. G.; Schilowitz A. M. Solvatochromism of nile red in nonpolar solvents. Appl. Spectrosc. 2004, 58, 843–847. 10.1366/0003702041389328. [DOI] [PubMed] [Google Scholar]
- Tainaka K.; Fujiwara Y.; Okamoto A. Nile red nucleoside: Novel nucleoside analog with a fluorophore replacing the DNA base. Nucleic Acids Symp. Ser. 2005, 49, 155–156. 10.1093/nass/49.1.155. [DOI] [PubMed] [Google Scholar]
- Deye J. F.; Berger T. A.; Anderson A. G. Nile red as a solvatochromic dye for measuring solvent strength in normal liquids and mixtures of normal liquids with supercritical and near critical fluids. Anal. Chem. 1990, 62, 615–622. 10.1021/ac00205a015. [DOI] [Google Scholar]
- Sackett D. L.; Wolff J. Nile red as a polarity-sensitive fluorescent probe of hydrophobic protein surfaces. Anal. Biochem. 1987, 167, 228–234. 10.1016/0003-2697(87)90157-6. [DOI] [PubMed] [Google Scholar]
- Dutta A. K.; Kamada K.; Ohta K. Spectroscopic studies of nile red in organic solvents and polymers. J. Photochem. Photobiol., A 1996, 93, 57–64. 10.1016/1010-6030(95)04140-0. [DOI] [Google Scholar]
- Maiti N. C.; Krishna M. M. G.; Britto P. J.; Periasamy N. Fluorescence dynamics of dye probes in micelles. J. Phys. Chem. B 1997, 101, 11051–11060. 10.1021/jp9723123. [DOI] [Google Scholar]
- Datta A.; Mandal D.; Pal S. K.; Bhattacharyya K. Intramolecular charge transfer processes in confined systems. Nile red in reverse micelles. J. Phys. Chem. B 1997, 101, 10221–10225. 10.1021/jp971576m. [DOI] [Google Scholar]
- Mukherjee S.; Raghuraman H.; Chattopadhyay A. Membrane localization and dynamics of Nile red: Effect of cholesterol. Biochim. Biophys. Acta 2007, 1768, 59–66. 10.1016/j.bbamem.2006.07.010. [DOI] [PubMed] [Google Scholar]
- Jana B.; Ghosh S.; Chattopadhyay N. Competitive binding of nile red between lipids and β-cyclodextrin. J. Photochem. Photobiol., B 2013, 126, 1–10. 10.1016/j.jphotobiol.2013.06.005. [DOI] [PubMed] [Google Scholar]
- Srivatsavoy V. J. P. Enhancement of excited state nonradiative deactivation of nile red in γ-cyclodextrin: Evidence for multiple inclusion complexes. J. Lumin. 1999, 82, 17–23. 10.1016/s0022-2313(99)00029-0. [DOI] [Google Scholar]
- Hazra P.; Chakrabarty D.; Chakraborty A.; Sarkar N. Intramolecular charge transfer and solvation dynamics of nile red in the nanocavity of cyclodextrins. Chem. Phys. Lett. 2004, 388, 150–157. 10.1016/j.cplett.2004.02.078. [DOI] [Google Scholar]
- Wagner B. D.; Stojanovic N.; Leclair G.; Jankowski C. K. A spectroscopic and molecular modelling study of the nature of the association complexes of nile red with cyclodextrins. J. Inclusion Phenom. Macrocyclic Chem. 2003, 45, 275–283. 10.1023/a:1024578819782. [DOI] [Google Scholar]
- Sarkar N.; Das K.; Nath D. N.; Bhattacharyya K. Twisted charge transfer processes of nile red in homogeneous solutions and in faujasite zeolite. Langmuir 1994, 10, 326–329. 10.1021/la00013a048. [DOI] [Google Scholar]
- Snipstad S.; Westrøm S.; Mørch Y.; Afadzi M.; Åslund K. A.; de Lange Davies L. Contact-mediated intracellular delivery of hydrophobic drugs from polymeric nanoparticles. Cancer Nanotechnol. 2014, 5, 1–18. 10.1186/s12645-014-0008-4. [DOI] [PMC free article] [PubMed] [Google Scholar]
- Prasad S.; Achazi K.; Böttcher C.; Haag R.; Sharma S. K. Fabrication of nanostructures through self-assembly of non-ionic amphiphiles for biomedical applications. RSC Adv. 2017, 7, 22121–22132. 10.1039/c6ra28654b. [DOI] [Google Scholar]
- Ghosh S.; Chattoraj S.; Chattopadhyay N. Interaction of β-cyclodextrin with nile red in a single live CHO cell: An initiative towards developing a prospective strategy for the excretion of adsorbed drugs from the cell membrane. Analyst 2014, 139, 5664–5668. 10.1039/c4an01114g. [DOI] [PubMed] [Google Scholar]
- Kundu P.; Ghosh S.; Jana B.; Chattopadhyay N. Binding interaction of differently charged fluorescent probes with egg yolk phosphatidylcholine and the effect of β- cyclodextrin on the lipid-probe complexes: A fluorometric investigation. Spectrochim. Acta, Part A 2015, 142, 15–24. 10.1016/j.saa.2015.01.038. [DOI] [PubMed] [Google Scholar]
- Kurniasih I. N.; Liang H.; Mohr P. C.; Khot G.; Rabe J. P.; Mohr A. Nile red dye in aqueous surfactant and micellar solution. Langmuir 2015, 31, 2639–2648. 10.1021/la504378m. [DOI] [PubMed] [Google Scholar]
- Selwyn J. E.; Steinfeld J. I. Aggregation of equilibriums of xanthene dyes. J. Phys. Chem. 1972, 76, 762–774. 10.1021/j100649a026. [DOI] [Google Scholar]
- Drexhage K. H. In Dye Lasers; Schrafer E. P., Ed.; Springer: New York, 1977. [Google Scholar]
- Valdes-Aguilera O.; Neckers D. C. Aggregation phenomena in xanthene dyes. Acc. Chem. Res. 1989, 22, 171–177. 10.1021/ar00161a002. [DOI] [Google Scholar]
- Fery-Forgues S.; El-Ayoubi R.; Lamère J.-F. Fluorescent microcrystals obtained from coumarin 6 using the reprecipitation method. J. Fluoresc. 2008, 18, 619–624. 10.1007/s10895-008-0341-2. [DOI] [PubMed] [Google Scholar]
- Miao X.; Li Y.; Wang X.; Lee S. M.-Y.; Zheng Y. Transport mechanism of coumarin 6 nanocrystals with two particle sizes in MDCKII monolayer and larval zebrafish. ACS Appl. Mater. Interfaces 2016, 8, 12620–12630. 10.1021/acsami.6b01680. [DOI] [PubMed] [Google Scholar]
- Ghosh P.; Das T.; Maity A.; Mondal S.; Purkayastha P. Incorporation of coumarin 6 in cyclodextrins: Microcrystals to lamellar composites. RSC Adv. 2015, 5, 4214–4218. 10.1039/c4ra13706j. [DOI] [Google Scholar]
- Verma P.; Pal H. Aggregation studies of dipolar coumarin-153 dye in polar solvents: A photophysical study. J. Phys. Chem. A 2014, 118, 6950–6964. 10.1021/jp506138w. [DOI] [PubMed] [Google Scholar]
- Verma P.; Pal H. Unusual H-type aggregation of coumarin-481 dye in polar organic solvents. J. Phys. Chem. A 2013, 117, 12409–12418. 10.1021/jp409405a. [DOI] [PubMed] [Google Scholar]
- Sarkar D.; Das P.; Girigoswami A.; Chattopadhyay N. Spectroscopic characterization of phenazinium dye aggregates in water and acetonitrile media: Effect of methyl substitution on the aggregation phenomenon. J. Phys. Chem. A 2008, 112, 9684–9691. 10.1021/jp804593v. [DOI] [PubMed] [Google Scholar]
- Koti A. S. R.; Periasamy N. Application of time resolved area normalized emission spectroscopy to multicomponent systems. J. Chem. Phys. 2001, 115, 7094–7099. 10.1063/1.1405017. [DOI] [Google Scholar]
- Koti A. S. R.; Krishna M. M. G.; Periasamy N. Time-resolved area-normalized emission spectroscopy (TRANES): A novel method for confirming emission from two excited states. J. Phys. Chem. A 2001, 105, 1767–1771. 10.1021/jp004361c. [DOI] [Google Scholar]
- Periasamy N.; Koti A. S. R. Time resolved fluorescence spectroscopy: TRES and TRANES. Proc. Indian Natl. Sci. Acad., Part A 2003, 69, 41–48. [Google Scholar]
- Atkins P.; De Paula J.. Elements of Physical Chemistry, 5th ed.; Oxford University Press: New York, 2009. [Google Scholar]
- Lakowicz J. R.Principles of Fluorescence Spectroscopy, 3rd ed.; Springer: New York, 2006. [Google Scholar]
- Das S.; Ghosh S.; Chattopadhyay N. Unprecedented high fluorescence anisotropy in protic solvents: Hydrogen bond induced solvent caging?. Chem. Phys. Lett. 2016, 644, 284–287. 10.1016/j.cplett.2015.12.015. [DOI] [Google Scholar]
- Wu A.; Shen X.; He Y. Investigation on γ-cyclodextrin nanotube induced by N,N’-diphenylbenzidine molecule. J. Colloid Interface Sci. 2006, 297, 525–533. 10.1016/j.jcis.2005.11.014. [DOI] [PubMed] [Google Scholar]
- Frisch M. J.; Trucks G. W.; Schlegel H. B.; Scuseria G. E.; Robb M. A.; Cheeseman J. R.; Scalmani G.; Barone V.; Mennucci B.; Petersson G. A.; et al. Gaussian 09, revision A.02; Gaussian, Inc.: Wallingford, CT, 2009.
- Becke A. D. Density-functional thermochemistry. III. The role of exact exchange. J. Chem. Phys. 1993, 98, 5648–5652. 10.1063/1.464913. [DOI] [Google Scholar]
- Lee C.; Yang W.; Parr R. G. Development of the Colic-Salvetti correlation-energy formula into a functional of the electron density. Phys. Rev. B: Condens. Matter Mater. Phys. 1988, 37, 785–789. 10.1103/physrevb.37.785. [DOI] [PubMed] [Google Scholar]
- Mati S. S.; Roy S. S.; Chall S.; Bhattacharya S.; Bhattacharya S. C. Unveiling the groove binding mechanism of a biocompatible naphthalimide-based organoselenocyanate with calf thymus DNA: An “ex vivo” fluorescence imaging application appended by biophysical experiments and molecular docking simulations. J. Phys. Chem. B 2013, 117, 14655–14665. 10.1021/jp4090553. [DOI] [PubMed] [Google Scholar]
- Ghosh S.; Kundu P.; Paul B. K.; Chattopadhyay N. Binding of an anionic fluorescent probe with calf thymus DNA and effect of salt on the probe–DNA binding: A spectroscopic and molecular docking investigation. RSC Adv. 2014, 4, 63549–63558. 10.1039/c4ra14298e. [DOI] [Google Scholar]
- Kundu P.; Ghosh S.; Chattopadhyay N. Exploration of the binding interaction of a potential nervous system stimulant with calf-thymus DNA and dissociation of the drug-DNA complex by detergent sequestration. Phys. Chem. Chem. Phys. 2015, 17, 17699–17709. 10.1039/c5cp02101d. [DOI] [PubMed] [Google Scholar]
- Das S.; Chattopadhyay N. Supramolecular inclusion-assisted disruption of probe-solvent network. ChemistrySelect 2017, 2, 6078–6081. 10.1002/slct.201701401. [DOI] [Google Scholar]
- Cossi M.; Rega N.; Scalmani G.; Barone V. Energies, structures, and electronic properties of molecules in solution with the C-PCM solvation model. J. Comput. Chem. 2003, 24, 669–681. 10.1002/jcc.10189. [DOI] [PubMed] [Google Scholar]
- Takano Y.; Houk K. N. Benchmarking the conductor-like polarizable continuum model (CPCM) for aqueous solvation free energies of neutral and ionic organic molecules. J. Chem. Theory Comput. 2005, 1, 70–77. 10.1021/ct049977a. [DOI] [PubMed] [Google Scholar]
- Trott O.; Olson A. J. Autodock vina: Improving the speed and accuracy of docking with a new scoring function, efficient optimization and multithreading. J. Comput. Chem. 2010, 31, 455–461. 10.1002/jcc.21334. [DOI] [PMC free article] [PubMed] [Google Scholar]
- Seeliger D.; de Groot B. L. Ligand docking and binding site analysis with PyMOL and autodock/vina. J. Comput.-Aided Mol. Des. 2010, 24, 417–422. 10.1007/s10822-010-9352-6. [DOI] [PMC free article] [PubMed] [Google Scholar]
- Chang M. W.; Ayeni C.; Breuer S.; Torbett B. E. Virtual screening for HIV protease inhibitors: A comparison of autodock 4 and vina. PLoS One 2010, 5, e11955 10.1371/journal.pone.0011955. [DOI] [PMC free article] [PubMed] [Google Scholar]
- De Lano W. L.The PyMOL Molecular Graphics System; De Lano Scientific: San Carlos, CA, 2004. [Google Scholar]


