

Abstract
Background:
Despite many therapeutic advances, the prognosis of patients with chronic heart failure (CHF) remains poor. Therefore, reliable identification of high‐risk patients with poor prognosis is of utmost importance. Cardiopulmonary exercise testing (CPET) provides important prognostic information by peak O2 uptake (peak VO2), maximal oxygen pulse (O2 Pmax), O2 uptake efficiency slope (OUES), and VE/VCO2 slope (VE/VCO2). A different approach for prognostic assessment is the Seattle Heart Failure Model (SHFM), which is based on clinical data and calculates the estimated annual mortality.
Hypothesis:
Comparison of the prognostic value of the Seattle Heart Failure Score and cardiopulmonary excercis testing in patients with chronic heart failure.
Methods:
One hundred fifty‐seven patients with ischemic heart failure and recent intracoronary progenitor cell application were analyzed for mortality during a follow‐up of 4 years. CPET (peak VO2, O2 Pmax, OUES, VE/VCO2) was performed in all patients at baseline. The SHFM score was calculated for every patient, with data obtained at the time of CPET.
Results:
During follow‐up, 24 patients died (15.2%). Nonsurvivors had significantly worse initial CPET results and a higher SHFM score compared to survivors. Receiver operating characteristics curve analysis of sensitivity and specificity revealed the largest area under the curve value for the SHFM score, followed by VE/VCO2 slope. Kaplan Meier analysis using cutoff points of SHFM and VE/VCO2 slope with highest sensitivity and specificity resulted in significant discrimination of survivors and nonsurvivors. By multivariate analysis, only the SHFM score persisted as independent predictor of mortality in these patients.
Conclusions:
These data indicate superior prognostic power of the SHFM score compared to CPET in patients with chronic ischemic heart failure.
The authors have no funding, financial relationships, or conflicts of interest to disclose.
Introduction
Heart failure is associated with high mortality rates, prolonged and repeated hospitalizations, and enormous implications for healthcare systems. Despite novel therapeutic options like revascularization, device therapy, and pharmacotherapy, the prevalence and incidence of chronic heart failure continued to increase over the last decades.1
The identification of high‐risk patients requires objective assessment of mortality risk. Cardiopulmonary exercise testing (CPET) is an established tool for selection of candidates for heart transplantation as well as for identification and monitoring of high‐risk patients.2 Evaluation of peak exercise capacity has important prognostic implications.3 However, as many chronic heart failure (CHF) patients are not able to perform maximal exercise, parameters obtained during submaximal exercise such as the ratio of ventilation and CO2 elimination (VE/VCO2 slope)4 or oxygen uptake efficiency slope (OUES)5, 6 have been investigated and were shown to improve the accuracy of CPET in evaluating CHF patients. However, several studies yielded conflicting results with respect to the prognostic power of submaximal and maximal exercise parameters.7, 8, 9
Another method for assessment of prognosis in heart failure are scoring systems. The most recent is the Seattle Heart failure Model (SHFM). It is based on data from 6 large cohorts of CHF patients.10 It comprises demographic data and laboratory values as well as data on device therapy and medication. So far, the SHFM has been investigated in patients with severe end‐stage heart failure11, 12 as well as in ambulatory patients,13 where it demonstrated providing adequate risk stratification. It may also be applied for virtual control groups in the implementation of mechanical cardiac support systems.14
The aim of the present study was to compare the diagnostic value of CPET parameters and the SHFM score for prognostication of all‐cause mortality in an ambulatory patient cohort suffering from chronic ischemic heart disease under optimized treatment, including intracoronary progenitor cell application.
Methods
Patient Population
Between September 2002 and November 2008, 157 patients with chronic ischemic heart disease who received intracoronary progenitor cell application presented in our specialized heart failure outpatient clinic for CPET testing. Patients were derived from 2 study cohorts with the same inclusion criteria.15, 16 The ethics committee of the J.W. Goethe University reviewed and approved the study protocols.
The patients had to be clinically stable for at least 4 weeks and under optimal evidence‐based medical therapy prior to prognostic evaluation.
Cardiopulmonary Exercise Testing
At the time of presentation, all patients underwent symptom‐limited cardiopulmonary exercise testing on either a treadmill ergometer using a modified Bruce protocol (n = 111) or on a bicycle ergometer using a modified Naughton protocol (n = 46). Due to technical and logistic conditions, the first 46 patients underwent CPET on a bicycle ergometer, whereas the following 111 patients were examined on a treadmill. The peak oxygen consumption was determined as highest oxygen consumption during exercise and normalized to patients' body weight. Oxygen uptake efficiency slope and VE/VCO2 slope were calculated as previously described.5, 7 In 20 patients, the OUES could not be exactly calculated due to technical limitations.
Calculation of the SHFM Score
The SHFM score was calculated retrospectively from the following data obtained at baseline presentation: age, gender, etiology of cardiomyopathy, heart rate, systolic blood pressure, left ventricular ejection fraction (LVEF), medication (angiotensin‐converting enzyme inhibitor [ACEI], angiotensin receptor blocker [ARB], aldosterone blocker, β‐blocker, statins, diuretic type and daily dose, allopurinol), and laboratory values (serum sodium, total cholesterol, hemoglobin, percent lymphocytes, uric acid). LVEF derived from recent quantitative core lab analysis of left ventricular angiography or echocardiography was available in all patients. In addition, the presence of any implantable device (pacemaker, implantable cardioverter defibrillator [ICD], cardiac resynchronization therapy) was included into the calculation. N‐terminal pro‐brain natriuretic peptide (NT‐proBNP) values are not included in the model. Calculation of the score was performed using the original formula provided by Levy et al.10
Patient Follow‐up
Regular follow‐up of patients was performed by annual telephone contact if no formal outpatient visit was scheduled. The primary end point of all‐cause mortality was confirmed by contacting relatives, family physicians, and review of the certificates of death.
Statistical Analysis
Continuous variables are presented as mean ± standard deviation, categorical variables as frequencies, if not stated otherwise. Statistical comparisons between groups were performed in a nonparametric unpaired fashion using the Mann‐Whitney U test for continuous variables and χ 2 test for categorical variables.
Receiver operating characteristics (ROC) curve analysis was performed for all‐cause mortality during the entire follow‐up period. Survival was analyzed using Kaplan‐Meier survival curves and statistical significance via log‐rank test. Cutoff points for Kaplan‐Meier analysis were defined as values in the upper left corner of the ROC curve with highest sensitivity and specificity. Comparisons between survival curves were performed using log‐rank test. Multivariate analysis was performed using stepwise forward Cox regression analysis including variables, with significant differences between groups in univariate analysis. Statistical significance was assumed if P was <0.05. Statistical analysis was performed using SPSS version 17.0 (IBM SPSS, Armonk, NY).
Results
Baseline Characteristics
The clinical patient characteristics are summarized in Table 1. All patients suffered from chronic ischemic heart failure. The mean time interval from the last myocardial infarction was 79 ± 88 months. The majority of patients (43%) had a documented coronary 3‐vessel disease. At the time of presentation, all patients were clinically stable for at least 4 weeks, and no patient was classified as New York Heart Association (NYHA) IV.
Table 1.
Baseline Patient Characteristics
| Variable | All (n = 157) | Survivors (n = 133) | Nonsurvivors (n = 24) | P Value |
|---|---|---|---|---|
| Age, y | 60 ± 12 | 59 ± 12 | 65 ± 8 | 0.047 |
| Gender, % male | 86.6 | 84.2 | 100 | 0.023 |
| Body mass index, kg/m2 | 23.7 ± 3.9 | 24.0 ± 4.0 | 22.5 ± 3.7 | 0.053 |
| NYHA functional class | 2.2 ± 0.7 | 2.1 ± 0.7 | 2.6 ± 0.7 | 0.002 |
| Left ventricular ejection fraction, % | 39 ± 11 | 41 ± 10 | 30 ± 10 | <0.001 |
| Seattle Heart Failure Model score | 0.212 ± 0.745 | 0.078 ± 0.649 | 0.951 ± 0.818 | <0.001 |
| Systolic blood pressure, mm Hg | 113 ± 24 | 119 ± 25 | 102 ± 12 | 0.001 |
| Heart rate, beats/min | 68 ± 11 | 67 ± 11 | 71 ± 10 | 0.057 |
| Creatinine, mg/dL | 1.1 ± 0.3 | 1.1 ± 0.3 | 1.2 ± 0.3 | 0.027 |
| Blood urea nitrogen, mg/dL | 45.2 ± 17.9 | 43.1 ± 15.1 | 56.8 ± 26.4 | 0.025 |
| Sodium, mEq/dL | 139.2 ± 3.3 | 139.5 ± 3.2 | 137.3 ± 3.0 | 0.001 |
| Hemoglobin, g/dL | 14.3 ± 1.5 | 14.4 ± 1.4 | 13.9 ± 2.1 | 0.64 |
| White blood cells, 103/mm3 | 8.1 ± 2.7 | 8.0 ± 2.7 | 8.6 ± 3.0 | 0.23 |
| Uric acid, mg/dL | 7.1 ± 2.0 (n = 156) | 6.9 ± 1.7 (n = 132) | 8.0 ± 2.8 (n = 24) | 0.077 |
| Cholesterol, mg/dL | 170.7 ± 43.9 | 173.9 ± 44.6 | 152.5 ± 35.2 | 0.017 |
| NT‐proBNP, pg/mL | 1108.3 ± 1447.3 | 884.9 ± 1124.2 | 2337.2 ± 2248.4 | <0.001 |
| Medical history, % | ||||
| Hypertension | 68.8 | 66.9 | 79.2 | 0.17 |
| Hypercholesterolemia | 79.0 (n = 156) | 80.5 (n = 132) | 70.8 (n = 24) | 0.47 |
| Family history of CAD | 54.1 | 54.1 | 54.2 | 0.59 |
| Diabetes mellitus | 27.4 | 22.6 | 54.2 | 0.002 |
| Current smoker | 16.6 | 17.3 | 12.5 | 0.72 |
| Atrial fibrillation | 6.4 | 4.5 | 16.7 | 0.047 |
| Pacemaker | 10.8 | 10.5 | 12.5 | 0.5 |
| ICD | 21.7 | 18.0 | 41.7 | 0.013 |
| Cardiopulmonary exercise results | ||||
| Peak VO2, mL/min/kg body weight | 18.0 ± 4.8 | 18.6 ± 4.9 | 14.8 ± 3.1 | <0.001 |
| O2 uptake efficiency slope | 1717.7 ± 773.6 (n = 137) | 1784.5 ± 759.4 (n = 120) | 1246.4 ± 727.2 (n = 17) | <0.001 |
| VE/VCO2 slope | 35.1 ± 11.3 | 33.6 ± 9.7 | 43.9 ± 15.0 | <0.001 |
| Maximal O2 pulse, mL/beat | 14.5 ± 5.1 | 15.1 ± 5.0 | 11.2 ± 3.7 | <0.001 |
| Maximal workload, W | 105 ± 51 | 112 ± 51 | 66 ± 33 | <0.001 |
| Exercise time, s | 432 ± 281 | 467 ± 283 | 239 ± 175 | <0.001 |
| Medication, % | ||||
| Antiplatelet therapy | 77.1 | 77.4 | 75.0 | 0.8 |
| Oral anticoagulants | 18.5 | 18.0 | 20.8 | 0.47 |
| β‐Blockers | 87.3 | 85.7 | 95.8 | 0.15 |
| ACE inhibitors or ARB | 89.8 | 91.0 | 83.3 | 0.487 |
| Aldosterone antagonists | 33.1 | 24.8 | 8.3 | 0.018 |
| Statins | 87.9 | 88.7 | 83.3 | 0.33 |
| Any diuretics | 74.5 | 71.4 | 91.7 | 0.026 |
| Allopurinol | 14.6 | 11.3 | 33.3 | 0.01 |
| Digitalis | 22.9 | 21.8 | 29.2 | 0.29 |
Abbreviations: ACE, angiotensin‐converting enzyme; ARB, angiotensin receptor blocker; CAD, coronary artery disease; ICD, implantable cardioverter defibrillator; NYHA, New York Heart Association; NT‐proBNP, N‐terminal pro‐brain natriuretic peptide; Peak VO2, peak oxygen uptake; VE/VCO2, ventilation and carbon dioxide elimination.
P value refers to comparison of survivors and nonsurvivors.
No patient was lost to follow‐up (range, 190 to 2063 days). A total of 24 patients died during the observation period. In 11 patients, death could be classified as CHF related, whereas 1 patient died of sudden cardiac death. In 10 patients, the cause of death was clearly not cardiac related, and in 2 patients the cause of death remained unclear.
Twenty‐seven percent of the cohort were diabetic patients. The number of diabetics in the group of nonsurvivors was significantly higher (54.2%). Only 22.6% of the diabetic patients were alive at the end of follow‐up. The number of patients equipped with an ICD was also significantly higher in the group of nonsurviving compared to surviving patients (41.7% vs 18%), as well as the rate of patients with atrial fibrillation (16.7% vs 4.5%). Nonsurvivors also showed worse hemodynamic baseline parameters, worse laboratory results, and higher NT‐proBNP serum levels. Likewise, medical treatment included less frequent use of aldosterone antagonists in nonsurvivors and more intensive diuretic therapy. However, β‐blocker, ACEI, and/or ARB use were equally distributed between survivors and nonsurvivors.
All patients performed a complete CPET at baseline. As expected, patients who underwent treadmill testing had higher peak O2 uptake (peak VO2) values than patients undergoing bicycle testing (19.0 ± 4.8 vs 15.6 ± 3.9 mL/min/kg, P < 0.001). Submaximal exercise parameters did not significantly differ between the exercise protocols. Likewise, baseline characteristics did not differ significantly, and the number of nonsurvivors was identical (treadmill protocol: 7 deaths [15%], bicycle protocol: 17 deaths [15%]). Therefore, patients with different exercise protocols were pooled for all analyses. As demonstrated in Table 1, the SHFM score and the CPET results differed significantly between survivors and nonsurvivors.
ROC Curve Analysis
The discriminatory power of CPET parameters and the SHFM score for all‐cause mortality was compared by ROC analysis. Figure 1 demonstrates that both CPET with peak VO2 (area under the curve [AUC], 0.707; sensitivity, 0.706; specificity, 0.75), OUES (AUC, 0.732; sensitivity, 0.765; specificity, 0.617), and VE/VCO2 slope (AUC, 0.75; sensitivity, 0.792; specificity, 0.549) as well as the SHFM score (AUC, 0.805; sensitivity, 0.917; specificity, 0.579) demonstrate at least moderate power to predict mortality in these patients. The highest value was demonstrated for the SHFM score and is reflected by the left outer curve in Figure 1, followed by the VE/VCO2 slope and OUES, which were all superior to peak VO2.
Figure 1.
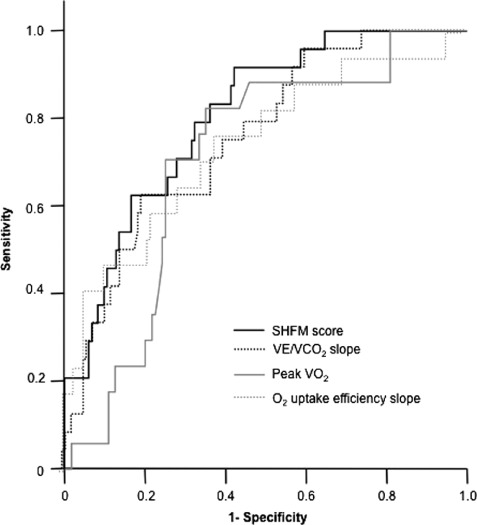
Receiver operating characteristics (ROC) curve analysis. ROC analysis of sensitivity (y‐axis) and specificity (depicted reciprocally on x‐axis) of the Seattle Heart Failure Model (SHFM) score and the cardiopulmonary exercise testing parameters slope of minute ventilation and carbon dioxide elimination (VE/VCO2), peak oxygen uptake (peak VO2), and oxygen uptake efficiency slope for all‐cause mortality.
Based on ROC analysis, cutoff values with the highest sensitivity and specificity were determined. As demonstrated by Kaplan‐Meier analysis, all parameters were able to discriminate significantly between survivors and nonsurvivors (Figure 2).
Figure 2.
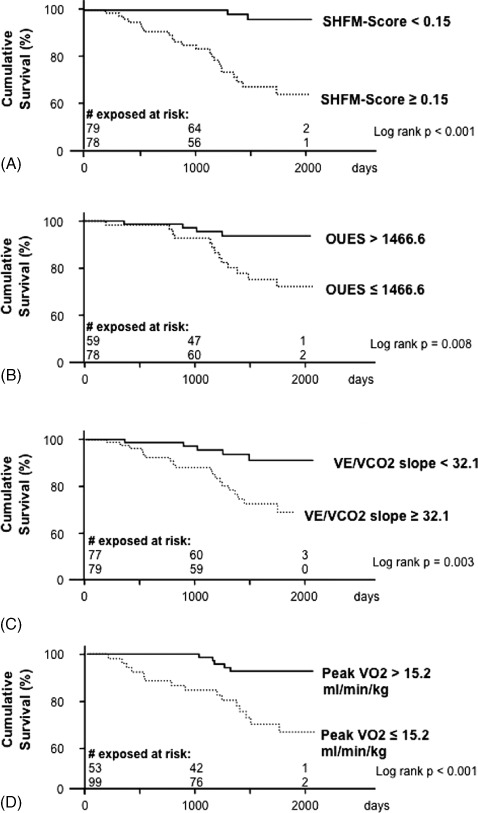
Kaplan‐Meier analysis. Survival curves for the Seattle Heart Failure Model (SHFM) score (A), oxygen uptake efficiency slope (OUES) (B), ventilation and carbon dioxide elimination (VE/VCO2) slope (C), and oxygen uptake (VO2) (D) are shown with the individual cutoff points derived from the receiver operating characteristics curve analysis (values with highest sensitivity and specificity).
Of note, during the first 3 years of observation, not a single patient from the group with an SHFM score <0.15 died, whereas in the subgroup of patients with an SHFM score ≥0.15, several deaths within this period were observed (Figure 2A). Likewise, the calculated cutoff values of peak VO2, OUES, and VE/VCO2 slope also demonstrated significantly different survival curves (Figure 2B–D).
Prognostic Power Assessment
To investigate whether any of the investigated parameters may have independent predictive power for mortality, a multivariate Cox regression model was calculated with parameters that were significantly different in univariate analysis and not included in the SHFM score. Because this analysis excluded 20 patients in whom OUES could not be obtained, we also repeated the multivariate analysis excluding OUES, thus comprising all 157 patients.
In the first multivariate analysis of 137 patients containing SHFM score, VE/VCO2 slope, peak VO2, OUES, NT‐proBNP, and NYHA class, only SHFM score persisted as an independent predictor of death (hazard ratio of death for an increase of SHFM score by 0.1: 1.151, 95% confidence interval: 1.082–1.225, P < 0.001). table 2 shows the result of the second multivariate analysis of all 157 patients containing an SHFM score, VE/VCO2 slope, peak VO2, NT‐proBNP, and NYHA class. SHFM score also persisted as the strongest independent predictor of adverse outcome, followed by VE/VCO2 slope and NT‐proBNP. In both analyses, all other CPET parameters failed to be of independent prognostic relevance.
Table 2.
Cox Regression Analysis for Death Including SHFM Score, VE/VCO2 Slope, Peak VO2, NYHA Class, and NT‐proBNP (n = 157 Patients)
| Parameter | Univariate P Value | Multivariate P Value | Exponent β | Lower 95% CI | Upper 95% CI |
|---|---|---|---|---|---|
| SHFM score (*10) | <0.001 | <0.001 | 1.139 | 1.080 | 1.202 |
| VE/VCO2 slope | <0.001 | 0.005 | 1.026 | 1.001 | 1.052 |
| NT‐proBNP (/1000) | <0.001 | 0.005 | 1.329 | 1.089 | 1.622 |
| Peak VO2 | <0.001 | 0.409 | |||
| NYHA class | <0.001 | 0.428 |
Abbreviations: CI, confidence interval; SHFM, Seattle Heart Failure Model; NT‐proBNP, N‐terminal pro‐brain natriuretic peptide; NYHA, New York Hearth Association; Peak VO2, peak oxygen uptake; VE/VCO2, ventilation and carbon dioxide elimination.
Finally, because CPET results differed significantly between survivors and nonsurvivors in univariate analysis, we questioned whether CPET might add additional prognostic value following stratification for the SHFM score. Kaplan‐Meier analysis was performed after dichotomization for SHFM score and VE/VCO2 slope as independent predictors of mortality (Figure 3). In patients with an initial SHFM score <0.15 indicative of favorable prognosis, no significant differences between survival curves of patients with a VE/VCO2 slope less than or ≥32.1 were observed. In contrast, in patients with a SHFM score ≥0.15, the subgroup of patients with a VE/VCO2 slope ≥32.1 demonstrated a significantly lower survival rate compared to patients with a more favorable initial VE/VCO2 slope. Therefore, CPET by use of the VE/VCO2 slope adds prognostic information to the SHFM score, specifically in patients with higher SHFM scores.
Figure 3.
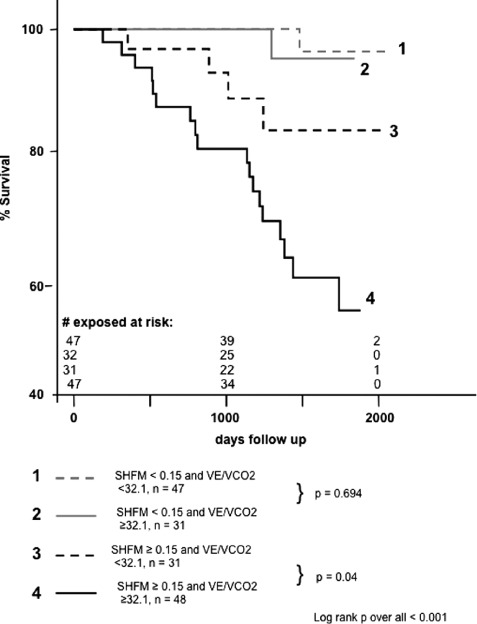
Kaplan‐Meier analysis. Survival curves after dichotomization for receiver operating characteristics‐derived cutoff values of the Seattle Heart Failure Model (SHFM) score, and ventilation and carbon dioxide elimination (VE/VCO2) slope demonstrating the additive value of the VE/VCO2 slope.
Discussion
The present retrospective study compared the prognostic relevance of CPET and the SHFM score in patients with stable chronic ischemic heart failure. Our results demonstrate that VE/VCO2 slope is the only CPET parameter achieving comparable sensitivity and specificity to that of the SHFM score. SHFM score persisted as the strongest independent predictor of overall mortality, and VE/VCO2 slope provided additional significant risk stratification in patients with a high SHFM score at baseline.
Importance of Scoring Systems for Prognosis Assessment in CHF Patients
One key issue in the management of heart failure patients remains the identification of patients at risk who may benefit from more intensive treatments like assist‐device implantation or heart transplantation. For this purpose, a variety of prognostic markers have been implemented in different scoring models. One established prognostic tool is CPET. The most widely used CPET parameter is peak VO2. However, in our patient cohort, peak VO2 provided the weakest prognostic information, whereas the submaximal CPET parameters VE/VCO2 slope and OUES had better AUCs. Even if our finding might be explained by standardized and not patient‐tailored exercise protocols with submaximal peak VO2 levels, this is in line with the European Society of Cardiology guidelines in 2008, which favor the use of VE/VCO2 slope in addition to peak VO2 for prognostic information.17
In contrast to CPET, other prognostic scores rely on clinical and laboratory variables. The most recently developed SHFM score can be easily obtained and includes device and pharmacological therapy, in contrast to the older Heart Failure Survival Score developed for advanced heart failure stages prior to the era of β‐blockers and ACEIs.18, 19
Comparison of SHFM Score and CPET in Mortality Prediction
In our analysis, the VE/VCO2 slope provides a better risk assessment than peak VO2, and it is the only independent predictor of death together with the SHFM score and NT‐proBNP serum levels at baseline. These data are in line with previous work describing the prognostic power of VE/VCO2 slope.4, 20 Moreover, our results are concordant with a recent report from Levy et al describing an incremental prognostic value of VE/VCO2 slope, when integrated in the SHFM score, in contrast to additional implementation of brain natriuretic peptide levels.21
Our analysis confirms that the SHFM score can be applied easily and with adequate prognostic accuracy in CHF patients. However, in contrast to the patients the SHFM was derived from,10 our patients reflect a rather stable cohort with only moderately impaired LVEF and elevated NT‐proBNP serum levels. Therefore, the observed mortality rate of 1.9% after 1 year and 15.3% after 5.6 years is lower than the SHFM‐predicted mortality rate of 7% within the first year and extrapolated 28% mortality after 5 years.
In contrast to previous data,22 we were not able to describe an association of the SHFM score or CPET and the mode of death in our patients due to the limited number of witnessed sudden cardiac deaths. Therefore, we cannot address the question whether CPET and the SHFM score together may add prognostic information concerning the mode of death.
Study Limitations
A major limitation of this retrospective analysis study are the different CPET protocols with significantly different results in peak VO2 and further nonsignificant differences in other CPET parameters. We cannot exclude that identical exercise protocols would have enhanced the predictive value of CPET and especially peak VO2, as this parameter recently has been shown to augment the prognostic utility of the SHFM score in some patients.23 However, separate analysis of the 2 groups with either treadmill or bicycle testing revealed similar results for sensitivity, specificity, and especially superiority of SHFM by Cox regression analysis (data not shown).
Another drawback of this retrospective analysis is the use of standardized exercise protocols, not adjusted to the individual patient's exercise capacity. There is ongoing debate whether submaximal CPET results are prognostically useful.9, 24 Even if the subgroup of patients with reduced exercise tolerance could have generated submaximal peak VO2 values, they do reproduce valid VE/VCO2 slopes.8 We therefore did not exclude patients with short‐lasting, possibly submaximal, exercise tests.
Conclusion
The present study shows that optimized mortality risk assessment by combining submaximal CPET results and the SHFM score may lead to improved patient care and prognosis of CHF.
References
- 1. Lloyd‐Jones D, Adams RJ, Brown TM, et al. Heart disease and stroke statistics—2010 update: a report from the American Heart Association. Circulation. 2010;121:e46–e215. [DOI] [PubMed] [Google Scholar]
- 2. Costanzo MR, Augustine S, Bourge R, et al. Selection and treatment of candidates for heart transplantation. A statement for health professionals from the Committee on Heart Failure and Cardiac Transplantation of the Council on Clinical Cardiology, American Heart Association. Circulation. 1995;92:3593–3612. [DOI] [PubMed] [Google Scholar]
- 3. Mancini DM, Eisen H, Kussmaul W, et al. Value of peak exercise oxygen consumption for optimal timing of cardiac transplantation in ambulatory patients with heart failure. Circulation. 1991;83:778–786. [DOI] [PubMed] [Google Scholar]
- 4. Chua TP, Ponikowski P, Harrington D , et al . Clinical correlates and prognostic significance of the ventilatory response to exercise in chronic heart failure. J Am Coll Cardiol. 1997;29:1585–1590. [DOI] [PubMed] [Google Scholar]
- 5. Hollenberg M, Tager IB. Oxygen uptake efficiency slope: an index of exercise performance and cardiopulmonary reserve requiring only submaximal exercise. J Am Coll Cardiol. 2000;36:194–201. [DOI] [PubMed] [Google Scholar]
- 6. Davies LC, Wensel R, Georgiadou P, et al. Enhanced prognostic value from cardiopulmonary exercise testing in chronic heart failure by non‐linear analysis: oxygen uptake efficiency slope. Eur Heart J. 2006;27:684–690. [DOI] [PubMed] [Google Scholar]
- 7. Arena R, Myers J, Aslam SS, et al. Peak VO2 and VE/VCO2 slope in patients with heart failure: a prognostic comparison. Am Heart J. 2004;147:354–360. [DOI] [PubMed] [Google Scholar]
- 8. Arena R, Myers J, Hsu L, et al. The minute ventilation/carbon dioxide production slope is prognostically superior to the oxygen uptake efficiency slope. J Card Fail. 2007;13:462–469. [DOI] [PubMed] [Google Scholar]
- 9. Woods PR, Bailey KR, Wood CM, et al. Submaximal exercise gas exchange is an important prognostic tool to predict adverse outcomes in heart failure. Eur J Heart Fail. 2011;13:303–310. [DOI] [PMC free article] [PubMed] [Google Scholar]
- 10. Levy WC, Mozaffarian D, Linker DT, et al. The Seattle Heart Failure Model: prediction of survival in heart failure. Circulation. 2006;113:1424–1433. [DOI] [PubMed] [Google Scholar]
- 11. Kalogeropoulos AP, Georgiopoulou VV, Giamouzis G, et al. Utility of the Seattle Heart Failure Model in patients with advanced heart failure. J Am Coll Cardiol. 2009;53:334–342. [DOI] [PubMed] [Google Scholar]
- 12. Gorodeski EZ, Chu EC, Chow CH, et al. Application of the Seattle Heart Failure Model in ambulatory patients presented to an advanced heart failure therapeutics committee. Circ Heart Fail. 2010;3:706–714. [DOI] [PubMed] [Google Scholar]
- 13. May HT, Horne BD, Levy WC, et al. Validation of the Seattle Heart Failure Model in a community‐based heart failure population and enhancement by adding B‐type natriuretic peptide. Am J Cardiol. 2007;100:697–700. [DOI] [PubMed] [Google Scholar]
- 14. Ketchum ES, Moorman AJ, Fishbein DP, et al. Predictive value of the Seattle Heart Failure Model in patients undergoing left ventricular assist device placement. J Heart Lung Transplant. 2010;29:1021–1025. [DOI] [PubMed] [Google Scholar]
- 15. Assmus B, Honold J, Schachinger V, et al. Transcoronary transplantation of progenitor cells after myocardial infarction. N Engl J Med. 2006;355:1222–1232. [DOI] [PubMed] [Google Scholar]
- 16. Assmus B, Fischer‐Rasokat U, Honold J, et al. Transcoronary transplantation of functionally competent BMCs is associated with a decrease in natriuretic peptide serum levels and improved survival of patients with chronic postinfarction heart failure: results of the TOPCARE‐CHD Registry. Circ Res. 2007;100:1234–1241. [DOI] [PubMed] [Google Scholar]
- 17. Dickstein K, Cohen‐Solal A, Filippatos G, et al. ESC Guidelines for the diagnosis and treatment of acute and chronic heart failure 2008: the Task Force for the Diagnosis and Treatment of Acute and Chronic Heart Failure 2008 of the European Society of Cardiology. Developed in collaboration with the Heart Failure Association of the ESC (HFA) and endorsed by the European Society of Intensive Care Medicine (ESICM). Eur Heart J. 2008;29:2388–2442. [DOI] [PubMed] [Google Scholar]
- 18. Aaronson KD, Schwartz JS, Chen TM, et al. Development and prospective validation of a clinical index to predict survival in ambulatory patients referred for cardiac transplant evaluation. Circulation. 1997;95:2660–2667. [DOI] [PubMed] [Google Scholar]
- 19. Gardner RS, McDonagh TA, MacDonald M, et al. Who needs a heart transplant? Eur Heart J. 2006;27:770–772. [DOI] [PubMed] [Google Scholar]
- 20. Kleber FX, Vietzke G, Wernecke KD, et al. Impairment of ventilatory efficiency in heart failure: prognostic impact. Circulation. 2000;101:2803–2809. [DOI] [PubMed] [Google Scholar]
- 21. Levy WC, Arena R, Wagoner LE, et al. Prognostic impact of the addition of ventilatory efficiency to the Seattle Heart Failure Model in patients with heart failure. J Card Fail. 2012;18:614–619. [DOI] [PubMed] [Google Scholar]
- 22. Mozaffarian D, Anker SD, Anand I, et al. Prediction of mode of death in heart failure: the Seattle Heart Failure Model. Circulation. 2007;116:392–398. [DOI] [PubMed] [Google Scholar]
- 23. Levy WC, Aaronson KD, Dardas TF, et al. Prognostic impact of the addition of peak oxygen consumption to the Seattle Heart Failure Model in a transplant referral population. J Heart Lung Transplant. 2012;31:817–824. [DOI] [PubMed] [Google Scholar]
- 24. Pardaens K, Van Cleemput J, Vanhaecke J, et al. Peak oxygen uptake better predicts outcome than submaximal respiratory data in heart transplant candidates. Circulation. 2000;101:1152–1157. [DOI] [PubMed] [Google Scholar]