

Abstract
Objective
To compare machine learning methods for predicting inpatient seizures risk and determine the feasibility of 1‐h screening EEG to identify low‐risk patients (<5% seizures risk in 48 h).
Methods
The Critical Care EEG Monitoring Research Consortium (CCEMRC) multicenter database contains 7716 continuous EEGs (cEEG). Neural networks (NN), elastic net logistic regression (EN), and sparse linear integer model (RiskSLIM) were trained to predict seizures. RiskSLIM was used previously to generate 2HELPS2B model of seizure predictions. Data were divided into training (60% for model fitting) and evaluation (40% for model evaluation) cohorts. Performance was measured using area under the receiver operating curve (AUC), mean risk calibration (CAL), and negative predictive value (NPV). A secondary analysis was performed using Monte Carlo simulation (MCS) to normalize all EEG recordings to 48 h and use only the first hour of EEG as a “screening EEG” to generate predictions.
Results
RiskSLIM recreated the 2HELPS2B model. All models had comparable AUC: evaluation cohort (NN: 0.85, EN: 0.84, 2HELPS2B: 0.83) and MCS (NN: 0.82, EN; 0.82, 2HELPS2B: 0.81) and NPV (absence of seizures in the group that the models predicted to be low risk): evaluation cohort (NN: 97%, EN: 97%, 2HELPS2B: 97%) and MCS (NN: 97%, EN: 99%, 2HELPS2B: 97%). 2HELPS2B model was able to identify the largest proportion of low‐risk patients.
Interpretation
For seizure risk stratification of hospitalized patients, the RiskSLIM generated 2HELPS2B model compares favorably to the complex NN and EN generated models. 2HELPS2B is able to accurately and quickly identify low‐risk patients with only a 1‐h screening EEG.
Introduction
Continuous EEG monitoring (cEEG) in hospitalized patients has annual double‐digit growth rates.1, 2 In part, the growth is related to the recognition that subclinical/electrographic seizures are relatively common (10–20%) in hospitalized patients.3, 4, 5, 6, 7, 8, 9, 10 Further, electrographic seizures are not limited to primarily neurological disease – critically ill patients with primary medical illness are at risk for seizures (10–12%).11, 12 Clinical evidence for cEEG includes studies of cost‐effectiveness,13 decreased mortality,14 and a dose–response relationship to electrographic seizure burden and outcomes.14, 15, 16
A tool to improve overall seizure detection and guide cEEG use is needed. Clinical criteria alone are ineffective in seizure prediction. The incorporation of epileptiform EEG findings improves risk stratification.3, 10, 15, 17, 18 2HELPS2B17 is a model that was developed using the RiskSLIM machine learning algorithm.19, 20 2HELPS2B is designed to stratify inpatient seizure risk based on EEG features and a single clinical factor (remote history of seizures or recent suspected acute symptomatic seizure) (Fig. 1). The most practical application of this tool is to identify patients at low seizure risk (<5%), so that clinical and EEG resources can be quickly diverted to patients at greater risk.
Figure 1.

Description of the 2HELPS2B score with associated predicted and observed incidence of seizures from the foundational study (Struck et al. 2017) based on critical care EEG monitoring research consortium (CCERMC), n = 5427 subjects.
This study is an attempt to find the optimal method to rapidly identify this low‐risk group. The goal is to maximize both the negative predictive value and the proportion of patients that are recognized as low risk by using a combination of EEG and clinical risk factors. To address this issue, we compare three machine learning methods, neural networks,21 elastic net logistic regression,22, 23, 24 and RiskSLIM,19, 20 and apply them to database of 7716 cEEGs from the Critical Care EEG Monitoring Research Consortium (CCEMRC).25
Methods
Database
The CCEMRC database is approved by respective local institutional review boards (IRBs) for this multicenter prospective observational study, to collect clinical and EEG data on consecutive patients placed on cEEG. The contributing centers are Yale University, Brigham and Women’s Hospital, and Emory University Hospital. Inclusion criteria include cEEG monitoring of ≥24 h and age ≥18 years. Exclusion criteria include elective epilepsy monitoring unit admission. EEG analysis was performed using standardized clinical EEG interpretation including ACNS critical care EEG terminology.26 All EEG interpreters contributing to the database are certified in ACNS critical care EEG terminology – see Lee et al. for complete details for the methodology regarding the CCEMRC database.25 Similarly, clinical variables were prospectively collected using a standardized template.
Predictive variables
The following predictive variables were obtained from the CCEMRC database for each subject (overall total 39):
Clinical variables (total = 19)
Age (binary ≥ 65), sex, alert, altered mental status but not comatose, coma, suspected clinical seizure prior to EEG, history of epilepsy or remote prior seizure, AED use at start of EEG, IV sedation use other than opioid at start of EEG, diagnosis of status epilepticus, ischemic stroke, aneurysmal subarachnoid hemorrhage, traumatic brain injury, hypoxic ischemic injury, metabolic encephalopathy, intraparenchymal hemorrhage, subdural hemorrhage, CNS tumor, and CNS infection are clinical variables.
EEG variables (total = 22)
EEG duration, sporadic epileptiform discharges (SED), lateralized periodic discharges (LPD), lateralized rhythmic delta activity (LRDA), generalized periodic discharges (GPD), generalized rhythmic delta activity (GRDA), bilateral independent periodic discharges (BIPD), frequency of rhythmic or periodic patterns > 2Hz (FQ), plus features including superimposed rhythmic, sharp, or fast activity on a periodic or rhythmic pattern (PLUS), duration of rhythmic/periodic pattern (binary > 1 min), prevalence of rhythmic/periodic pattern (binary > 10% of EEG), brief rhythmic discharge (BRD), presence of a posterior dominant rhythm (PDR) at any point in EEG, symmetric background/focal slowing, presence of anterior to posterior gradient, presence of sleep spindles at any point during the EEG, any discontinuity of background, burst suppression (>50% suppressed), and predominant background frequency: alpha/beta/theta/delta are EEG variables.
Outcome variable
Standardized outcome variable was an electrographic seizure during any portion of cEEG (binary).
Machine learning
The database was divided into a training (60%, n = 4629) and evaluation (40%, n = 3087) cohorts. The evaluation cohort was used only to evaluate and compare the models; it was excluded from training of model parameters and hyperparameters. The training cohort was subdivided into a parameter training (48% of total, n = 3704) cohort and a validation (12% of total, n = 925) cohort in keeping with prescribed practices of machine learning.27 Parameter training was used to fit model parameters. The validation cohort was used to fit hyperparameters such as number of layers in the neural network model and the L1/L2 mixing parameter in elastic net as well as to quantify overfitting. All analysis was performed in R (R‐Core Vienna Austria).28
Neural network/deep learning
Neural network analysis was performed with the “Keras” package29 with TensorFlow as the backend. The hyperparameter space for neural networks is large and consists of several elements including number of layers, number of units per layer, activation function, loss function, optimizer choice, batch size, epoch number, and dropout. The study question involves a relatively small set of binary predictors with a binary outcome variable so only densely connected layers were used. Binary cross‐entropy28 was used as the loss function. The relatively modest number of predictors and training set allowed for rapid training of the networks allowing for a broad exploration of the hyperparameter space to find a relative minimum in the validation loss metric. The neural networks were trained on the parameter training cohort. The validation cohort was used to evaluate the hyperparameter space and to determine when overfitting occurred.
Elastic net logistic regression
Analysis was performed with the “glmnet” package.30 Elastic net logistic regression is an extension of a generalized linear model with the addition of regularization via a mixed L1/L2 loss function, combining ridge, and lasso regression. The mixing L1/L2 parameter “alpha” was determined using grid search from 0 to 1 with 0.1 intervals. The highest AUC from validation cohort was used to select alpha. Model parameters were fit using the parameter training cohort using 10‐fold internal cross‐validation to optimize the regularization weight “lambda” and the model coefficients, in order to minimize AUC on the validation cohort.
RiskSLIM
The risk sparse linear integer machine (RiskSLIM) algorithm19, 20 is a tool to create optimized risk scores. It values simplicity and ease of use as well as low risk calibration error and accuracy. The database used in this study overlaps with the subjects used in the foundational 2HELPS2B17 study, now with an additional 2289 cEEGs. The method of model evaluation/training is also slightly different (fivefold cross‐validation vs. independent evaluation cohort). This is due to the concerns of overfitting of the hyperparameters in the neural net and elastic net models. We wanted to treat all machine learning algorithms as equally as possible, so it was necessary to re‐train the RiskSLIM algorithm to see whether the 2HELPS2B model would be recreated. 2HELPS2B (Fig. 1) is a tool that predicts risk of seizures on patients placed on continuous EEG monitoring based on five electrographic findings and one clinical factor – the presence of either a suspected acute symptomatic seizure or remote history of seizure.
Evaluation of models
After model optimization, model performance was tested on the evaluation cohort using area under the curve (AUC), negative predictive value (NPV), and root mean squared risk calibration (CAL). AUC was calculated the using “pROC” package,29 and comparison of AUCs was performed using bootstrapping for paired ROC curves with alpha set to 0.05. AUC was calculated with 95% confidence intervals using bootstrapping (2000 iterations).
AUC measures the ability of a model to discriminate between two categories (seizure/no seizure). In clinical practice, it is more useful to place patients in risk categories like low, medium, and high. To measure the ability to reliably perform this risk stratification, root mean squared risk calibration error (CAL) is used. Seizure probability was subdivided into three ordinal levels posited to be clinically relevant: low (<5%), medium [5–25%], and high (>25%). NPV is defined as true negative divided by the sum of true negatives and false negatives. In this instance, true negatives are the number of subjects predicted as low risk per the model who did not have a seizure. False negatives are the number of subjects predicted as low risk who did have a seizure. CAL and NPV metrics between models were compared statistically using parametric comparison of proportions with continuity correction. Confidence intervals were obtained with bootstrapping.
Monte Carlo simulation
Complicating the development of seizure risk stratification in hospitalized patients are two factors. One is that patients have differing durations of cEEG which affects the likelihood of capturing a seizure; that is, longer duration EEG is more likely to capture a seizure.10 The second is related to the emergence of EEG findings. It is clear that certain electrographic markers of cortical irritability increase the risk of seizures. The question of how long a “screening” EEG needs to be is not well‐defined. In this study, we are aiming to quickly identify low‐risk patients, by maximizing the negative predictive value. We performed a Monte Carlo simulation to adjust for these two factors. The baseline clinical characteristics and background EEG were left unchanged. The incidence of seizures was adjusted to a standardized 48 h, and paroxysmal EEG findings (e.g., sporadic epileptiform discharges, lateralized periodic discharge) were adjusted so that only the findings found in the first hour would be incorporated into the model, the intention being that 1 h of screening EEG would be a convenient and common duration in clinical practice.
The adjustments were performed from Kaplan–Meier survival analysis from an independent cohort of 1071 subjects from Yale University Hospital and Hôpital Erasme.18 This database has explicit time dependency for EEG findings including seizures. Using this analysis, the probability of having missed a seizure by too short of EEG duration is modeled, as is the probability of capturing an EEG abnormality in first hour of cEEG. The simulation procedure is as follows: For seizure prediction subjects with 48 h or greater duration of EEG, no correction was applied. Subjects with <24 h of monitoring were not included. Subjects with only 24 h of monitoring and no EEG findings of cortical irritability nor history of seizure had no adjustment applied. For subjects with a history of seizure or EEG findings of cortical irritability and only 24 h of cEEG, the probability that seizure was missed was 4.7%. So, for each trial of the stimulation, this subject would randomly assigned a 4.7% chance of having a seizure. In a related manner, the proportion of paroxysmal EEG findings detected during the first hour of EEG was estimated based on Kaplan–Meier survival analysis for the emergence of those findings in the independent cohort. Based on this survival analysis, we model the probability of 68 to 71% of a paroxysmal EEG finding (that was found on the total cEEG study) would be found within the first hour of recording.
The simulation was performed using only subjects from the evaluation cohort. For each trial, subjects were selected at random with replacement up to the size of the evaluation cohort (3087 subjects) and then corrections to seizure risk and EEG findings were performed as described above. The AUC, NPV, and CAL were recorded for each of the models for each trial of the simulation. A total of 1000 trials were performed.
Results
Demographic
A total of 7716 subjects met criteria for the study. Subjects were collected from February 2013 to November 2018. Univariate analysis on this cohort has been described in previous publication.31 Table 1 shows the demographic features for several baseline characteristics between the training and evaluation cohorts.
Table 1.
Demographics.
| Cohort | # of subjects | Age (>65) | Sex (female) | % with seizures | EEG duration (days)* | Coma | AED use | IV sedation |
|---|---|---|---|---|---|---|---|---|
| Training | 4629 | 31.0% | 58.3% | 17.0% | 2.2 | 22.1% | 68.2% | 25.6% |
| Evaluation | 3087 | 30.7% | 58.3% | 15.5% | 2.1 | 22.7% | 68.7% | 27.6% |
| P‐value | 0.80 | 1.00 | 0.09 | 0.37 | 0.55 | 0.66 | 0.05 |
Median.
Model training
Neural net
The final model consisted of five densely connected layers with 256, 128, 128, 64 units, respectively (Fig. S1). Activation functions were exponential linear units (ELU), except for the final layer which had a sigmoid activation function. RMSprop was used as the optimizer and binary cross‐entropy was used as the loss function. Dropout32 and L2 regularization were used to improve model regularization. Batch size was 1000; training included 13000 epochs. Exploring other methods including larger and smaller networks with different activation functions and optimizers failed to reduce the validation loss function, suggesting that this model is close to optimal for this set of predictive variables.
Elastic net logistic regression
The highest validation cohort AUC for any of the L1/L2 mixing parameter was 0.822 associated with an alpha of 0. An alpha of 0 means strictly L2 minimization (ridge regression). The lambda was determined with internal 10‐fold cross‐validation on the parameter training cohort, and final optimization was 0.016. Coefficients are found in Table S1.
RiskSLIM
The six variables (5 EEG and 1 clinical) (Fig. 1) were again identified as the most important predictive variables, and the coefficients and intercept were the same as in the initial study. The 2HELPS2B model was recreated using only the training cohort.
Model comparison
In the model comparison section, we use the label 2HELPS2B (the model) instead RiskSLIM (the algorithm used to generate 2HELPS2B). For the neural net and elastic net generated models, we use the algorithm name as a shorthand for the models they generated.
CCEMRC evaluation cohort
ROC/AUC
The models were first assessed using the evaluation cohort. Data are presented with 95% confidence intervals (95% CI). Neural net AUC was 0.85 (95% CI: 0.83–0.86), elastic net AUC was 0.84 (95% CI: 0.82–0.86), and 2HELPS2B AUC was 0.83 (95% CI: 0.81–0.85). The AUC was also statistically compared: neural net versus elastic net (P = 0.67), 2HELPS2B versus elastic net (P < 0.001), and 2HELPS2B versus neural net (P < 0.001) (Fig. 2A).
Figure 2.
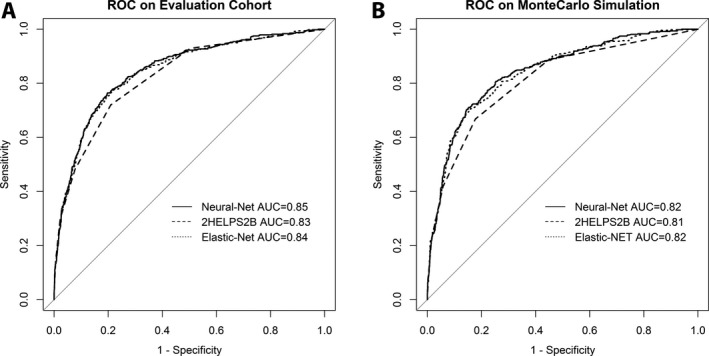
Receiver operator characteristic (ROC) curves on the (A) CCEMRC evaluation cohort (N = 3087) for neural net: AUC 0.85 (95% CI: 0.83–0.86), elastic net: AUC 0.84 (95% CI: 0.82–0.86), and 2HELPS2B: AUC 0.83 (95% CI: 0.81–0.85). (B) ROC curves on the Monte Carlo simulation (1000 trials) with random sampling of CCEMRC evaluation cohort seizure incidence corrected for EEG duration (to 48 h) and corrected for detection of paroxysmal EEG findings (e.g., lateralized periodic discharges) during first hour of cEEG (“screening EEG”): neural net: AUC 0.82 (95% CI: 0.80–0.85), elastic net: AUC 0.82 (95% CI: 0.80–0.84), and 2HELPS2B: AUC 0.81 (95% CI: 0.79–0.83).
On the evaluation cohort, CAL was 2.8% for neural net (95% CI: 2.3‐–.5%), 2.1% elastic net (95% CI: 2.0–2.6%), and 2.3% for 2HELPS2B (95% CI: 1.8–2.9%) (Fig. 3A), meaning that, on average, the predicted risk and the actual risk were <5% for all methods. Statistically comparing the CAL measures resulted in neural net versus elastic net (P = 0.06), 2HELPS2B versus elastic net (P = 0.56), and 2HELPS2B versus neural net (P = 0.23).
Figure 3.
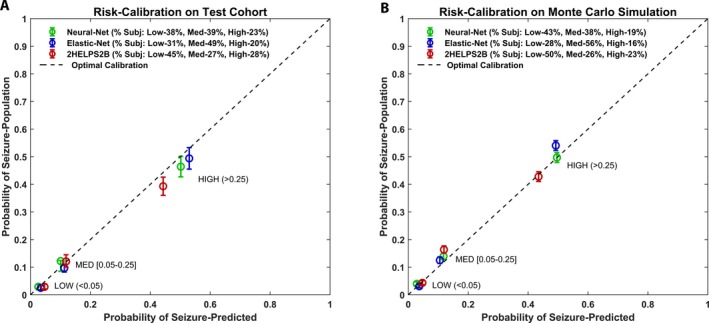
Risk calibration plots for (A) CCEMRC evaluation cohort (N = 3087) for low risk (predicted seizure incidence < 5%), medium risk (predicted seizure incidence 5–25%), and high risk (seizure incidence > 25%). Perfect risk calibration is represented by the dashed line. Mean risk calibration error is neural net: 2.8% (95% CI: 2.3–3.5%), elastic net: 2.1% (95% CI: 1.6–2.6%), and RiskSLIM: 2.3% (95% CI: 1.8–2.9%). (B) Risk calibration plot on the Monte Carlo simulation (1000 trials) with random sampling of CCEMRC evaluation cohort seizure incidence corrected for EEG duration (to 48 h) and corrected for detection of paroxysmal EEG findings (e.g., lateralized periodic discharges) during first hour of cEEG: neural net: CAL 2.0% (95% CI: 0.82–3.5%), elastic net: CAL 2.5% (95% CI: 1.2–4.1%), and RiskSLIM: CAL 1.8% (95% CI: 1.4–2.4%).
The negative predictive value (NPV) is defined in this study as the percent chance that if the model predicts a low risk of seizure (<0.05), then a subject will indeed not have a seizure. This measure was selected because quickly identifying the low‐risk group of patients allows minimizing cEEG in low‐risk patients. We also report the percentage of the patient population that was identified as low risk by the model. The greater the proportion of patients accurately identified as low risk, the higher the clinical utility of the model – as long as NPV remains high. In the evaluation cohort, the NPV for the different models is as follows: neural net: 38% of cohort identified as low risk, NPV 97% (95% CI: 96–98%); elastic net: 31% of cohort identified as low risk, NPV 97% (95% CI: 96–98%); and 2HELPS2B: 43% of cohort identified as low risk, NPV 97% (95% CI: 96–98%). Comparing the NPV between models resulted in neural net versus elastic net (P = 0.99), 2HELPS2B versus elastic net (P = 0.98), and 2HELPS2B versus neural net (P = 0.99).
Monte Carlo simulation/corrected data
A Monte Carlo simulation was performed to correct the data for varying duration of cEEG as well as limiting the EEG findings to those evident in the first hour of recording. Mean and 95% confidence interval were derived from the 1000 trials for AUC, NPV, and CAL. Neural Net: AUC 0.82 (95% CI: 0.8–0.85), Elastic Net: AUC 0.82 (95% CI: 0.80–0.84), and 2HELPS2B: AUC 0.81 (95% CI: 0.79–0.83). Statistical comparison of AUC was as follows: Neural Net v Elastic Net (P = 0.19), 2HELPS2B v Elastic Net (P < 0.001), and 2HELPS2B v Neural Net (P < 0.001) (Fig. 2B).
Risk calibration was as follows: neural net: CAL 2.0% (95% CI: 0.82–3.5%), elastic net: CAL 2.5% (95% CI: 1.2–4.1%), and 2HELPS2B: CAL 1.8% (95% CI: 1.4–2.4%). Statistical comparison of CAL was as follows: neural net versus elastic net (P = 0.19), 2HELPS2B versus elastic net (P = 0.76), and 2HELPS2B versus neural net (P = 0.08) (Fig. 3B).
The NPV from the Monte Carlo simulation was as follows: NPV neural net: 43% of cohort identified as low risk, NPV 97% (95% CI: 96–98%); elastic net: 28% of cohort identified as low risk, NPV 99% (95% CI: 97–99%); and 2HELPS2B 48% of population identified as low risk, NPV 97% (95% CI: 96–97%). Statistical comparison of NPV resulted in neural net versus elastic net (P = 0.44), 2HELPS2B versus elastic net (P = 0.03), 2HELPS2B versus neural net (P = 0.56).
Discussion
This study has three relevant implications. First, it demonstrates that the three machine learning techniques used for near‐term seizure prediction have fairly similar results in terms of AUC, CAL, and NPV especially when considered at a clinical level. The relatively minor improvement with neural networks capable of representing complex nonlinear relationships would suggest that there is unlikely to be much improvement in seizure prediction with other machine learning methods. Further improvements are only likely by expanding the number of independent predictive variables – possibly using quantitative and automated EEG interpretation or more detailed clinical/neurophysiological data (e.g., cerebral oxygenation, microdialysis, or electrocorticography). Second, given that the models are relatively similar, particularly in the most clinically relevant metric NPV, we argue for the use of 2HELPS2B over the other models. 2HELPS2B is simple, is easy to use, and identifies the greatest proportion of low‐risk subject making it most practical for routine clinical implementation. Third, based on the Monte‐Carlo simulation, 2HELPS2B is able to identify the low‐risk patients with only a 1‐h screening EEG with an NPV of 97% (i.e., false negative rate of 3%). Fifty percent of patients were able to be categorized as low risk (<5% chance of having a seizure), which would potentially permit stopping EEG recordings for these patients.
Previous investigations corroborate several findings from this study. One key finding is that EEG is needed to accurately risk‐stratify patients for seizures.3, 10, 18 This study also documents the similar risk calibration and recapitulates the same model as initial 2HELPS2B study even with a larger number of potential predictive variables. The seizure incidence, etiologies, and indications for cEEG monitoring are similar to prior investigations5, 9, 12 – suggesting the study cohort is broadly reflective of the clinical experience at large tertiary care hospitals.
The major limitations of the study are the reliance on a prospective observational cohort. This introduces the possibility of selection bias, as not all patients at risk for seizures underwent cEEG. The use of a multicenter database with a relatively large number of subjects reduces the effect of the practice patterns of any single center or clinician, which improves generalizability, but the overall practice patterns via which patients are selected for cEEG are likely similar amongst these centers making selection bias a relevant limitation. Another aspect not addressed by this study is the influence of prophylactic antiseizure drugs and the use of continuous infusion of sedatives. These factors affect both electrophysiology and the likelihood of seizures. Previous prospective studies have found mixed results regarding the efficacy of antiseizure drug(ASD) prophylaxi.33, 34, 35, 36 The mixed results of these studies suggest that ASD prophylaxis likely has a modest, if any, effect on both the suppression of cortical irritability and seizure risk. IV sedatives have a larger and temporary effect at suppressing cortical irritability and seizures. Future studies beyond the scope of questions answerable with the current data are needed to fully address these concerns.
This study provides support for a clinical paradigm of using 2HELPS2B on screening 1‐h EEGs on a broad cross‐section of critically ill patients followed by transition to traditional longer duration cEEG if there is evidence of cortical irritability or a prior seizure (2HELPS2B > 0). This approach may lead to higher rates of seizure detection while minimizing prolonged low‐yield cEEG.
Conflicts of Interest
Lawrence J. Hirsch has research support to Yale University for investigator‐initiated studies from Monteris, Upsher‐Smith, and The Daniel Raymond Wong Neurology Research Fund at Yale; consultation fees for advising from Adamas, Aquestive, Ceribell, Eisai, Medtronic and UCB; royalties for authoring chapters for UpToDate‐Neurology and from Wiley for co‐authoring the book “Atlas of EEG in Critical Care,” by Hirsch and Brenner; honoraria for speaking from Neuropace. Monica B. Dhakar has received honorarium for consultancy from Adamas Pharmaceuticals and research support from Marinus Pharmaceuticals and UCB Biopharma for clinical trials.
The remaining authors have no conflict of interests.
Supporting information
Figure S1. Architecture of the deep‐learning model, “elu” exponential linear unit, sigmoid is sigmoid function. Dense is a densely connected layer.
Table S1. List of seizure risk factors and associated coefficients in the final optimized Elastic‐Net Logistic Regression model, alpha = 0 (rigid regression), lambda = 0.016.
Acknowledgment
Development of the Critical Care EEG Monitoring Research Consortium database was supported by research infrastructure awards by the American Epilepsy Society and Epilepsy Foundation of America.
Funding information
Development of the Critical Care EEG Monitoring Research Consortium database was supported by research infrastructure awards by the American Epilepsy Society and Epilepsy Foundation of America.
Funding Statement
This work was funded by American Epilepsy Society grant ; Epilepsy Foundation of America grant .
References
- 1. Ney JP, van der Goes DN, Nuwer MR, et al. Continuous and routine EEG in intensive care: utilization and outcomes, United States 2005–2009. Neurology 2013;81:2002–2008. [DOI] [PMC free article] [PubMed] [Google Scholar]
- 2. Kurtz P, Hanafy KA, Claassen J. Continuous EEG monitoring: is it ready for prime time? Curr Opin Crit Care 2009;15:99–109. [DOI] [PubMed] [Google Scholar]
- 3. Westover MB, Shafi MM, Bianchi MT, et al. The probability of seizures during EEG monitoring in critically ill adults. Clin Neurophysiol 2015;126:463–471. [DOI] [PMC free article] [PubMed] [Google Scholar]
- 4. Jordan KG. Continuous EEG and evoked potential monitoring in the neuroscience intensive care unit. J Clin Neurophysiol 1993;10:445–475. [DOI] [PubMed] [Google Scholar]
- 5. Young GB, Jordan KG, Doig GS. An assessment of nonconvulsive seizures in the intensive care unit using continuous EEG monitoring: an investigation of variables associated with mortality. Neurology 1996;47:83–89. [DOI] [PubMed] [Google Scholar]
- 6. Vespa P. Continuous EEG monitoring for the detection of seizures in traumatic brain injury, infarction, and intracerebral hemorrhage: “to detect and protect”. J Clin Neurophysiol 2005;22:99–106. [DOI] [PubMed] [Google Scholar]
- 7. Claassen J, Perotte A, Albers D, et al. Nonconvulsive seizures after subarachnoid hemorrhage: Multimodal detection and outcomes. Ann Neurol. 2013;74:53–64. [DOI] [PMC free article] [PubMed] [Google Scholar]
- 8. Claassen J, Jette N, Chum F, et al. Electrographic seizures and periodic discharges after intracerebral hemorrhage. Neurology 2007;69:1356–1365. [DOI] [PubMed] [Google Scholar]
- 9. Claassen J, Mayer SA, Kowalski RG, et al. Detection of electrographic seizures with continuous EEG monitoring in critically ill patients. Neurology 2004;62:1743–1748. [DOI] [PubMed] [Google Scholar]
- 10. Shafi MM, Westover MB, Cole AJ, et al. Absence of early epileptiform abnormalities predicts lack of seizures on continuous EEG. Neurology 2012;79:1796–1801. [DOI] [PMC free article] [PubMed] [Google Scholar]
- 11. Gilmore EJ, Gaspard N, Choi HA, et al. Acute brain failure in severe sepsis: a prospective study in the medical intensive care unit utilizing continuous EEG monitoring. Intensive Care Med 2015;41:686–694. [DOI] [PubMed] [Google Scholar]
- 12. Oddo M, Carrera E, Claassen J, et al. Continuous electroencephalography in the medical intensive care unit. Crit Care Med 2009;37:2051–2056. [DOI] [PubMed] [Google Scholar]
- 13. Abend NS, Topjian AA, Williams S. How much does it cost to identify a critically ill child experiencing electrographic seizures? J Clin Neurophysiol Off Publ Am Electroencephalogr Soc 2015;32:257–264. [DOI] [PMC free article] [PubMed] [Google Scholar]
- 14. Hill CE, Blank LJ, Thibault D, et al. Continuous EEG is associated with favorable hospitalization outcomes for critically ill patients. Neurology 2019;92:e9–e18. [DOI] [PMC free article] [PubMed] [Google Scholar]
- 15. Vespa P, Tubi M, Claassen J, et al. Metabolic crisis occurs with seizures and periodic discharges after brain trauma. Ann Neurol. 2016;79:579–590. [DOI] [PubMed] [Google Scholar]
- 16. De Marchis GM, Pugin D, Meyers E, et al. Seizure burden in subarachnoid hemorrhage associated with functional and cognitive outcome. Neurology 2016;86:253–260. [DOI] [PMC free article] [PubMed] [Google Scholar]
- 17. Struck AF, Ustun B, Ruiz AR, et al. Association of an electroencephalography‐based risk score with seizure probability in hospitalized patients. JAMA Neurol 2017;74:1419–1424. [DOI] [PMC free article] [PubMed] [Google Scholar]
- 18. Struck AF, Osman G, Rampal N, et al. Time‐dependent risk of seizures in critically ill patients on continuous electroencephalogram. Ann Neurol 2017;82:177–185. [DOI] [PMC free article] [PubMed] [Google Scholar]
- 19. Ustun B, Traca S, Rudin C. Superspare linear integer models for interpretable classification. arXiv [Internet]. 2014;1306.6677 Available from: https://arxiv.org/abs/1306.6677.
- 20. Ustun B, Rudin C. Methods and Models for Interpretable Linear Classification. ArXiv [Internet]. 2014. Available from: http://adsabs.harvard.edu/abs/2014arXiv1405.4047U.
- 21. Goodfellow I, Bengio Y, Courville A. Deep learning [Internet]. Cambridge, MA: The MIT Press; 2016. xxii, 775 pages. (Adaptive computation and machine learning). Available from: http://www.deeplearningbook.org/. [Google Scholar]
- 22. Friedman J, Hastie T, Tibshirani R. Regularization paths for generalized linear models via Coordinate descent. J Stat Softw 2010;33:1–22. [PMC free article] [PubMed] [Google Scholar]
- 23. Zou H, Hastie T. Elastic‐net for sparse estimation and sparse PCA.2012.
- 24. Tibshirani R, Bien J, Friedman J, et al. Strong rules for discarding predictors in lasso‐type problems. J R Stat Soc Ser B Stat Methodol 2012;74:245–266. [DOI] [PMC free article] [PubMed] [Google Scholar]
- 25. Lee JW, LaRoche S, Choi H, et al. Development and feasibility testing of a critical care EEG monitoring database for standardized clinical reporting and multicenter collaborative research. J Clin Neurophysiol Off Publ Am Electroencephalogr Soc 2016;33:133–140. [DOI] [PMC free article] [PubMed] [Google Scholar]
- 26. Hirsch LJ, LaRoche SM, Gaspard N, et al. American Clinical Neurophysiology Society’s standardized critical care EEG terminology: 2012 version. J Clin Neurophysiol 2013;30:1–27. [DOI] [PubMed] [Google Scholar]
- 27. Friedman J, Hastie T, Tibshirani R. The elements of statistical learning, 2nd ed New York: Springer, 2009. [Google Scholar]
- 28. Team RDCR . A language and environment for statistical computing. Vienna, Austria: R‐Foundation for Statistical Computing. [Google Scholar]
- 29. Chollet F. Deep Learning with R [Internet]. Sl: Manning Publications; 2018. Available from: https://proquest.safaribooksonline.com/9781617295546. [Google Scholar]
- 30. Friedman J, Hastie T, Tibshirani R, et al. Package “glmnet” [Internet]. CRAN; 2018. Available from: http://www.jstatsoft.org/v33/i01/.
- 31. Rodriguez Ruiz A, Vlachy J, Lee JW, et al. Association of periodic and rhythmic electroencephalographic patterns with seizures in critically Ill patients. JAMA Neurol [Internet]. 2017;74(2):181–188. [DOI] [PubMed] [Google Scholar]
- 32. Srivastava N, Hinton G, Krizhevsky A, et al. Dropout: a simple way to prevent neural networks from overfitting. J Mach Learn Res 2014;15:1929–1958. [Google Scholar]
- 33. Young B, Rapp RP, Norton JA, et al. Failure of prophylactically administered phenytoin to prevent early posttraumatic seizures. J Neurosurg 1983;58:231–235. [DOI] [PubMed] [Google Scholar]
- 34. Panczykowski D, Pease M, Zhao Y, et al. Prophylactic antiepileptics and seizure incidence following subarachnoid hemorrhage: a propensity score‐matched analysis. Stroke 2016;47:1754–1760. [DOI] [PMC free article] [PubMed] [Google Scholar]
- 35. Naidech AM, Kreiter KT, Janjua N, et al. Phenytoin exposure is associated with functional and cognitive disability after subarachnoid hemorrhage. Stroke 2005;36:583–587. [DOI] [PubMed] [Google Scholar]
- 36. Temkin NR, Dikmen SS, Wilensky AJ, et al. A randomized, double‐blind study of phenytoin for the prevention of post‐traumatic seizures. N Engl J Med 1990;323:497–502. [DOI] [PubMed] [Google Scholar]
Associated Data
This section collects any data citations, data availability statements, or supplementary materials included in this article.
Supplementary Materials
Figure S1. Architecture of the deep‐learning model, “elu” exponential linear unit, sigmoid is sigmoid function. Dense is a densely connected layer.
Table S1. List of seizure risk factors and associated coefficients in the final optimized Elastic‐Net Logistic Regression model, alpha = 0 (rigid regression), lambda = 0.016.