

Abstract
Blood lipids have major cardiovascular and public health implications. Lipid‐lowering drugs are prescribed based in part on categorization of patients into normal or abnormal lipid metabolism, yet relatively little emphasis has been placed on: (1) the accuracy of current lipid measures used in clinical practice, (2) the reliability of current categorizations of dyslipidemia states, and (3) the relationship of advanced lipid characterization to other cardiovascular disease biomarkers. To these ends, we developed the Very Large Database of Lipids (NCT01698489), an ongoing database protocol that harnesses deidentified data from the daily operations of a commercial lipid laboratory. The database includes individuals who were referred for clinical purposes for a Vertical Auto Profile (Atherotech Inc., Birmingham, AL), which directly measures cholesterol concentrations of low‐density lipoprotein, very low‐density lipoprotein, intermediate‐density lipoprotein, high‐density lipoprotein, their subclasses, and lipoprotein(a). Individual Very Large Database of Lipids studies, ranging from studies of measurement accuracy, to dyslipidemia categorization, to biomarker associations, to characterization of rare lipid disorders, are investigator‐initiated and utilize peer‐reviewed statistical analysis plans to address a priori hypotheses/aims. In the first database harvest (Very Large Database of Lipids 1.0) from 2009 to 2011, there were 1 340 614 adult and 10 294 pediatric patients; the adult sample had a median age of 59 years (interquartile range, 49–70 years) with even representation by sex. Lipid distributions closely matched those from the population‐representative National Health and Nutrition Examination Survey. The second harvest of the database (Very Large Database of Lipids 2.0) is underway. Overall, the Very Large Database of Lipids database provides an opportunity for collaboration and new knowledge generation through careful examination of granular lipid data on a large scale.
Introduction
Blood lipids have major cardiovascular and public health implications. Despite a century of progress since Anitschkow's classic experiments,1 coronary heart disease (CHD) is projected to remain the leading cause of death worldwide through at least 2020.2 Approximately 56% of modern CHD is attributable to abnormal blood lipids according to the World Health Organization3 and the INTERHEART study spanning every inhabited continent.4
Lifestyle changes are paramount in combating the negative global impact of dyslipidemia in combination with therapeutic drug options.5, 6, 7, 8, 9 Statins, in particular, have a strong evidence base,10 and in association with growing use, favorable trends in lipid levels have occurred.11 The societal benefit attributable to statin utilization in the United States from 1987 to 2008 was estimated on the order of $1 trillion.12 Generic availability of intensive statin therapy promises to bring even greater societal benefit in the United States and overseas.
Although statins are generally the drug of choice for dyslipidemia, a number of other agents are also widely used, and more are on the horizon. Existing pharmacotherapies beyond statins include bile acid sequestrants, niacin, fibrates, ezetimibe, and omega‐3 polyunsaturated fatty acids. Among novel agents, though outcomes studies with cholesterol ester transfer protein (CETP) inhibitors have been disappointing,13, 14 other agents have found a niche. Apolipoprotein B synthesis inhibition15, 16 and microsomal triglyceride transfer protein inhibition17 have gained US Food and Drug Administration approval for homozygous familial hypercholesterolemia. The proprotein convertase subtilisin/kexin type 9 inhibitors are injectable agents with an attractive mechanism of action (inhibition of low‐density lipoprotein [LDL] receptor degradation) and promising results in phase 2 clinical trials.18, 19, 20, 21
Lipid‐lowering medications are prescribed based in part on categorization of patients into normal or abnormal lipid metabolism. For population‐based treatment purposes, worldwide guidelines5, 6, 7, 8, 9 predominantly categorize patients according to low‐density lipoprotein cholesterol (LDL‐C) levels, estimated by the Friedewald equation.22 However, there is great interest in further refining categorizations of abnormal lipid metabolism.23, 24 Although levels of high‐density lipoprotein cholesterol (HDL‐C) and triglycerides (TG) are most commonly used for assessment beyond LDL‐C, even more granularity to lipid characterization is possible by using multiple complementary methods.
One established method is the Vertical Auto Profile (VAP) (Atherotech, Inc., Birmingham, AL), which directly measures cholesterol concentrations in LDL, very low‐density lipoprotein, intermediate‐density lipoprotein, high‐density lipoprotein (HDL), their subclasses, and lipoprotein(a) (Lp[a]).25 Closer examination of granular lipid data in a large population offers numerous opportunities to generate new knowledge, ranging from studies examining concordance between commonly used lipid parameters to phenotypic characterization of rare or extreme disorders of lipid metabolism, opening possibilities for better personalizing future treatment of abnormal blood lipids.
Methods
Objectives and Leadership
The overall purpose of the Very Large Database of Lipids (VLDL) is to derive important scientific and clinical information through careful examination of a large pool of detailed lipid profiles. The VLDL is an investigator‐initiated database conceived by our group at the Ciccarone Center for Prevention of Heart Disease and made possible through collaboration with Atherotech Diagnostic Laboratory. A key objective is to foster strong professional teamwork between the academic and private sectors, with open and transparent information sharing. Aimed at promoting a consistent level of scientific rigor across VLDL studies, we have formed a Publications and Presentations Committee.
Testing of Lipids and Other Analytes
A detailed description of the VAP procedure is provided in the online Appendix. As opposed to sequential flotation methods using swinging bucket rotors to separate lipoproteins over days along the longer (horizontal) axis of the centrifuge tube, the VAP test separates lipoproteins in <60 minutes along the shorter (vertical) axis by single vertical spin, density gradient ultracentrifugation. Continuous flow analysis of the cholesterol concentrations of lipoprotein fractions is then performed.
TG in the VLDL database are directly measured using the Abbott ARCHITECT C‐8000 system (Abbott Laboratories, Abbott Park, IL). Other analytes measured by validated assays in subsets of the VLDL database are shown in the online Appendix, Table A1. In the year spanning November 1, 2011 to October 31, 2012, >7 million analytes were quantified at Atherotech.
Procedures
The Atherotech Diagnostics Laboratory maintains raw data, whereas only deidentified data are delivered to the investigational academic site for research use. Deidentification fulfills the Safe Harbor privacy rule of the Health Insurance Portability and Accountability Act (HIPAA). Therefore, the Johns Hopkins Institutional Review Board has declared VLDL research exempt.
Figure 1 illustrates data flow in the first harvest of the VLDL database (VLDL 1.0). Upon receipt of aggregate deidentified data, the academic investigators performed a screen in which patients were removed if (1) core lipid measures (total cholesterol [TC], TG, HDL‐C, LDL‐C) were missing or (2) range and logic checks were not satisfied. This screen ensured a standard set of core data and internal consistency. The <0.001% samples removed by this process attests to the high quality of data supplied by Atherotech Diagnostics Laboratory. In the planned second harvest of the VLDL database (VLDL), screening will occur at Atherotech. The master database is housed at The Johns Hopkins Hospital in Baltimore, Maryland. Only deidentified electronic data, not biological specimens, are sent to Hopkins.
Figure 1.
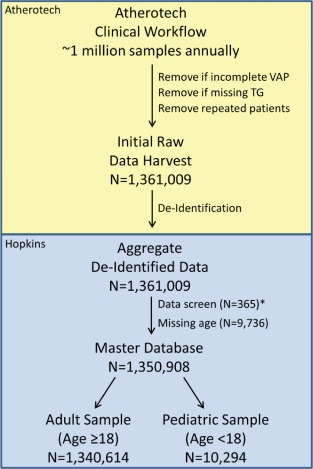
Very Large Database of Lipids Version 1.0 information and patient flow. Illustration of the flow of information from Atherotech Diagnostics Laboratory (Birmingham, Alabama) to Johns Hopkins University (Baltimore, Maryland) and delineation of the patients included in the initial raw data harvest, the master database, adult database, and pediatric database. *Removed if (1) core lipid measures (total cholesterol, triglycerides [TG], high‐density lipoprotein cholesterol, low‐density lipoprotein cholesterol) are missing or (2) range and logic checks are not satisfied. Abbreviations: VAP, Vertical Auto Profile.
Analyses are investigator initiated. The academic investigators using the VLDL have unrestricted access to data and conduct analyses independently. The investigators have authority over manuscript preparation and the decision to submit manuscripts for publication. Atherotech has not provided any payments for the analyses or preparation of manuscripts.
VLDL Population
VLDL 1.0 contained 1 361 009 consecutive, unique individuals who underwent a VAP test between 2009 and 2011 for clinical purposes. Testing was ordered by thousands of clinicians across a wide variety of clinical facilities in the United States. The majority of samples (approximately 85%) originated at primary care clinics, whereas the remaining samples originated at specialized clinics such as lipid clinics, as well as from inpatients at both university‐based and private hospitals. Approximately 30% were enrolled in a Medicare health plan and ∼60% were enrolled in a private sector health insurance plan.
A small fraction of samples were excluded by data screening or because they were missing age information, yielding 1 350 908 samples in VLDL 1.0, of which 1 340 614 are from adults and 10 294 are from pediatric patients (Figure 1). Characteristics of the adult and pediatric samples are shown in Table 1. The median age is 59 years (interquartile range [IQR], 49–70 years; full range, 18–112 years) in the adult sample and 14 (IQR, 11–16 years; full range, <1–17 years) in the pediatric sample. Both samples are approximately evenly distributed by sex with <1% missing sex data.
Table 1.
VLDL Characteristics in Adult and Pediatric Samples
| Adult Sample, n = 1 340 614 | Pediatric Sample, n = 10 294 | |
|---|---|---|
| Testing year | ||
| 2009 | 461 561 (34.4%) | 3347 (32.5%) |
| 2010 | 540 810 (40.4%) | 4294 (41.7%) |
| 2011 | 338 243 (25.2%) | 2653 (25.8%) |
| Age, y | 59 (49 to 70) [33 to 84] | 14 (11 to 16) [4 to 17] |
| Sex | ||
| Men | 692 752 (51.7%) | 5169 (50.2%) |
| Women | 640 102 (47.7%) | 5060 (49.2%) |
| Missing | 7760 (0.6%) | 65 (0.6%) |
| TC | 188 (159 to 220) [124 to 270] | 167 (145 to 191) [119 to 245] |
| HDL‐C | 52 (42 to 63) [32 to 86] | 50 (42 to 59) [33 to 74] |
| TG | 115 (82 to 166) [54 to 305] | 95 (67 to 140) [44 to 264] |
| TG ≥400 mg/dL | 30,174 (2.3%) | 144 (1.4%) |
| Friedewald estimated LDL‐C* | 106 (82 to 134) [54 to 177] | 93 (75 to 114) [53 to 160] |
| Directly measured LDL‐C | 108 (85 to 135) [58 to 178] | 94 (77 to 115) [55 to 162] |
| LDLr‐C | 88 (66 to 113) [41 to 151] | 78 (62 to 97) [42 to 138] |
| Non–HDL‐C | 133 (106 to 163) [76 to 212] | 115 (95 to 139) [71 to 191] |
| LDL pattern | ||
| A (large, buoyant) | 640 735 (47.8%) | 6581 (63.9%) |
| A/B (intermediate) | 265 055 (19.8%) | 1693 (16.5%) |
| B (small, dense) | 434 823 (32.4%) | 2020 (19.6%) |
| TC/HDL‐C | 3.5 (2.9 to 4.4) [2.2 to 6.1] | 3.3 (2.8 to 4.0) [2.2 to 5.7] |
| TG/HDL‐C | 2.2 (1.4 to 3.7) [0.7 to 8.1] | 1.9 (1.2 to 3.1) [0.7 to 7.0] |
| TG/TC | 0.6 (0.4 to 0.9) [0.3 to 1.6] | 0.6 (0.4 to 0.8) [0.3 to 1.5] |
| Lp(a)‐C | 6 (4 to 10) [2 to 18] | 6 (4 to 9) [3 to 17] |
| IDL‐C | 12 (8 to 16) [5 to 26] | 8 (6 to 12) [4 to 20] |
| VLDL‐C | 22 (17 to 29) [13 to 47] | 19 (16 to 25) [12 to 38] |
| LDL1‐C | 13 (8 to 18) [4 to 28] | 10 (6 to 15) [3 to 24] |
| LDL2‐C | 16 (8 to 28) [1 to 48] | 20 (12 to 29) [3 to 46] |
| LDL3‐C | 41 (29 to 56) [16 to 79] | 37 (27 to 49) [15 to 71] |
| LDL4‐C | 12 (7 to 19) [2 to 35] | 9 (5 to 13) [1 to 25] |
| HDL2‐C | 12 (9 to 17) [6 to 27] | 12 (9 to 16) [6 to 23] |
| HDL3‐C | 39 (33 to 47) [26 to 60] | 37 (32 to 43) [26 to 53] |
| VLDL1+2‐C | 9 (7 to 13) [5 to 24] | 8 (6 to 11) [5 to 20] |
| VLDL3‐C | 13 (10 to 16) [8 to 23] | 11 (9 to 13) [8 to 19] |
Abbreviations: HDL‐C, high‐density lipoprotein cholesterol; IDL‐C, intermediate‐density lipoprotein cholesterol; LDL pattern, low‐density lipoprotein modal density pattern; LDL‐Cd, directly measured low‐density lipoprotein cholesterol per traditional definition; LDLr‐C, directly measured low‐density lipoprotein real cholesterol; Lp(a)‐C, lipoprotein(a) cholesterol; non–HDL‐C, non–high‐density lipoprotein cholesterol; RLP, remnant lipoprotein cholesterol (IDL‐C + VLDL3‐C); TC, total cholesterol; TG, triglycerides; VLDL‐C, very low‐density lipoprotein cholesterol.
Lipid parameters, other than ratios, are reported in mg/dL. Median (25th to 75th percentile) and [5th to 95th percentile] presented for continuous variables. No. (%) presented for categorical variables.
*Reported in those with triglycerides <400 mg/dL; bottom limit set at 0.
Population density distributions of TC, HDL‐C, TG, Friedewald LDL‐C,23 non–HDL‐C, and the TC to HDL‐C ratio (Figure 2) are nearly identical as shown by superimposable curves of lipid distributions from adults in the VLDL database and population‐representative National Health and Nutrition Examination Survey (NHANES) 2007 to 2008. In VLDL adults, the median directly measured LDL‐C is 108 mg/dL (2.79 mmol/L) and IQR 85 to 135 mg/dL (2.20–3.49 mmol/L). Median non–HDL‐C is 133 mg/dL (3.44 mmol/L) and IQR 106 to 163 mg/dL (2.74–4.22 mmol/L). These values in adults are somewhat higher compared with the pediatric sample. Details on distributions for each lipid parameter are provided in Table 1.
Figure 2.
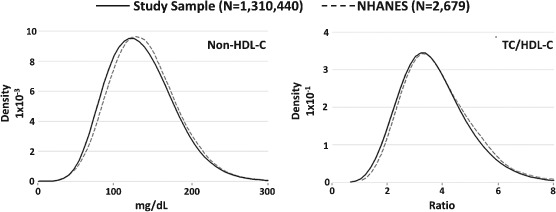
Lipid distributions in adult samples of the Very Large Database of Lipids and National Health and Nutrition Examination Survey (NHANES). Kernel density plots of non–high‐density lipoprotein cholesterol (HDL‐C) and total cholesterol (TC)/HDL‐C in the study sample (Very Large Database of Lipids 2009–2011) and the NHANES 2007–2008.
Although the lipid profile of the average patient in the VLDL sample is typical of the general population, a considerable number of patients with rare phenotypes exist within the sample. For example, there are 15 pure type I hyperchylomicronemic subjects in the VLDL database based on a ratio of TG to TC >9 (a phenotype estimated to occur at a frequency of approximately 10−6 in the general population). The type V dyslipidemia phenotype, characterized by hyperchylomicronemia in addition to very low‐density lipoprotein cholesterol excess (defined as very low‐density lipoprotein cholesterol >95th percentile), occurs in 588 subjects. Of the more common non‐hyperchylomicronemic dyslipidemia phenotypes, we estimate that there are 25 119 type IIb, 1391 type III, and 117 642 type IV subjects.
Current Variables
The variables currently in the VLDL are year of VAP testing, age, sex, VAP lipid profile (as detailed in Table 1), and other analytes (online Appendix, Table A1). From these primary variables, many additional variables are derived for inclusion in the master database to facilitate the efficiency and uniformity of future studies. Key derived variables at the present time include cholesterol ratios (eg, TC/HDL‐C, TG/HDL‐C), estimated cholesterol parameters (eg, Friedewald estimated LDL‐C), absolute differences in cholesterol parameters (eg, Friedewald estimated minus directly measured LDL‐C), population percentiles of cholesterol parameters, guideline classifications of cholesterol parameters (based exclusively on the cholesterol profile [eg, LDL‐C <70, 70–99, 100–129 mg/dL]), and dyslipidemia classifications (eg, Fredrickson‐Levy dyslipidemia classes, I, IIa, IIb, IV, V, and rare hyperchylomicronemia phenotypes).
Registration and Statistical Analysis Plans
The VLDL database is registered on clinicaltrials.gov (NCT01698489). VLDL investigators will periodically register individual studies on clinicaltrials.gov. Existing VLDL studies are shown in the online Appendix, Table A2. Individual VLDL studies utilize peer‐reviewed statistical analysis plans (SAPs) to address a priori hypotheses/aims. The study proposal form is included in the online Appendix.
SAPs will follow a quantitative and stepwise manner. SAPs may be descriptive to characterize the prevalence of a given lipid abnormality or patterns of lipid abnormalities. They may examine the association between certain lipid parameters. SAPs might focus on discordance between population percentiles of lipid parameters or investigate classification by 1 lipid parameter vs others (eg, Friedewald LDL‐C vs direct LDL‐C or non–HDL‐C) based on guideline‐established cut‐points. SAPs may register additional exclusions to meet the needs of individual studies. For example, our founding study (VLDL‐1)26 focused on Friedewald estimation of LDL‐C and therefore excluded those with TG ≥400 mg/dL (4.52 mmol/L), consistent with the specifications of the Friedewald equation.22
Expressing the Density of Data in a Large Database
In working with a database of over 1 million records, we found that in expressing the density of data with simple dot plots, the dots blended together such that the density of data could not be appreciated (even with a very small dot size). After investigating alternatives, we found that R version 2.14.1 (R Foundation for Statistical Computing, Vienna, Austria) offered a powerful graphics package (IDPmisc package) for generating pseudocolor encoded data density gradient plots or “heat plots.” In these plots (see example in the online Appendix, Figure A1), the density of data is expressed by different shades of color, which represent increasing densities of patients per pixel, from light blue to purple. The patients are expressed in log2 patients per pixel (ie, 2, 4, 8, 16, 32, 64, 128, and so on); increments represent the maximum number of points in each category.
VLDL 2.0 and Prospective Database Organization
Harvesting of the VLDL 2.0 database is underway. Thus far, an updated database suited to assess seasonal variation has been established with 2 859 333 unique samples dating back to 2006. VLDL 2.0 will add International Classification of Disease code diagnoses submitted with test requisition as well as prandial status (fasting vs nonfasting) at the time of sample acquisition. We will also add mortality information via linkage to the Social Security Death Index.
As we complete harvest 2, we plan to organize information into a Summation Dataset, 3‐Year Interval Datasets, Serial Lab Dataset, and Ancillary Datasets to fit specific purposes (Table 2). By the convention established in our first study, the Summation Dataset (VLDL) will include the first VAP test for each patient and thus will include all unique patients. Similar to NHANES, 3‐Year Interval Datasets will be named with the year span after VLDL: VLDL 2006 to 2008, VLDL 2009 to 2011, VLDL 2012 to 2015, and so on. The Serial Dataset (VLDL‐S) will capture a nested group of patients with repeated testing. Finally, Ancillary Datasets will consist of multiple nested groups of patients with additional analytes beyond the VAP test (eg, apolipoprotein B, vitamin D, high‐sensitivity C‐reactive protein, thyroid‐stimulating hormone/thyroxine).
Table 2.
VLDL Database Structure
| Naming | Included | Primary Purpose | |
|---|---|---|---|
| Summation dataset | VLDL | First VAP test for each patient | Large‐scale analyses; examination of rare or extreme phenotypes |
| 3‐year interval dataset | VLDL 2006–2008, VLDL 2009–2011, VLDL 2012–2014, and so on | First VAP test for each patient in 3‐year intervals | Large‐scale contemporary data analysis; secular trend assessment |
| Serial lab dataset | VLDL‐S | All VAP tests for patients with repeated testing | Reproducibility of measurements; associations of changes in parameters |
| Ancillary datasets | VLDL‐XXXX where XXXX is the other non‐VAP analyte (eg, VLDL‐ApoB, VLDL‐VitD, VLDL‐hsCRP) | Samples with VAP plus another relevant analyte; nested within summation dataset | Assessment of association of VAP test parameters with other analytes |
Abbreviations: ApoB, apolipoprotein B; hsCRP, high‐sensitivity C‐reactive protein; VAP, Vertical Auto Profile; VitD, vitamin D; VLDL, Very Large Database of Lipids.
Discussion
Herein, we describe the rationale and design of the investigator‐initiated VLDL database. It leverages an academic relationship with industry to enable science at cost substantially less than primary data collection, and science that may be otherwise unachievable using traditional, independent, third party‐funded mechanisms. Studies using the VLDL database promise to complement other avenues of research to generate meaningful scientific and clinical information through examination of granular lipid information.
A Cost‐Efficient and Well‐Integrated Research Paradigm
Modern cardiovascular epidemiology is too costly and too far removed from everyday clinical practice. In this context, the National Heart Lung and Blood Institute is encouraging innovative ways of efficiently using existing clinical data, including that available in the electronic health records or from “big data,” to leverage the power of epidemiologic observation from everyday practice.27 The VLDL database takes advantage of existing information from the routine daily operations of a commercial laboratory to provide an important source of rapidly available, real‐world data. All age groups are represented in the database, including children, wherein universal cholesterol screening is now recommended.28 As clinical laboratory data feed into research studies, and new knowledge is generated, this can then feed directly back into the way the laboratory data are reported to clinicians and impact patient care in a timely fashion. In this way, the VLDL database represents efficient integration of the clinical sphere with the research sphere.
Another extension of the hypothesis generation‐testing cycle may also evolve from the industrial–academic collaboration that has enabled the development of the VLDL database. We aim to identify testable hypotheses that can be investigated through prospective data gathering using the clinical laboratory routine sample stream. For example, if a particular phenotype of interest is identified in the VLDL database, these phenotypes would be discovered in the daily throughput of the clinical laboratory by use of novel software‐based triggers. Serum would be saved for further characterization of the specimen in the conventional clinical laboratory setting or in the research laboratory setting. The volume of testing at Atherotech (∼1 million specimens accessioned annually) would support rapid accrual of a useful number of subjects' serum for study even if the phenotype were rare.
Synergy With Complementary Lines of Research in New Knowledge Generation
New knowledge generation from studies using the VLDL promises to synergize with complementary lines of research (Figure 3). Prospective cohort studies can generate knowledge about how these lipid parameters are associated with future cardiovascular outcomes, whereas randomized clinical trials can generate knowledge about how altering the lipid parameters with pharmaceuticals impacts clinical outcomes. We anticipate that the distinctive knowledge generated from the VLDL database, focused on detailing the lipid information itself, will interact with and merge in novel ways with knowledge generated from complementary lines of research.
Figure 3.
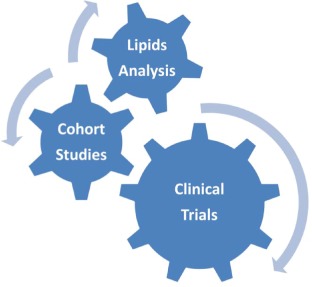
Synergy of the Very Large Database of Lipids study with complementary lines of research. Illustration of potential synergy in new information generation from lipids analysis, cohort studies, and clinical trials. The aggregate impact on patient care is the result of modification of each avenue of research by the other and their integration.
For example, some apparent discrepancies between prospective cohort studies in the association of lipid parameters with outcomes29 or the failure of major randomized clinical trials of drug therapies13, 14, 30 may be explained in part by greater complexities in the lipid profile than were initially appreciated. LDL and HDL particles are both heterogeneous in density. LDL‐C is also commonly estimated, not directly measured, and does not account for some atherogenic lipoprotein fractions. On the antiatherogenic side of the lipid profile, it is increasingly clear that measuring HDL‐C inadequately captures the full complexity of HDL functionality, including in reverse cholesterol transport, monocyte chemotaxis, endothelial inflammation, oxidation, nitric oxide production, and thrombosis.
The failure of randomized clinical trials of drug therapies indexed to HDL‐C raising may be explained in part by heterogeneity of HDL particles. Armed with subclass data on LDL and HDL particles, and all lipoprotein particles, the VLDL database could produce new knowledge to help understand controversial findings in prior studies and better inform future cohort studies and clinical trials.
Prior Examples of Collaboration With Commercial Laboratories
The paradigm of using data from a large clinical laboratory to derive clinically meaningful information exists. The impact of 25‐hydroxyvitamin D (25[OH]D) levels on lipids is 1 example. 25(OH)D deficiency is prevalent and associated with dyslipidemia and cardiovascular disease.31 However, causality was previously uncertain, with existing randomized clinical trials providing conflicting results in the setting of small sample sizes and confounding factors. Therefore, investigators used a very large (N = 107 811) sample of cross‐sectional and serial deidentified data from Quest Diagnostics in the United States to examine the relationship between 25(OH)D levels and lipids.32 Results were not compatible with a direct impact of interval changes in 25(OH)D on the lipid profile. A subsequent randomized clinical trial confirmed that correcting 25(OH)D deficiency with oral supplementation did not improve the lipid profile.32
Therefore, leveraging information from a very large clinical laboratory database quickly and inexpensively predicted the randomized clinical trial result and arguably provided important information to clinicians upon which to base treatment decisions in the meantime. Importantly, this particular result from the Quest database was best assessed using serial laboratory data. This point, along with studies showing the value of past compared to current lipid measurements,33 emphasizes the importance of the ongoing effort in harvest 2 of the VLDL database to capture serial information. Generation of knowledge from serial data may fill an important research gap.
Current Limitations
Key present limitations of the VLDL database are the lack of data on prandial status, diagnoses, serial labs, and patient outcomes. Although VLDL 2.0 will address these limitations, immediate use of the VLDL database is limited to questions centered on interrelationships between lipoprotein cholesterol parameters or descriptions of biochemical phenotypes. Regarding the generalizability of results, there is the possibility of referral bias in patients who undergo a VAP test. Nevertheless, population distributions of lipid parameters in the VLDL database are essentially superimposable on those from NHANES, a nationally representative, population‐based cohort. This fits with the origin of the majority of samples (approximately 85%) at primary care clinics.
Another important limitation of the VLDL database is the lack of medication information. To address this moving forward, we plan to capture medication information in several ways. First, on the VAP test order sheet, we are adding check boxes for current statin use and other current lipid‐modifying medication use, as well as an area to write in specific drug names and doses. Second, we are reaching out to major insurers to explore the possibility of pinning their medication data to the VLDL database. Third, in collaboration with large health systems utilizing electronic health records, we aim to link in with medication information as well as detailed clinical information, similar to existing multi‐institutional cohorts linking biospecimens with electronic health records.34
Conclusion
We herein describe the rationale and design of the VLDL database to increase transparency so that editors, reviewers, and readers can better monitor adherence to the database protocol as individual studies using the database are presented. The VLDL database is a national resource that promises exciting opportunities for collaboration and new knowledge generation through careful examination of granular lipid data. We anticipate that this new knowledge will synergize with complementary lines of research to better inform patient care.
Supporting information
Appendix S1. Detailed description of the VAP procedure
This work was supported by Atherotech, Inc.; the lab provided the investigators with deidentified data generated from commercial lipid analyses. Atherotech, Inc. did not provide payments to the investigators for the development of the database or writing of this article.
Drs. Martin and Jones had unrestricted access to the database, take responsibility for the accuracy of analyses, and had authority over manuscript preparation and the decision to submit the manuscript for publication.
Drs. Martin, McEvoy, and Joshi are supported by the Pollin Fellowship in Preventive Cardiology. In addition, Dr. Martin is supported by the Marie‐Josée and Henry R. Kravis endowed fellowship.
Disclosures for Drs. Toth, Kwiterovich, Dr. Kulkarni, Dr. Chimera, Dr. Cannon, and Dr. Jones are as follows: Dr. Toth: medical advisory board for Atherotech, Inc.; compensation for consultancy and lecturers from Abbott Laboratories, Aegerion, Amgen, Amylin, AstraZeneca, GlaxoSmithKline, Kowa, and Merck & Co. Dr. Kwiterovich: compensation for consultancy from Merck & Co. and research grants from Pfizer. Dr. Kulkarni: Research Director, Atherotech, Inc.; receives royalty from the University of Alabama in Birmingham. Dr. Chimera: Executive Vice President of Scientific Development, Atherotech, Inc. Dr. Cannon: member of the advisory boards of and has received grant support from Ainylam, Bristol‐Myers Squibb, and Pfizer; has received grant support from Accumetrics, AstraZeneca, Essentialis, GlaxoSmithKline, Merck, Regeneron, Sanofi, and Takeda; and is a clinical advisor to Automated Medical Systems. Dr. Jones: medical advisory board for Atherotech, Inc.
The authors have no other funding, financial relationships, or conflicts of interest to disclose.
References
- 1. Finking G, Hanke H. Nikolaj Nikolajewitsch Anitschkow (1885–1964) established the cholesterol‐fed rabbit as a model for atherosclerosis research. Atherosclerosis. 1997;135:1–7. [DOI] [PubMed] [Google Scholar]
- 2. Lopez AD, Murray CC. The global burden of disease, 1990–2020. Nat Med. 1998;4:1241–1243. [DOI] [PubMed] [Google Scholar]
- 3. World Health Organization . The World Health Report 2002: reducing risks, promoting healthy life. Geneva, Switzerland. http://www.who.int/whr/2002/en/whr02_en.pdf. Accessed July 3, 2013.
- 4. McQueen MJ, Hawken S, Wang X, et al. Lipids, lipoproteins, and apolipoproteins as risk markers of myocardial infarction in 52 countries (the INTERHEART study): a case–control study. Lancet. 2008;372:224–233. [DOI] [PubMed] [Google Scholar]
- 5. Program National Cholesterol Education. Third report of the National Cholesterol Education Program Expert Panel on Detection, Evaluation, and Treatment of High Blood Cholesterol in Adults (Adult Treatment Panel III) final report. Circulation. 2002;106:3143–3421. [PubMed] [Google Scholar]
- 6. Grundy SM, Cleeman JI, Merz CN, et al. Implications of recent clinical trials for the National Cholesterol Education Program Adult Treatment Panel III guidelines. Circulation. 2004;110:227–239. [DOI] [PubMed] [Google Scholar]
- 7. Genest J, McPherson R, Frohlich J, et al. Canadian Cardiovascular Society/Canadian guidelines for the diagnosis and treatment of dyslipidemia and prevention of cardiovascular disease in the adult—2009 recommendations. Can J Cardiol. 2009;25:567–579. [DOI] [PMC free article] [PubMed] [Google Scholar]
- 8. Catapano AL, Reiner Z, De Backer G, et al. ESC/EAS Guidelines for the management of dyslipidaemias: the Task Force for the Management of Dyslipidaemias of the European Society of Cardiology (ESC) and the European Atherosclerosis Society (EAS). Eur Heart J. 2011;32:1769–1818. [DOI] [PubMed] [Google Scholar]
- 9. Smith SC, Benjamin EJ, Bonow RO, et al. AHA/ACCF Secondary Prevention and Risk Reduction Therapy for Patients with Coronary and other Atherosclerotic Vascular Disease: 2011 update: a guideline from the American Heart Association and American College of Cardiology Foundation. Circulation. 2011;124:2458–2473. [DOI] [PubMed] [Google Scholar]
- 10. Chrispin J, Martin SS, Hasan RK, et al. Landmark lipid‐lowering trials in the primary prevention of cardiovascular disease [published online ahead of print May 30, 2013]. Clin Cardiol. doi: 10.1002/clc.22147. [DOI] [PMC free article] [PubMed]
- 11. Carroll MD, Kit BK, Lacher DA, et al. Trends in lipids and lipoproteins in US adults, 1988–2010. JAMA. 2012;308:1545–1554. [DOI] [PubMed] [Google Scholar]
- 12. Grabowski DC, Lakdawalla DN, Goldman DP, et al. The large social value resulting from use of statins warrants steps to improve adherence and broaden treatment. Health Aff (Millwood). 2012;31:2276–2285. [DOI] [PubMed] [Google Scholar]
- 13. Barter PJ, Caulfield M, Eriksson M, et al. Effects of torcetrapib in patients at high risk for coronary events. N Engl J Med. 2007;357:2109–2122. [DOI] [PubMed] [Google Scholar]
- 14. Schwartz GG, Olsson AG, Abt M, et al. Effects of dalcetrapib in patients with a recent acute coronary syndrome. N Engl J Med. 2012;367:2089–2099. [DOI] [PubMed] [Google Scholar]
- 15. Raal FJ, Santos RD, Blom DJ, et al. Mipomersen, an apolipoprotein B synthesis inhibitor, for lowering of LDL cholesterol concentrations in patients with homozygous familial hypercholesterolaemia: a randomised, double‐blind, placebo‐controlled trial. Lancet. 2010;375:998–1006. [DOI] [PubMed] [Google Scholar]
- 16. Stein EA, Dufour R, Gagne C, et al. Apolipoprotein B synthesis inhibition with mipomersen in heterozygous familial hypercholesterolemia: results of a randomized, double‐blind, placebo‐controlled trial to assess efficacy and safety as add‐on therapy in patients with coronary artery disease. Circulation. 2012;126:2283–2292. [DOI] [PubMed] [Google Scholar]
- 17. Cuchel M, Meagher EA, du Toit Theron H, et al. Efficacy and safety of a microsomal triglyceride transfer protein inhibitor in patients with homozygous familial hypercholesterolaemia: a single‐arm, open‐label, phase 3 study. Lancet. 2013;381:40–46. [DOI] [PMC free article] [PubMed] [Google Scholar]
- 18. Roth EM, McKenney JM, Hanotin C, et al. Atorvastatin with or without an antibody to PCSK9 in primary hypercholesterolemia. N Engl J Med. 2012;367:1891–1900. [DOI] [PubMed] [Google Scholar]
- 19. Raal F, Scott R, Somaratne R, et al. Low‐density lipoprotein cholesterol‐lowering effects of AMG 145, a monoclonal antibody to proprotein convertase subtilisin/kexin type 9 serine protease in patients with heterozygous familial hypercholesterolemia: the Reduction of LDL‐C With PCSK9 Inhibition in Heterozygous Familial Hypercholesterolemia Disorder (RUTHERFORD) Randomized Trial. Circulation. 2012;126:2408–2417. [DOI] [PubMed] [Google Scholar]
- 20. Kohli P, Desai NR, Giugliano RP, et al. Design and rationale of the LAPLACE‐TIMI 57 trial: a phase II, double‐blind, placebo‐controlled study of the efficacy and tolerability of a monoclonal antibody inhibitor of PCSK9 in subjects with hypercholesterolemia on background statin therapy. Clin Cardiol. 2012;35:385–391. [DOI] [PMC free article] [PubMed] [Google Scholar]
- 21. Giugliano RP, Desai NR, Kohli P, et al. Efficacy, safety, and tolerability of a monoclonal antibody to proprotein convertase subtilisin/kexin type 9 in combination with a statin in patients with hypercholesterolaemia (LAPLACE‐TIMI 57): a randomised, placebo‐controlled, dose‐ranging, phase 2 study. Lancet. 2012;380:2007–2017. [DOI] [PMC free article] [PubMed] [Google Scholar]
- 22. Friedewald WT, Levy RI, Fredrickson DS. Estimation of the concentration of low‐density lipoprotein cholesterol in plasma, without use of the preparative ultracentrifuge. Clin Chem. 1972;18:499–502. [PubMed] [Google Scholar]
- 23. Brook RD, Kansal M, Bard RL, et al. Usefulness of low‐density lipoprotein particle size measurement in cardiovascular disease prevention. Clin Cardiol. 2005;28:534–537. [DOI] [PMC free article] [PubMed] [Google Scholar]
- 24. Mudd JO, Borlaug BA, Johnston PV, et al. Beyond low‐density lipoprotein cholesterol: defining the role of low‐density lipoprotein heterogeneity in coronary artery disease. J Am Coll Cardiol. 2007;50:1735–1741. [DOI] [PubMed] [Google Scholar]
- 25. Kulkarni KR. Cholesterol profile measurement by vertical auto profile method. Clin Lab Med. 2006;26:787–802. [DOI] [PubMed] [Google Scholar]
- 26. Martin SS, Blaha MJ, Elshazly MB, et al. Friedewald estimated versus directly measured low‐density lipoprotein cholesterol and treatment implications. J Am Coll Cardiol. 2013;62:732–739. [DOI] [PubMed] [Google Scholar]
- 27. Lauer MS. Time for a creative transformation of epidemiology in the United States. JAMA. 2012;308:1804–1805. [DOI] [PubMed] [Google Scholar]
- 28. Kwiterovich PO, Gidding SS. Universal screening of cholesterol in children. Clin Cardiol. 2012;35:662–664. [DOI] [PMC free article] [PubMed] [Google Scholar]
- 29. Barter PJ, Ballantyne CM, Carmena R, et al. Apo B versus cholesterol in estimating cardiovascular risk and in guiding therapy: report of the thirty‐person/ten‐country panel. J Intern Med. 2006;259:247–258. [DOI] [PubMed] [Google Scholar]
- 30. Investigators AIM‐HIGH, BodenWE, Probstfield JL, Anderson T, et al. Niacin in patients with low HDL cholesterol levels receiving intensive statin therapy. N Engl J Med. 2011;365:2255–2267. [DOI] [PubMed] [Google Scholar]
- 31. Ponda MP, Huang X, Odeh MA, et al. Vitamin D may not improve lipid levels: a serial clinical laboratory data study. Circulation. 2012;126:270–277. [DOI] [PMC free article] [PubMed] [Google Scholar]
- 32. Ponda MP, Dowd K, Finkielstein D, et al. The short‐term effects of vitamin D repletion on cholesterol: a randomized, placebo‐controlled trial. Arterioscler Thromb Vasc Biol. 2012;32:2510–2515. [DOI] [PMC free article] [PubMed] [Google Scholar]
- 33. Huang Y, Yu X, Millican D, et al. The measurement of lipids currently and 9 years ago—which is more associated with carotid intima‐media thickness? Clin Cardiol. 2012;35:512–517. [DOI] [PMC free article] [PubMed] [Google Scholar]
- 34. Cross DS, McCarty CA, Steinhubl SR, et al. Development of a multi‐institutional cohort to facilitate cardiovascular disease biomarker validation using existing biorepository samples linked to electronic health records [published online ahead of print June 5, 2013]. Clin Cardiol. doi: 10.1002/clc.22146] [DOI] [PMC free article] [PubMed]
Associated Data
This section collects any data citations, data availability statements, or supplementary materials included in this article.
Supplementary Materials
Appendix S1. Detailed description of the VAP procedure