

Abstract
Background
Real‐time (RT) myocardial contrast echocardiography (MCE) is a novel method for the assessment of regional myocardial perfusion. We sought to evaluate the feasibility and diagnostic accuracy of quantitative RT‐MCE in predicting significant coronary stenosis, with reference to quantitative coronary angiography.
Hypothesis
RT‐MCE can identify anatomically significant coronary artery stenosis in selected patients. RT‐MCE is probably an effective method for detection of angiographically significant coronary artery stenosis.
Methods
Thirty‐five patients (mean age, 59.94 ± 10.63 years; 25 males) scheduled for coronary angiography underwent RT‐MCE at rest, and shortly afterward underwent gated single‐photon emission computed tomography (gated‐SPECT). Coronary angiography was performed within 1 week after RT‐MCE in all patients. The observing indexes included the images of RT‐MCE that were analyzed quantitatively from microbubble replenishment curves for myocardial perfusion by using the Q‐Lab software. The sensitivity and specificity of RT‐MCE for quantitative detection of coronary artery disease (CAD) were obtained. The receiver operator characteristic (ROC) curves were used to assess the differences of accuracy in ischemic segments with A, β and A × β respectively. The sensitivity and specificity of gated‐SPECT and RT‐MCE for assessment of CAD were calculated using a 4‐score method.
Results
A total of 513 segments among 595 segments in 35 patients were obtained. The cutoffs for A, β and A × β were 4.58, 0.64, and 2.73, and the sensitivity and specificity of quantitative RT‐MCE for detection of CAD were 86.0%, 80.2%, 88.9%, and 84.1%, 64.6%, 79.9%, respectively. Meanwhile, the sensitivity and specificity of semiquantitative analysis for assessment of CAD were 66.7% and 61.8%. The ROC curve area of A and A × β was 0.91 and 0.90 in the middle segments. The ROC area of A was 0.52 in the base segments. The sensitivity and specificity of gated‐SPECT for assessment of CAD were 84.8% and 82.7%, respectively. The sensitivity of multi‐indexes RT‐MCE increased. The sensitivity was 89.1%, 90.4%, and 96.3% by A + β, A + A × β, and β + A × β.
Conclusions
Quantitative RT‐MCE is an effective method for the detection of coronary artery stenosis. Quantitative RT‐MCE is segmented for assessment to ischemic myocardium. RT‐MCE with multi‐indexes has a valuable application for assessment of CAD surpassing SPECT.
Introduction
Real‐time (RT) myocardial contrast echocardiography (MCE) is a novel method for the evaluation of regional myocardial perfusion.1, 2 Although an intermittent, destructive imaging technique has proven to be the best contrast detection, its clinical application has been quite challenging. The interpretation of MCE imaging has traditionally been visual inspection of videotaped studies, limited by its subjective and qualitative nature. However, recent technologic advances have enabled quantification of contrast replenishment kinetics and the acquisition of digital data.3, 4, 5, 6, 7, 8, 9, 10, 11, 12, 13, 14 Myocardial blood flow (MBF) measurements derived from both intermittent and quantitative RT‐MCE techniques have been reported to correlate well with intracoronary Doppler flow wire measurements in animals and human beings.6, 7, 8, 9, 10, 13
Numerous clinical studies have demonstrated concordance between qualitative or semi‐ quantitative MCE and single‐photon emission computed tomography (SPECT) in the assessment of coronary artery disease (CAD), some also with reference to coronary angiography.14, 15, 16, 17, 18, 19, 20, 21, 22, 23, 24, 25 But there are limited clinical data evaluating quantitative RT‐MCE using coronary angiography as the reference standard. In the current study, we sought to evaluate the feasibility of quantitative RT‐MCE in patients undergoing coronary angiography, and moreover to test whether MCE perfusion parameters could detect significant coronary stenosis in various myocardial segments.
Methods
Study Population
We prospectively enrolled 40 consecutive patients referred to diagnostic coronary angiography because of suspected CAD. The inclusion criteria were age over 18 years, clinically stable condition, and normal resting global and regional left ventricular (LV) function by conventional echocardiography. The exclusion criteria were previous myocardial infarction, history of severe arrhythmia, atrial fibrillation, and additional contraindications to the contrast agent. All of the patients gave their written informed consent to participation. The study conformed to the Declaration of Helsinki, and the protocol was approved by the regional committee of medical ethics.
MCE Acquisition
Imaging was performed with the Philips IE33 (Philips Medical Systems, Amsterdam, the Netherlands) equipped with a S5‐1 transducer, using a low‐power RT application (coded harmonic angio, Philips Medical Systems). This imaging mode is based on pulse inversion power Doppler, operating at a frame rate of 20 to 22 Hz. A commercially available second‐generation contrast agent Sonovue (Bracco s. p. a, Milan, Italy) was used. A total of 59 mg of Sonovue was diluted in 5 mL of saline, and 2.5 mL of this solution was administered intravenously for each test at an infusion rates of about 1 mL/min, adjusted for each patient according to the MCE image to assure optimal myocardial enhancement. The contrast agent was prepared by an experienced nurse and administrated undiluted as a continuous infusion operated by a volumetric infusion pump through a 20‐G vial in a proximal forearm vein. The contrast agent and the saline infusion rate were carefully adjusted to optimize myocardial opacification and minimize the far‐field attenuation. The optimal balance between myocardial contrast enhancement and attenuation in our setting was achieved at a very low mechanical index (0.1). Signal amplitudes were color coded by the angio mode and displayed as overlays on fundamental tissue gray‐scale images. Color gain was adjusted to reduce signal‐to‐noise ratio to the point that hardly any noise was noticed within the myocardium and the LV cavity. The time gain compensation was adjusted to obtain homogenous signal intensity (SI) and to reduce noise from myocardium, epicardium, pericardium, and mitral valve. All settings, including the infusion rate, were initially optimized and kept constant during every individual study.
The apical 4‐chamber, 2‐chamber, and long‐axis views were acquired by a physician experienced in contrast echocardiography. These standard views often had to be slightly modified in‐plane; in some cases wall‐by‐wall imaging was done to optimize contrast detection and avoid artifacts as attenuation and rib shadowing. Special care was taken to avoid out‐of‐plane imaging and LV long‐axis foreshortening. Once cavity and myocardial contrast opacification reached a steady state, a brief burst (flash) of 8 frames of high mechanical index (1.6) for transient microbubble destruction was applied. Immediately postflash, there was an automatic return to low mechanical index for continuous imaging of microbubble replenishment for at least 10 cardiac cycles during end expiration. The procedure was repeated at least twice for each scan view, and 15 cardiac cycles of every destruction‐replenishment sequence were captured and stored as raw data.
MCE Analysis
The acquired MCE sequences were digitally transferred to an offline personal computer. Quantitative analysis of cine loops was performed blinded in random order, using a quantitative analysis tool in Q‐Lab 4.2 software (Philips Medical Systems). By using the software's capability of offline electrocardiographically triggered analysis, corresponding end‐systolic frames (end of T waves) were selected from all cardiac cycles of the replenishment sequence.8, 10 Mean SI was automatically measured in regions of interest (ROI), which were manually positioned using a standard 17‐segment model of the LV.24 The ROIs positioned at the first postflash end‐systolic frame were automatically copied onto all subsequent selected frames, and these were manually realigned frame by frame to maintain a central position within the wall during the entire replenishment sequence.
The segmental contrast SI was plotted against time (t), and the subsequent refilling curve was fitted to the exponential function: y(t) = A · (1‐exp−βt) + C, moderated from Wei et al.4 Segmental values of A, β, and the product of A and β (A × β), which is regarded as an indicator of MBF,4 were derived from the replenishment curves. Each myocardial segment was attributed to the territory of 1 of the 3 main coronary arteries, assuming a balanced coronary circulation. The segmental MCE parameters, termed A as mean MBV, β as mean MBF velocity, and A × β as mean MBF, were assigned to and averaged for each coronary territory. Likewise, if a visual contrast defect was limited only to a single basal segment of a coronary territory, this territory was considered normal and the defect attributed to attenuation artifacts if other segments assigned to the same territory demonstrated perfusion. We assigned a 0 score when there was no myocardial perfusion; 1, 2, and 3 score when there was a very poor, poor, and normal imagine, respectively, as semiquantitative analysis.
Intraobserver and interobserver variability for measurements of A and β parameters were obtained by repeated, blinded analysis of 10 randomly selected patients, after a minimum time interval of 8 weeks.
Gated‐SPECT
A 99mTc‐MIBI SPECT study was obtained in every patient at rest. For this purpose, 30 mCi 99mTc‐MIBI was injected intravenously. Approximately 1 to 2 hours after injection, SPECT images were obtained with a wide field‐of‐view rotating camera equipped with a high‐resolution, parallel‐hole collimator centered on the 140‐keV photon peak with a 20% window (400 AC/T; General Electric, Milwaukee, WI). The camera was rotated over an arc of 180° in a circular orbit around the patient's thorax from a right anterior oblique angle of 40° to a left posterior angle of 40° at increments of 6° of 30 seconds each. The data were reconstructed in the same 3 long‐axis views as echocardiography, with in‐plane and z‐axis resolutions of 13 mm, 6.2‐mm per pixel sampling, and 6.2‐mm separation between slices. The myocardial opacification and tracer uptake were judged as: 1 = none, 2 = absent (severe defect), 3 = reduced (mild defect), and 4 = normal.
Coronary Angiography
Selective coronary angiography in multiple views was performed in all patients within 1 week after the MCE. An independent experienced observer blinded to the MCE data analyzed the coronary angiograms. The degree of coronary stenosis was expressed as the percent reduction of the internal lumen diameter in relation to the normal calibrated reference, and a significant stenosis was defined as 50% or more narrowing of the reference lumen diameter. Significant CAD was defined as 50% or more diameter stenosis of 1 or more major epicardial arteries or their major branches (diameter = 2.0 mm).
Statistics
Continuous variables were presented as mean ± standard deviation (SD). The MCE parameters were averaged for all patients in each segment before statistical analysis to minimize the influence of interaction. Grouped data were tested for normal distribution and compared using 2‐tailed t tests. Unpaired tests were used for comparison of independent data. For more than 2 groups, analysis of variance was used considering territorial and patient interaction terms. P values below 0.05 were defined as statistically significant. Receiver operating characteristic (ROC) curves were used to calculate the predictive ability of MCE. Intraobserver and interobserver variability were calculated as the SD of the mean difference expressed as a percentage of the mean (coefficient of variation).
Results
Patients' Data and Coronary Angiography
Forty patients were referred to diagnostic coronary angiography because of suspected CAD. Moreover, 5 patients had to be excluded due to inadequate image quality in all standard apical views (not all coronary territories adequately visualized), leaving 35 patients for comparative quantitative analysis. A total of 47 sites of coronary artery stenosis were detected (left main [LM], 2; left anterior descending [LAD], 17; first diagonal [D1], 5; left circumflex [LCX], 10; obtuse marginal [OM], 3; right coronary artery [RCA], 10) by coronary angiography. Patient baseline characteristics and their extent of CAD are summarized in Table 1.
Table 1.
Patient and Coronary Angiography Characteristics
| Number | Min | Max | Mean | |
|---|---|---|---|---|
| Age, y | 35 | 43 | 82 | 59.51 ± 10.50 |
| Chest pain | 20 | — | — | — |
| ACS | 8 | — | — | — |
| BMI | 35 | 20.08 | 31.89 | 27.54±3.86 |
| Hypertension | 32 | — | — | — |
| Diabetes | 11 | — | — | — |
| CKD | 0 | — | — | — |
| CHOL (cholesterol), mmol/L | 35 | 2.85 | 8.22 | 5.05 ± 1.10 |
| HDL, mmol/L | 35 | 0.55 | 2.35 | 1.24 ± 0.36 |
| LM, % | 2 | 60 | 60 | 60.00 ± 0.00 |
| LAD, % | 17 | 60 | 99 | 88.29 ± 10.23 |
| D1, % | 5 | 50 | 99 | 68.80 ± 20.36 |
| LCX, % | 10 | 60 | 99 | 83.00 ± 15.49 |
| OM, % | 3 | 60 | 95 | 81.67 ± 14.93 |
| RCA, % | 10 | 70 | 99 | 87.00 ± 10.33 |
Abbreviations: ACS, acute coronary syndrome; BMI, body mass index; CKD, chronic kidney disease; D1, first diagonal; HDL, high‐density lipoprotein; LAD, left anterior descending; LCX, left circumflex; LM, left main; Max, maximum; Min, minimum; OM, obtuse marginal; RCA, right coronary artery.
RT‐MCE
A total of 513 segments among 595 segments in 35 patients were obtained. The 82 segments were excluded because of poor image acquisition. The amount of myocardial segments represented by LAD, LCX, and RCA coronary artery beds were 196, 157, and 160, respectively. The amount of base segments, middle segments, and apex segments were 186, 196, and 131 by various myocardial spheres, respectively. Coefficient of intraobserver variation for semiquantitative and quantitative analysis was 95.1% and 93.2%, respectively. Coefficient of interobserver variation for semiquantitative and quantitative analysis was 95.1% and 93.2%.
Quantitative MCE Data at the Level of Vascular Territories
There were 255 ischemic segments detected in 513 segments by the semiquantitative analysis. The values of A, β, and A × β were 6.22 ± 3.15, 0.54 ± 0.22, and 3.81 ± 3.21 in 513 segments, respectively. There were 207 ischemic segments detected in 513 segments by coronary angiography quantitative analysis. The sensitivity and specificity of the semiquantitative analysis for assessment of CAD were 66.7% and 61.8%, respectively (Table 2). Comparing the CAD group and the non‐CAD group, significant differences were noted for A, β, and A × β (3.22 ± 1.87 vs 8.06 ± 3.54, 0.40 ± 0.22 vs 0.71 ± 0.18, 1.37 ± 1.36 vs 5.52 ± 3.06) (P < 0.01) (Table 3). The cutoff of A, β, and A × β was 4.58, 0.64, and 2.73, respectively, and the sensitivity and specificity of RT‐MCE for detection of CAD were 86.0%, 80.2%, 88.9% and 84.1%, 64.6%, 79.9%, respectively. Quantitative RT‐MCE was much better than the semiquantitative analysis (Table 4). The ROC curve area of A, β, and A × β was 0.89, 0.81, and 0.91, respectively, for the detection of significant CAD (P < 0.010) (Figure 1 and Figure 2).
Table 2.
Semiquantitative MCE (N = 513)
| Coronary Angiography | Sum | ||
|---|---|---|---|
| Positive | Negative | ||
| MCE positive | 138 | 117 | 255 |
| MCE negative | 69 | 189 | 258 |
| Sum | 207 | 306 | 513 |
Abbreviations: MCE, myocardial contrast echocardiography.
Table 3.
A, β, and A × β in CAD and non‐CAD groups ( ± s)
| A | β | A × β | |
|---|---|---|---|
| CAD (22) | 3.22 ± 1.87a | 0.40 ± 0.22a | 1.37 ± 1.36a |
| Non‐CAD (13) | 8.06 ± 3.54 | 0.71 ± 0.18 | 5.52 ± 3.06 |
Abbreviations: CAD, coronary artery disease.
P < 0.01 vs non‐CAD.
Table 4.
Quantitative Real‐Time Myocardial Contrast Echocardiography
| Sensitivity | Specificity | Accuracy | |
|---|---|---|---|
| Semiquantitative | 66.7% | 61.8% | 63.7% |
| A | 86.0%a | 81.4%a | 89.3%a |
| β | 80.2%a | 64.6% | 80.8%a |
| A × β | 88.9%a | 79.9a | 90.5%a |
P < 0.05 vs semiquantitative.
Figure 1.
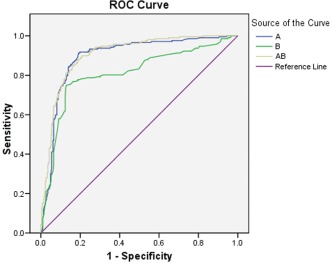
Receiver operator characteristic (ROC) curves on territorial A, β, and A × β vs angiographic results. Diagonal segments are produced by ties.
Figure 2.
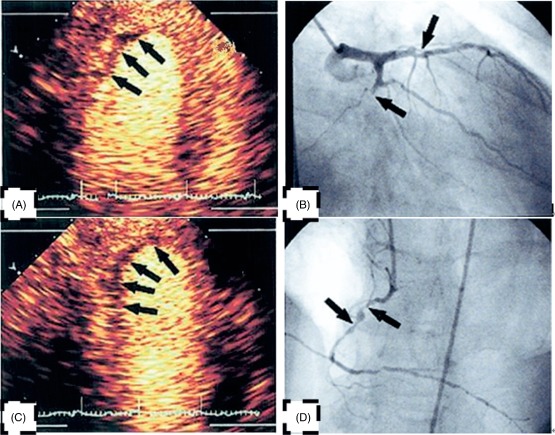
(A) Signal intensity (SI) of mid inferior wall and apex inferior wall decreased conspicuously. (B) The left circumflex occlusion corresponds to (A). (C) SI of mid posterior wall and apex posterior wall decreased conspicuously. (D) The right coronary artery occlusion corresponds to (C).
Quantitative MCE Data at the Level of the Myocardial Segment
The ROC curve area of A at basal, mid, and apical myocardial segments was 0.52, 0.91, and 0.89, respectively. The ROC curve area of β at basal, mid, and apical myocardial segments was 0.89, 0.80, and 0.75, respectively. The ROC curve area of A × β at basal, mid, and apical myocardial segments was 0.71, 0.90, and 0.89, respectively. The ROC curve area of A and A × β was 0.91 and 0.90 in the middle segments. The ROC area of A was 0.52 in the basal segments. RT‐MCE was segmented for assessment to ischemic myocardium. The accuracy of quantitative RT MCE for mid myocardial segments was shown to be the highest (P < 0.05) (Table 5).
Table 5.
Accuracy of Quantitative Real‐Time Myocardial Contrast Echocardiography for Various Myocardial Segments
P < 0.05 compared in 3 groups.
Gated‐SPECT and Multi‐indexes of RT‐MCE
The sensitivity and specificity of gated‐SPECT for assessment of CAD were 84.8% and 82.7%, respectively (Table 6). The sensitivity of multi‐indexes RT‐MCE(A, β, and A × β) increased. The sensitivity was 89.1%, 90.4%, and 96.3%, respectively. The specificity was also not decreased, and the degree of accuracy increased, especially β + A × β. RT‐MCE with multi‐indexes has a valuable application for assessment of CAD surpassing SPECT (Table 7, Table 8).
Table 6.
The Detection of Gated‐SPECT for the Ischemic Myocardial Segments (N = 513)
| Coronary Angiography | Total | ||
|---|---|---|---|
| + | − | ||
| Gated‐SPECT (+) | 273 | 33 | 306 |
| Gated‐SPECT (−) | 49 | 158 | 207 |
| Total | 322 | 191 | 513 |
Abbreviations: SPECT, single‐photon emission computed tomography.
Table 7.
Detection of Real‐Time Myocardial Contrast Echocardiography With Multi‐indexes for the Ischemic Myocardial Segments (N = 513)
| Coronary Angiography | Total | ||
|---|---|---|---|
| + | − | ||
| A + β (+) | 287 | 33 | 320 |
| A + β (−) | 35 | 158 | 193 |
| A + A × β (+) | 291 | 39 | 330 |
| A + A × β (−) | 31 | 152 | 183 |
| β + A × β (+) | 310 | 31 | 341 |
| β + A × β (−) | 12 | 160 | 172 |
| Total | 322 | 191 | 513 |
Table 8.
Real‐Time Myocardial Contrast Echocardiography Compared With Gated‐SPECT
| Methods | Sensitivity | Specificity | Accuracy | |
|---|---|---|---|---|
| 1 | Gated‐SPECT | 84.8% | 82.7% | 84.0% |
| 2 | A | 86.0% | 81.4% | 89.3%a |
| 3 | β | 80.2% | 64.6%b | 80.8% |
| 4 | A × β | 88.9%c | 79.9% | 90.5%c |
| 5 | A + β | 89.1% | 82.7%d | 86.7% |
| 6 | A + A × β | 90.4%e | 79.6%e, f | 86.4%e |
| 7 | β + A × β | 96.3%g, h | 83.8% | 91.6%g |
Abbreviations: SPECT, single‐photon emission computed tomography.
A compared with gated‐SPECT: P < 0.05.
β compared with gated‐SPECT: P < 0.05
A × β compared with gated‐SPECT: P < 0.05.
A + β compared with A: P < 0.05.
A + A × βcompared with β: P < 0.05.
A + A × β compared with gated‐SPECT: P < 0.05.
β + A × β compared with gated‐SPECT: P < 0.05.
β + A × β compared with A × β: P < 0.05.
Discussion
CAD is the world's leading cause of death. Most CAD patients, because of diagnostic uncertainty, are admitted for observation and diagnostic testing. Whether to choose anatomical or functional imaging is a dilemma. Which is more important in evaluating myocardial ischemia in these patients? One rationale for the imaging of patients is to directly image the coronary arteries to look for the severe stenosis or occlusion that is causing the myocardial ischemia. The problem with an anatomy‐based algorithm, however, is that it is difficult to determine solely based on anatomy whether a particular lesion is the cause of the presenting symptoms. Patients may have both chest discomfort from a noncardiac source and a lesion on anatomical imaging that is not the cause of their symptoms.
The next approach to evaluate myocardial ischemia is functional imaging. This can be done by myocardial perfusion imaging. However, for intermediate‐ and low‐risk patients, noninvasive myocardial perfusion imaging could hold great promise. It is highly accurate at exclusion of myocardial ischemia. Meanwhile, it is also highly sensitive in the majority of patients for the indirect evaluation of stenotic disease. It is necessary to detect myocardial ischemia in the patients whose coronary lesions are at a critical level without significant symptoms. Gated‐SPECT is a typical measure for detecting myocardial ischemia, and RT‐MCE is gaining more attention for its ability to evaluate regional myocardial perfusion.
This study demonstrates the ability and the difficulties with a very low‐power MCE method to assess contrast replenishment after transient destruction in RT. The feasibility in consecutive patients was limited as a result of imaging and technical problems. The most frequent artifacts and dropouts were observed in the lateral and basal segments. Nevertheless, the technique permitted quantification of A, β, and A × β, covering the coronary territories in 92.5% of patients scheduled for coronary angiography with adequate image quality.
Based on the principles outlined previously, a large number of clinical studies have now been performed to evaluate the ability of MCE to detect CAD in patients. These trials have used high and low mechanical index imaging modalities, coupled with exercise or pharmacologic stress with either vasodilators or isotopes. In our study, RT‐MCE is an effective method for the detection of coronary artery stenosis. The sensitivity and specificity of quantitative RT‐MCE for detection of CAD were 86.0%, 80.2%, 88.9% and 84.1%, 64.6%, 79.9% for A, β and A × β. Because of its excellent spatial and temporal resolution, portability, widespread availability, and relatively low cost, MCE should provide an attractive method for the noninvasive detection of CAD and for the quantification of stenosis severity at rest in this study.
Our study revealed a better diagnostic performance in detecting significant CAD involving LAD compared with disease involving the posterior beds, which agrees with previous findings.13, 14, 21, 22, 23, 24, 25, 26, 27 This is most probably a result of the more frequent imaging problems experienced in segments allocated to right coronary artery and left circumflex artery beds. Both baseline image quality and contrast opacification was better for segments assigned to LAD, and attenuation and shadowing artifacts were more frequent in posterior bed segments. RT‐MCE is segmented for assessment to ischemic myocardium.
In this study, the β values were generally lower than those reported by Wei et al.4, 13 Triggered intermittent imaging generally gives better contrast detection and myocardial SI with lower contrast infusion rates. In addition, even with the very low‐power RT MCE applied, some degree of tissue harmonics will be present, and some microbubble destruction will occur between flashes. Furthermore, even if not visually recognized as a problem, microbubble destruction within the LV cavity during flash frames may have influenced myocardial input and output function. Spatial variations in the thickness of the beam elevation and in the effective acoustic pressure could also have altered the refilling rates. Inaccurate image alignment of segmental myocardial ROIs, both within each destruction‐replenishment sequence, and between rest and stress, might influence replenishment parameters and their assignment to segments and coronary territories.
In spite of the rapid data acquisition with the RT‐MCE technique, the method is not uncomplicated, and the analysis and interpretation of data are rather difficult and time‐consuming. Automated analysis with parametric display is desirable, but so far methods for contrast detection and postprocessing have not been robust enough for clinical use. Interestingly, a more simplified algorithm using qualitative assessment of MBF velocity (actual time to complete myocardial opacification after contrast destruction used as a surrogate for MBF velocity) from a single intermittent stress MCE perfusion study was recently shown to detect CAD in patients with normal LV function at rest, avoiding the need for resting MCE studies.19 This approach could be both time‐ and contrast‐saving, and the need for stable and comparable image alignment between rest and stress studies is avoided. However, it is still a challenge to maintain a stable probe position for good image alignment during pulsing intervals in studies.
There are only a few studies comparing MCE and radionuclide imaging. The first multicenter trial on MCE showed that, under resting conditions, MCE had a poor correlation with SPECT. This study is the first to compare the accuracy of both quantitative and multi‐indexes of RT‐MCE and gated‐SPECT against coronary angiography. Overall, our results are similar to those of previous investigations using intermittent imaging or qualitative RT‐MCE. Our data nonetheless suggest that quantitative multi‐indexes of RT‐MCE may offer some advantages over conventional qualitative assessments, as it is more reproducible and provides physiologic information on both MBF and myocardial blood volume. However, at present, it can be seen from the above discussion that both anatomical and functional approaches have their merits and drawbacks, and that the approach taken at any institution will depend on the availability and expertise.
Study Limitations
The sample size for comparative quantitative analysis was small and selected from echocardiographic image quality. This limited study size precludes firm conclusions concerning subgroups with different degrees of coronary stenosis severity. We chose to evaluate the diagnostic ability of quantitative RT‐MCE in predicting anatomically significant coronary artery stenosis and did not correlate to a reference perfusion method as SPECT. Nevertheless, coronary angiography is considered the reference standard for examination of epicardial coronary anatomy and finite diagnosis of CAD, and it is mandatory for the choice of invasive treatment.
Conclusion
Our results indicate that the A, β, and A × β derived from low‐power RT‐MCE can accurately identify anatomically significant CAD in selected patients. RT‐MCE is an effective method for the detection of coronary artery stenosis. Quantitative RT‐MCE is segmented for assessment of ischemic myocardium. RT‐MCE with multi‐indexes has a valuable application for assessment of CAD, surpassing SPECT. However, the technique is still limited by imaging artifacts and time‐consuming analysis, and the diagnostic accuracy seems only sufficient for the mid myocardial segment. A more robust contrast detection technique and simplified data analysis and display are required to increase clinical applicability, and different RT‐MCE techniques need to be compared in larger‐scale studies.
Dong‐ye Li, MD, and Li Liang, MD, contributed equally to this article.
The authors have no funding, financial relationships, or conflicts of interest to disclose.
References
- 1. Bonow RO, Maurer G, Lee KL, et al. Myocardial viability and survival in ischemic left ventricular dysfunction. N Engl J Med. 2011;364:1617–1625. [DOI] [PMC free article] [PubMed] [Google Scholar]
- 2. Porter TR, Xie F, Silver M, et al. Real‐time perfusion imaging with low mechanical index pulse inversion Doppler imaging. J Am Coll Cardiol. 2001;37:748–753. [DOI] [PubMed] [Google Scholar]
- 3. Villanueva FS, Wagner WR. Ultrasound molecular imaging of cardiovascular disease. Nat Clin Pract Cardiovasc Med. 2008;5(suppl):S26–S32. [DOI] [PMC free article] [PubMed] [Google Scholar]
- 4. Wei K, Jayaweera AR, Firoozan S, et al. Quantification of myocardial blood flow with ultrasound‐induced destruction of microbubbles administered as a constant venous infusion. Circulation. 1998;97:473–483. [DOI] [PubMed] [Google Scholar]
- 5. Wei K, Jayaweera AR, Firoozan S, et al. Basis for detection of stenosis using venous administration of microbubbles during myocardial contrast echocardiography: bolus or continuous infusion? J Am Coll Cardiol. 1998;32:252–260. [DOI] [PubMed] [Google Scholar]
- 6. Masugata H, Peters B, Lafitte S, et al. Quantitative assessment of myocardial perfusion during graded coronary stenosis by real‐time myocardial contrast echo refilling curves. J Am Coll Cardiol. 2001;37:262–269. [DOI] [PubMed] [Google Scholar]
- 7. Masugata H, Lafitte S, Peters B, et al. Comparison of real‐time and intermittent triggered myocardial contrast echocardiography for quantification of coronary stenosis severity and transmural perfusion gradient. Circulation. 2001;104:1550–1556. [DOI] [PubMed] [Google Scholar]
- 8. Leong‐Poi H, Le E, Rim SJ, et al. Quantification of myocardial perfusion and determination of coronary stenosis severity during hyperemia using real‐time myocardial contrast echocardiography. J Am Soc Echocardiogr. 2001;14:1173–1182. [DOI] [PubMed] [Google Scholar]
- 9. Van Camp G, Ay T, Pasquet A, et al. Quantification of myocardial blood flow and assessment of its transmural distribution with real‐time power modulation myocardial contrast echocardiography. J Am Soc Echocardiogr. 2003;16:263–270. [DOI] [PubMed] [Google Scholar]
- 10. Galiuto L, Garramone B, Burzotta F, et al. Thrombus aspiration reduces microvascular obstruction after primary coronary intervention: a myocardial contrast echocardiography substudy of the REMEDIA Trial. J Am Coll Cardiol. 2006;48:1355–1360. [DOI] [PubMed] [Google Scholar]
- 11. Von Bibra H, Bone D, Niklasson U, et al. Myocardial contrast echocardiography yields best accuracy using quantitative analysis of digital data from pulse inversion technique: comparison with second harmonic imaging and harmonic power Doppler during simultaneous dipyridamole stress SPECT studies. Eur J Echocardiogr. 2002;3:271–282. [PubMed] [Google Scholar]
- 12. Xie F, Hankins J, Mahrous HA, et al. Detection of coronary artery disease with a continuous infusion of definity ultrasound contrast during adenosine stress real time perfusion echocardiography. Echocardiography. 2007;24:1044–1050. [DOI] [PubMed] [Google Scholar]
- 13. Wei K, Ragosta M, Thorpe J, et al. Noninvasive quantification of coronary blood flow reserve in humans using myocardial contrast echocardiography. Circulation. 2001;103:2560–2565. [DOI] [PubMed] [Google Scholar]
- 14. Dawson D, Rinkevich D, Belcik T, et al. Measurement of myocardial blood flow velocity reserve with myocardial contrast echocardiography in patients with suspected coronary artery disease: comparison with quantitative gated technetium 99m sestamibi single photon emission computed tomography. J Am Soc Echocardiogr. 2003;16:1171–1177. [DOI] [PubMed] [Google Scholar]
- 15. Hacker M, Hoyer HX, Uebleis C, et al. Quantitative assessment of cardiac allograft vasculopathy by real‐time myocardial contrast echocardiography: a comparison with conventional echocardiographic analyses and [Tc99m]‐sestamibi SPECT. Eur J Echocardiogr. 2008;9:494–500. [DOI] [PubMed] [Google Scholar]
- 16. Senior R, Kaul S, Soman P, et al. Power Doppler harmonic imaging: a feasibility study of a new technique for the assessment of myocardial perfusion. Am Heart J. 2000;139:245–251. [DOI] [PubMed] [Google Scholar]
- 17. Lin SL, Chiou KR, Huang WC, et al. Detection of coronary artery disease using real‐time myocardial contrast echocardiography: a comparison with dual‐isotope resting thallium‐201/stress technectium‐99m sestamibi single‐photon emission computed tomography. Heart Vessels. 2006;21:226–235. [DOI] [PubMed] [Google Scholar]
- 18. Shimoni S, Zoghbi WA, Xie F, et al. Real‐time assessment of myocardial perfusion and wall motion during bicycle and treadmill exercise echocardiography: comparison with single photon emission computed tomography. J Am Coll Cardiol. 2001;37:741–747. [DOI] [PubMed] [Google Scholar]
- 19. Wei K, Crouse L, Weiss J, et al. Comparison of usefulness of dipyridamole stress myocardial contrast echocardiography to technetium99m sestamibi single‐photon emission computed tomography for detection of coronary artery disease (PB127 multicenter phase 2 trial results). Am J Cardiol. 2003;91:1293–1298. [DOI] [PubMed] [Google Scholar]
- 20. Spencer KT, Grayburn PA, Mor‐Avi V, et al. Myocardial contrast echocardiography with power Doppler imaging. Am J Cardiol. 2000;86:479–481. [DOI] [PubMed] [Google Scholar]
- 21. Ishikura F, Otani K, Kayano H, et al. Quantitative assessment of microcollateral recruitment during coronary occlusion using real‐time intravenous myocardial contrast echocardiography. J Am Soc Echocardiogr. 2008;21:139–145. [DOI] [PubMed] [Google Scholar]
- 22. Tiemann K, Lohmeier S, Kuntz S, et al. Real‐time contrast echo assessment of myocardial perfusion at low emission power: first experimental and clinical results using power pulse inversion imaging. Echocardiography. 1999;16:799–809. [DOI] [PubMed] [Google Scholar]
- 23. Reant P, Labrousse L, Lafitte S, et al. Quantitative analysis of function and perfusion during dobutamine stress in the detection of coronary stenoses: two‐dimensional strain and contrast echocardiography investigations. J Am Soc Echocardiogr. 2010;23:95–103. [DOI] [PubMed] [Google Scholar]
- 24. Senior R, Lepper W, Pasquet A, et al. Myocardial perfusion assessment in patients with medium probability of coronary artery disease and no prior myocardial infarction: comparison of myocardial contrast echocardiography with 99mTc single‐photon emission computed tomography. Am Heart J. 2004;147:1100–1105. [DOI] [PubMed] [Google Scholar]
- 25. Peltier M, Vancraeynest D, Pasquet A, et al. Assessment of the physiologic significance of coronary disease with dipyridamole real‐time myocardial contrast echocardiography: comparison with technetium‐99m sestamibi single‐photon emission computed tomography and quantitative coronary angiography. J Am Coll Cardiol. 2004;43:257–264. [DOI] [PubMed] [Google Scholar]
- 26. Saranteas T, Alevizou A, Tzoufi M, et al. Transthoracic echocardiography for the diagnosis of left ventricular thrombosis in the postoperative care unit. Crit Care. 2011;15:R54. [DOI] [PMC free article] [PubMed] [Google Scholar]
- 27. Platts D, Fraser JF. Contrast echocardiography in critical care: echoes of the future? A review of the role of microsphere contrast echocardiography. Crit Care Resusc. 2011;13:44–55. [PubMed] [Google Scholar]