

Abstract
Objective
To report clinical experience with presurgical evaluation in patients with insulo‐opercular epilepsy. Quantitative analysis on PET imaging and stereoelectroencephalography (SEEG) signals was used to summarize their electroclinical features.
Methods
Twenty‐two patients with focal epilepsy arising from the insular and/or opercular cortex according to SEEG were retrospectively analyzed. Presurgical noninvasive data were analyzed in detail. Interictal PET data of patients were then statistically compared with those of healthy controls to identify the interictal hypometabolic network. The epileptogenicity index (EI) of ictal SEEG signal was computed to identify areas of spread at the beginning of seizure onset.
Results
Focal tonic seizures of the face and/or neck (16/22, 73%) were the most prevalent early objective signs. Epileptic discharges in the interictal and ictal scalp‐EEG mostly showed an ipsilateral perisylvian distribution. Statistical analysis of interictal PET showed significant hypometabolism in the insular lobe, central operculum, supplementary motor area, middle cingulate cortex, bilateral caudate nuclei, and putamen. According to the EI analysis, insulo‐opercular epilepsy could be classified as insulo‐opercular epilepsy (50%), opercular epilepsy (41%), and insular cortex epilepsy (9%).
Significance
Clinical diagnosis of insulo‐opercular epilepsy is challenging because of its complex seizure semiology and nonlocalizing discharges on scalp‐EEG. A common hypometabolic network involving the insulo‐opercular cortex, mesial frontal cortex and subcortical nuclei may be involved in the organization of the insulo‐opercular epilepsy network. Furthermore, quantified SEEG analysis suggested that pure insular epilepsy is rare, and the close connection between insular and opercular cortex necessitates SEEG implantation to define the epileptogenic zone.
Introduction
The insular cortex is located in the depth of the sylvian fissure and is covered by the opercular cortex. The widespread connections of insular lobe to cortical and subcortical regions1, 2 subserve the complex seizure semiology of insular epilepsy. Furthermore, the opercular cortex is highly connected to the insular lobe and is commonly included within the epileptogenic onset zone or areas associated with early seizure spread in insular epilepsy.3, 4 Therefore, perisylvian or insulo‐opercular epilepsies are often considered an integrated group, and seizure semiology4 and electroencephalography (EEG)5 features of such epilepsy have been investigated. SEEG has been approved as a safe tool to explore the insular cortex,6 and the concept of insular epilepsy has received increasing interest over the past 15 years.7, 8 Simultaneous sampling of SEEG in the insular and opercular cortex by orthogonal trajectories could facilitate the differentiation of isolated insular or opercular epilepsy as well as characterizing insulo‐opercular epilepsy. While relatively less described than other epilepsy types, in part due to its more relatively recent characterization through SEEG studies, insulo‐opercular epilepsy is also less prevalent than other localizations such as temporal or frontal epilepsies, and thus more limited numbers of electroclinical data have been published, usually in the form of small series of 10 patients or less.4, 7, 9, 10 Semiological features of insular and insulo‐opercular epilepsy are notably diverse; some characteristic features that have particularly been described in the literature include sensation of laryngeal constriction,9 cutaneous paresthesia (often painful11), and hyperkinetic motor behavior, often occurring from sleep.4, 10 Indeed, a recognized feature of insular seizures is their tendency to “mimic” seizures from other localizations4 including temporal, frontal, and parietal lobes. An overview of semiological and electroclinical features within a larger series confirmed by intracerebral data has been somewhat lacking. In this study, we report our clinical experience with presurgical evaluation and surgical treatment of 22 patients with insular or insulo‐opercular epilepsy, including semiological features, PET data, and ictal SEEG.
Methods
Patient selection
We retrospectively identified consecutive 22 medication‐resistant patients with insulo‐opercular epilepsy between January 2015 and March 2018 who met the following criteria: (1) either adult or children patients were included; (2) all patients were evaluated with SEEG and insulo‐opercular origin of seizures was defined by SEEG recordings; (3) patients without complete presurgical evaluation or clear seizure semiology video were not included. We reviewed and analyzed medical history, seizure semiology, scalp‐EEG, magnetic resonance imaging (MRI) findings (a 3D T1 sagittal magnetization prepared rapid gradient echo sequence (MPRAGE), T2 axial and coronal sequences of 3 mm thickness, and FLAIR axial, coronal, and sagittal sequences of 3 mm thickness), interictal PET with 18F‐fluorodeoxyglucose (18FDG‐PET) scans, SEEG study details, surgical resection, and postoperative seizure outcomes. Informed consent for protocols as approved by the Institutional Review Boards of the Beijing Tiantan Hospital were obtained from all included participants, including patients and volunteers.
Seizure semiology and scalp‐EEG analysis
Scalp video‐EEG recording with 21 channels according to the international 10‐20 system was conducted for each patient. At least two habitual seizures during either sleep or wakefulness were reviewed for each patient (53 seizures in total), and seizure sequences were analyzed in detail by an epileptologist (X.Q.S) and a functional neurosurgeon (W.H.H). On EEG review, high‐pass and low‐pass filters were set at 0.5 Hz and 70 Hz, respectively. Morphology and distribution of interictal discharge (dominant contacts) as well as onset pattern and distribution of ictal discharge were analyzed. Representative ictal EEG signals for each seizure type were chosen based on the quality of the signal (less influenced by artifacts). When multiple ictal EEG patterns were recorded for a given seizure type in a single subject, the predominant pattern was used for the analysis.5 Disagreement was resolved by consensus after discussion.
18FDG‐PET scans and analysis
The PET acquisition and analysis were consistent with our previous report.12, 13 No patients had clinical seizures less than 6 h before or during the PET scan and no EEG monitoring was simultaneously conducted during PET scan. PET visual analysis was a semiquantitative procedure and a functional tool implanted in GE AW 4.6 workstation was used to calculate the regional maximal value of standardized uptake value (SUV) through visual inspection. Asymmetry > 15% with the contralateral homologous regions was considered significant.14
Depending on the SEEG result and surgery side, PET images of patients with right epileptogenic foci were transposed horizontally, and all the epileptogenic zones were lateralized to the left. The PET images were spatially normalized (voxel size: 2 mm × 2 mm × 2 mm) and then smoothed with a Gaussian filter (8 mm FWHM). The resulting PET images were divided by individual mean FDG uptake value of global brain to control for individual variations. The parametric images of the patient group (three patients with previous epilepsy surgery and two patients younger than 7 years old were excluded) were compared with those of a group of 18 healthy subjects (male: n = 11, age: 24.2 ± 7.9 years) using voxel‐based independent t‐test analysis as implemented in SPM8 software. A cluster threshold of 100 voxels was applied, with correction for multiple voxel‐based comparisons using false discovery rate (FDR) control (P < 0.05).
SEEG acquisition and data analysis
SEEG exploration was performed using intracerebral multiple contact electrodes (Huake Hengsheng [China, 8–16 contacts] or Alcis [France, 10–15 contacts], length: 2 mm, diameter: 0.8 mm, 1.5 mm apart) placed through a CRW stereotactic frame. Long‐term recordings were performed after implantation using a NIHON KOHDEN video‐EEG monitoring system. Electroclinical features of at least two habitual seizures with partial or complete antiepileptic drugs withdrawn were recorded in all patients. If more than one seizure pattern was observed per patient, the dominant pattern was selected as being habitual. Postoperative computed tomography (CT, 0.625 mm) was performed in order to verify the position of each recording lead.
Epileptogenicity index (EI) was computed for two habitual seizures in each patient by a plug‐in implanted in AnyWave software (http://meg.univ-amu.fr). The EI was to quantify the epileptogenicity of brain structures, and has been previously described in detail.15, 16 In brief, the EI is a normalized quantity ranging from 0 (no epileptogenicity) to 1 (maximal epileptogenicity). The EI combines two pieces of information into a single quantity: (i) the generation of a rapid discharge estimated by signal energy ratio (ER) between high (beta [12–24 Hz], gamma [24–127 Hz]) and low (theta [4– 7.4 Hz] and alpha [7.4–12 Hz]) frequency bands, (ii) change‐points in the ER[n] quantity. Structures involved in seizure onset detected by EI were further validated by visual analysis. EI values from all SEEG recording cortex were computed and averaged for two habitual seizures in each patient.
Surgical treatment and postoperative follow‐up
All microsurgical resections were performed by one neurosurgeon (K. Z.). Resection areas were determined at multidisciplinary case conferences. Surgery resection consisted of trans‐sylvian insulectomy, subpial operculo‐insulectomy, and opercular cortectomy. Postoperative CT was performed within 8 h after surgery. Histopathologic examinations were performed, including classification of focal cortical dysplasia (FCD) according to guidelines from the International League Against Epilepsy (ILAE, 2011).17 Postoperative outcomes were determined by clinic visit or by telephone. Seizure outcomes were established according to Engel's outcome classification system,3 and Engel class 1 was considered seizure‐free after surgery.
Results
Clinical data
Twenty‐two patients (male: 12, female: 10) were included in this study, including 12 adult patients (>18 years old) and 10 pediatric patients. Mean age at surgery was 19.2 ± 9.6 years (range: 3.5–35 years), mean age of epilepsy onset was 7.4 ± 5.7 years, and mean epilepsy duration was 11.8 ± 8.2 years. Three patients had undergone previous epilepsy surgery, including SEEG‐guided thermocoagulation, followed by vagus nerve stimulation (Pt 19), anterior temporal lobectomy (Pt 14), and lateral prefrontal cortectomy (patient 16).
Preoperative evaluation
Seizure semiology
Autonomic (7, 32%) and somatosensory/viscerosensory (13, 59%) symptoms, either separately or in combination, were the most prevalent auras and/or early seizure semiologies in these patients. Vegetative manifestations included cardiac/respiratory frequency changes, subjective palmar sensation, dyspnea, and facial rubefaction. One patient had a fearful aura, and no recognized aura was found in five patients. Somatosensory and viscerosensory manifestations included unpleasant nonpainful paresthesia in the contralateral upper limb (4, 18%); indescribable sensations in the contralateral hemibody (2, 9%) or whole body (1, 5%); paresthesia (numbness, feeling of electric discharge) restricted to the head, face, or perioral areas (6, 27%); auditory phenomena (1, 5%); epigastric sensation (1, 5%); and sensation of numbness or constriction in pharyngolaryngeal region (1, 5%). Painful aura and ipsilateral paresthesia were not observed in our group.
All patients had ictal motor signs. Elementary (tonic and/or dystonic) motor signs occurred more commonly than complex motor behavior, although both elementary signs and complex motor behavior could occur in the same seizure. Focal tonic seizures involving the face and/or neck were the most prevalent early motor signs (73%, 16/22), including seven patients in pediatric group and nine patients in adult group. No significant difference of focal tonic seizure onset was found between adult and pediatric groups (P > 0.05). Focal tonic seizures restricted to unilateral (or asymmetric bilateral with one side clearly predominating) perioral areas were present in 11 patients (50%, ipsilateral in three patients) and four (18%) had symmetric facial tonic contraction, including pouting, grimace or bilateral eyelid tonic closure. Furthermore, focal tonic contraction in the neck (cervical flexion, 10 patients, 45%, Fig. 1) was another common early symptom, with the head lifting up from the pillow while lying on the bed or the neck bending forward. Seven patients (32%) had bilateral or lateralized eye blinking. Five patients (23%) had upper limb dystonia, either contralateral (three patients) or ipsilateral (two patients), which could involve the whole arm or be limited to the hand. Two patients (9%) also had bilateral asymmetric tonic posture and hypermotor behavior was detected in four patients (18%). Only one patient in our group presented oro‐alimentary automatisms (Table 1).
Figure 1.
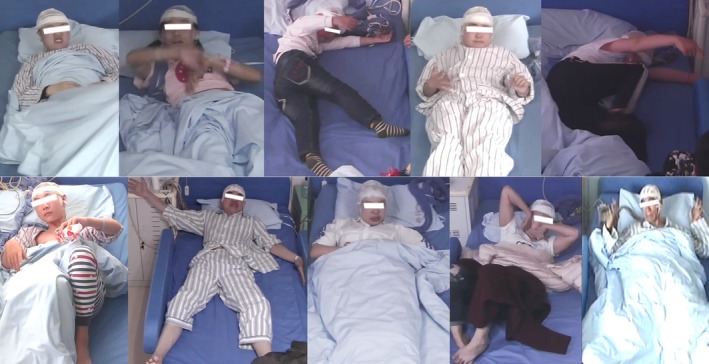
Focal tonic seizure involving the cervical region (neck flexion) in insulo‐opercular epilepsy occurred in 10 patients’ seizures, each illustrated here.
Table 1.
Seizure semiology and imaging information in the present patient group with insulo‐opercular epilepsy.
| Pts | Onset/Surgery age (years) | Aura | Semiology | MRI | PET (hypometabolism) | PET‐MRI (hypometabolism) |
|---|---|---|---|---|---|---|
| 1 | 1/14 | Cephalic sensation | FT (neck, Rt face)‐eyes right deviation, bilateral arm tonic‐eye blinking (Lt) | Lt insular cortical thickening | Lt insular | Lt Insulo‐operculum |
| 2 | 4/14 | Rt arm sensation (undescrible) | FT (Lt face)‐Rt arm tonic‐HMS | Lt insular and operculum abnormality | Lt insular and operculum | Lt Insulo‐operculum and mesial temporal lobe |
| 3 | 5/13 | Rt arm sensation (undescrible) | FT (neck)‐Rt dystonic‐Lt dystonic, FT(Lt face)‐FC(Lt face) | N | N | Lt Insulo‐operculum |
| 4 | 15/30 | Lt body sensation (undescrible) | Lt arm tonic‐FT (Rt face)‐Grimace‐Rt HMS | N | N | Rt insula |
| 5 | 1/22 | None | FT (neck, Lt face)‐eyes Rt deviation, BATS (Rt arm flexion) | Lt insulo‐opercular abnormality | N | Lt Insulo‐operculum |
| 6 | 1/25 | Palpitation and nervous‐Laryngeal constriction‐Oral numbness | HMS | Rt opercular abnormality | N | Rt operculum |
| 7 | 8/10 | Epigastric‐numbness of whole body | FT (neck, Lt face)‐Rt arm tonic, Lt hand rhythmic shaking | N | N | Rt insula |
| 8 | 3/3.5 | None | Rt clonic‐eye blinking | N | Lt Insulo‐opercular | Lt Insulo‐operculum |
| 9 | 3.5/4.5 | Exaggerated and increased respiration, increased HR | FT (neck, face)‐Pouting and Rt arm tonic | N | Lt Insular | Lt insula and temporal pole |
| 10 | 4/9 | Lt arm numbness | FT (neck)‐eyes Rt deviation‐bilateral arm tonic and Rt hand dystonia‐eyes blinking and FC (Rt face)‐Bilateral legs HMS‐Drooling | Rt insulo‐opercular abnormality | Rt Insulo‐opercular | Rt Insulo‐operculum |
| 11 | 20/24 | None | FT (Rt face, neck)‐Drooling, Rt arm tonic and Rt hand dystonia‐Lt hand dystonia‐ trunk twisting left and right | N | N | Lt insula |
| 12 | 6/32 | Chest tightness, Dyspnoea and Lt body numbness | FT (neck, face)‐eyes blinking, Rt arm tonic and Rt hand dystonia‐Lt arm tonic | N | N | Rt insula |
| 13 | 4/8 | Fear | Blinking‐staring‐Lt arm tonic‐bilateral hand automatism | N | Lt Insulo‐opercular | Lt Insulo‐operculum |
| 14 | 4/29 | Rt perioral numbness, increased HR | FT (Rt face)‐Rt clonic, Drooling | N | Lt operculum | Lt Insulo‐operculum |
| 15 | 4/17 | Dyspnoea | FT (Rt face)‐Rt dystonia‐ BATS‐ bilateral eye blinking and perioral clonic (Rt predominant)‐drooling | N | N | Lt Insulo‐operculum |
| 16 | 12/21 | Palpitation and fear, Cephalic sensation (undescrible) | Increased HR and respiratory frequency‐ FT(Rt face), Grimace ‐oroalimentary movement | N | N | Lt Insulo‐operculum |
| 17 | 14/27 | Lt face and arm numbness | Increased HR, Lt arm clonic, Drooling | Rt insulo‐opercular abnormality | N | Rt Insulo‐operculum |
| 18 | 10/35 | None | FT (neck, face), Increased HR, bilateral arm tonic | N | N | Lt Insulo‐operculum |
| 19 | 3/7 | None | Shrug‐Rt arm tonic‐FC (Lt face) | N | Rt operculum | Rt Insulo‐operculum |
| 20 | 14/28 | Cephalic numbness | Increased HR, FT (Lt face)‐FC (Rt face)‐bilateral tonic‐sGTCS | N | N | Rt operculum |
| 21 | 17/25 | Palpitation | FT (neck, face) ‐ Rt arm tonic – Laugher – Padaling | N | N | Lt operculum |
| 22 | 10/25 | Sensation of sounds disappearing gradually | Pouting‐FT (Lt face) – FC (Lt face), Blinking ‐ Lt deviation‐sGTCS | N | N | Rt Insulo‐operculum |
Note: FT, focal tonic seizure; Rt, right; Lt, left; FC, focal clonic; sGTCS, secondary generalized tonic and clonic seizure.
Scalp‐EEG data analysis
All patients but one had normal EEG background activity. Interictally, one patient had rare epileptic discharges, whereas multifocal distribution of slow wave or spike wave occurred in the remaining 21 patients, including suprasylvian in 27% (6/21), perisylvian including temporal regions in 59% (13/21) and infrasylvian in 9% (2/21). Clear lateralization on interictal scalp EEG was found in most patients (91%). Extensive distribution of ictal scalp EEG was observed in 17 patients, including the suprasylvian region in 18% (3/17), infrasylvian region in 6% (1/17), and perisylvian including temporal regions in 76% (13/17). Scalp ictal patterns varied in the patient group, including low voltage fast activity in 41% (9/22), rhythmic activity ranging from δ to α band in 23% (5/22), bursts of rhythmic spikes in 9% (2/22), and no clear EEG changes and late movement artifact in 27% (6/22) (Table S1).
Neuroimaging and PET statistical analysis
Six patients (27%) presented with structural abnormalities on preoperative MRI. Eight patients had detectable insular and/or opercular hypometabolism on conventional PET visualization. All patients had unilateral hypometabolism on PET/MRI coregistration imaging, including insulo‐opercular hypometabolism in 14/22 (64%), insular hypometabolism in 5/22 (23%), and opercular hypometabolism in 3/22 (14%) (Table 1, Figure S1).
When comparing the PET data of the patient group (N = 17) to those of the control group, significant hypometabolism was found in the insular lobe, ipsilateral central operculum, ipsilateral supplementary motor area (SMA), ipsilateral middle cingulate cortex (MCC), bilateral caudate nuclei, and putamen (Fig. 2).
Figure 2.
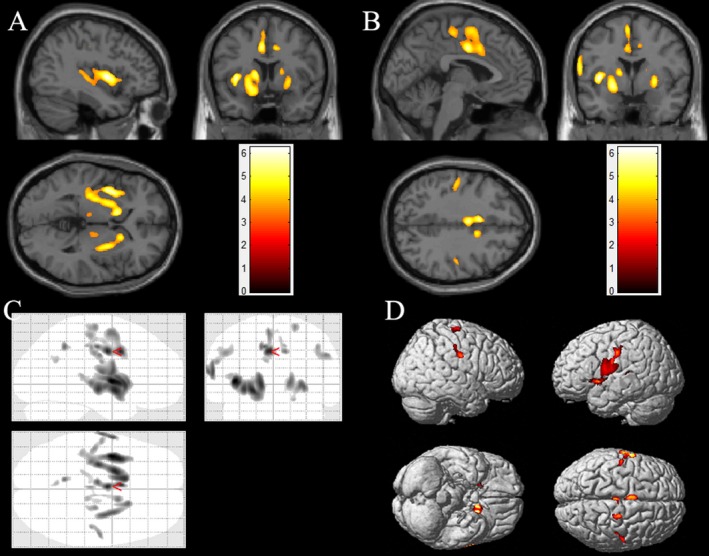
SPM group comparison of patients with insulo‐opercular epilepsy (n = 17) and the control group (n = 18). The results showed significant hypometabolism in left insular cortex (A), central opercular cortex (B,C,D), bilateral heads of the caudate nuclei (A, B), bilateral putamen (A,B), and the mesiofrontal cortex (MCC and SMA, B) in patients with insulo‐opercular epilepsy. Note that the PET images for patients with right‐sided epileptogenic zones were transposed horizontally, and all insulo‐opercular epilepsy were supposed to originate from the left hemisphere. The color scale indicates T scores (P < 0.05, FDR corrected).
SEEG analysis
Twenty‐two patients underwent a total of 191 SEEG electrode implantations using Cosman–Roberts–Wells (CRW) stereotactic frame or stereotactic robot system (Sinovation, Huake, China), with a median of nine electrodes (range: 5–13 electrodes) implanted per patient. One hundred and two electrodes targeted the insular cortex (median: 5, range: 2–8 electrodes), with 12 electrodes of nine patients implanted through oblique parainsular trajectories and 90 electrodes sampling the insular cortex and operculum simultaneously through the orthogonal transopercular trajectory. Two patients received bilateral electrode implantations. Among these patients, one patient showed asymptomatic hemorrhage and no patient present insulo‐opercular hemorrhage. One patient had superficial wound infection and recovered with antibiotic therapy. One patient received second supplementary SEEG placement for increasing sampling within suspected area.
Fourteen patients had simultaneous SEEG electrode implantations in the insular cortex, operculum, and SMA/MCC. For the series as a whole, highest EI values were found in opercular cortex (mean EI value ± SD: 0.77 ± 0.27), followed by insular cortex (mean EI value ± SD: 0.62 ± 0.32) and the SMA/MCC (mean EI value ± SD: 0.44 ± 0.31). (Table 2)
Table 2.
SEEG implantation and surgical information in the present patient group with insulo‐opercular epilepsy.
| Patient | SEEG Explored | Operculum explored/total electrode number | INS gyri explored/total electrode number | Clinically defined EZ1 | FU |
|---|---|---|---|---|---|
| Engel/Duration | |||||
| 1 | L: INS, OP, dF, mF; R: INS, OP | L: oper., cent./3; R: cent./1 | L: All ISG, all ILG/5;R: PSG/1 | L: All ILG, PSG | I/25 |
| 2 | L:INS, OP, OFC, dF, mF, T | L: orb., tria., oper., cent./6 | L: All ISG, CIS/4 | L: PSG | I/39 |
| 3 | L:INS, OP, dF, mF | L: oper, cent./3 | L: MSG, CIS, ALG/3 | L: ALG, PSG, cent (post). | I/31 |
| 4 | R:INS, OP, dF, mF | R: cent., temp./2 | R: All ISG, all ILG/5 | R: All ILG, cent. (post), PSG | I/38 |
| 5 | R:INS, OP, dF, mF | L: tria., oper., cent./4 | R: ALG, all ISG/4 | R: MSG, PSG, oper. | I/46 |
| 6 | R: INS, OP, dP, dF, Mf, OFC | R: oper., cent./2 | R: MSG, ALG, PLG/3 | R: MSG, limen, cent.(pre) | NA/NA |
| 7 | R: INS, OP, T, OFC, dF; L: INS, OP, OFC, dF, T, P | R: temp., oper./2; L: cent./1 | R: All ISG/4; L: ASG, PSG, ALG/3 | R: MSG, oper., ASG | I/32 |
| 8 | L: INS, OP, P, Gyrus lingualis | L: cent., pari., temp./4 | L: All ILG, MSG/4 | L: PLG, temp. | I/29 |
| 9 | L: INS, OP, dF, mF | L: tria., oper., cent., temp./4 | L: All ISG, all ILG/5 | L: PSG, cent.(pre), MSG, oper., limen | I/23 |
| 10 | R: INS, OP,dF | R: tria., oper., cent., temp./5 | R: All ISG, all ILG/5 | R: PSG, cent.(pre and post.), MSG, ALG | I/20 |
| 11 | L: INS, OP, dF, mF, T | L: tria., oper., cent., temp./7 | L: All ISG, all ILG/7 | L: ALG, cent.(post),temp., MSG | I/22 |
| 12 | R: INS, OP, dF, mF, OFC | R: cent., oper./3 | R: All ISG, ALG/4 | R: ALG, cent., PSG, ASG | III/44 |
| 13 | L: INS, OP, T, mP, dP | L: cent., temp., pariet./5 | L: All ILG, PSG, Limen/4 | L: Temp., ILG | I/27 |
| 142 | L: INS, OP, dF, mF | L: oper., cent., pariet., temp./5 | L: All ILG, MSG/5 | L: cent. (post), ALG, pariet. | I/29 |
| 152 | L: INS, OP, dF, mF, T | L: tria., cent./2 | L: ASG, MSG/2 | L: MSG, tria. | I/48 |
| 162 | L: INS, OP, dF, mF, OFC, T | L: oper., cent., temp./4 | L: All ISG, ALG, Limen/5 | L: oper., cent.(pre.), ASG, MSG | I/27 |
| 173 | R: INS, OP, dF, mF | R: cent., oper., temp./5 | R: All ISG, all ILG/5 | R: cent. (post) | II/18 |
| 18 | L: INS, OP, dF, mF, OFC | L: orb., tria., oper., cent., temp./6 | L: All ILG, ASG, PSG/4 | L: cent. (post and pre.) | II/20 |
| 193 | R: INS, OP | R: tria., oper., cent., temp./5 | R: All ISG, all ILG/5 | R: cent. (post and pre.) | I/19 |
| 20 | R: INS, OP, P | R: tria., oper., cent., temp., pariet./9 | R: R: All ISG, all ILG, Limen/8 | R: cent.(post), cent.(pre) | III/23 |
| 21 | R: INS, OP, dF, mF, dP, mP | R: tria., cent./3 | R: PSG, ALG/2 | R: cent.(pre) | I/35 |
| 22 | R:INS, OP,T | R: oper., cent., temp./5 | R: All ILG, all ISG/5 | R: temp. | I/18 |
Note: EZ, epileptogenic zone; R, right; L, left; INS: insula; OP: operculum; F, frontal lobe; T, temporal lobe; P, parietal lobe; m, mesial; d, dorsal; OFC, orbitofrontal cortex; Operculum is divided into orbital part(orb.), triangular part (tria.), opercular part (oper.), central part(cent., ventral precentral and postcentral gyri), parietal part (pariet., posterior to postcentral sulcus), and temporal part. ISG, insular short gyrus; ILG, insular long gyrus; ASG, anterior short gyrus; MSG, middle short gyrus; PSG, posterior short gyrus; ALG, anterior long gyrus; PLG, posterior long gyrus; pre., precentral part; post, postcentral part; FU, follow‐up.
clinical defined EZ is considered according to noninvasive and invasive information through multidisciplinary case conference, including semiology, medical imaging, EI calculation, and conventional visual analysis of the SEEG.
patient belongs to opercular epilepsy according to EI analysis while clinically defined EZ includes opercular and insular cortex according to comprehensive SEEG analysis and clinical information.
Part of insular cortex was also included in the resection area according to intro‐operative monitoring.
Structures with EI values > 0.4 were considered to be highly epileptogenic according to previous studies.18, 19 We then tried further to classify our data according to the calculated EI value of the insular and opercular cortex. We found that 11/22 patients (50%, Pt 3–13) had insulo‐opercular epilepsy (the EI values of both the insular and the opercular cortex being higher than 0.4), and the mean EI values of the insular and opercular cortex were 0.82 (± 0.15) and 0.80 (± 0.20), respectively (Fig. 3). A total of 9/22 patients (41%, Pt 14–22) had opercular epilepsy (only the EI values of the opercular cortex were higher than 0.4; Fig. 4). However, only 2/22 patients (9%, Pt 1–2) had “pure” insular cortex epilepsy (only the EI values of the insular cortex were higher than 0.4; Fig. 5).
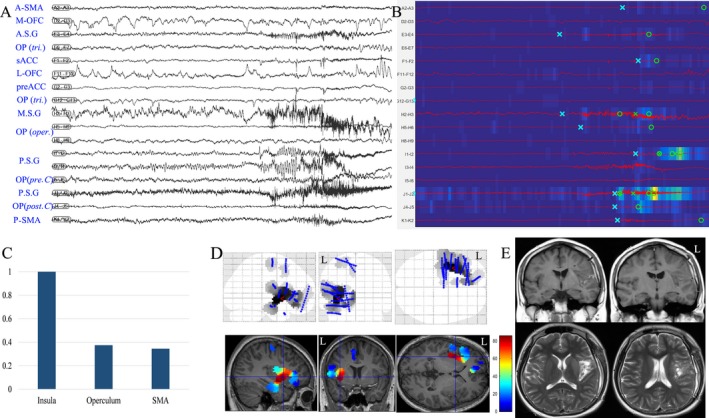
Figure 3.
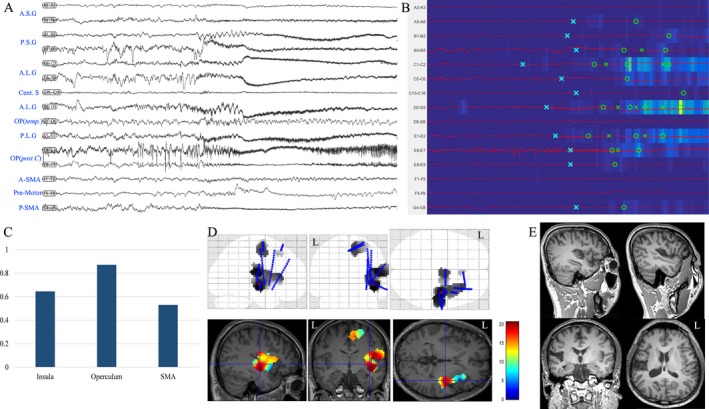
Insulo‐opercular epilepsy in Patient 4. (A) SEEG recordings of entry or target cortex in one seizure episode, including insular cortex, opercular cortex, and SMA; (B) EI map of the same seizure event presents an increased ER at the ictal onset (from blue to yellow scale) and the detection parameters (circle, alarm time; cross, detection time)15, 16 in each chosen channel. The map showed that PSG, ALG, PLG and posterior central operculum were highly epileptogenic; (C) mean highest EI value of insular cortex, operculum, and SMA in two seizure episodes; (D) frequency‐specific (80–200 Hz) epileptogenicity maps were used here to show the cortical distribution of high‐frequency oscillation at the seizure onset (the map here was used to show the involvement of the insular and opercular cortex in the present case, with mean T score (color scale) in two seizure episodes. The detailed methods were described in a previous report30). (E) postoperative MRI after epileptogenic zone resection, including P.L.G, A.L.G, and P.S.G. The patient was seizure‐free in the follow‐up 31 months after surgery. A.S.G: anterior short gyrus; P.S.G: posterior short gyrus; A.L.G: anterior long gyrus; Cent. S: central sulcus; OP (temp.): temporal operculum; OP (post. C): posterior central operculum; SMA: supplementary motor area; A, anterior; P: posterior.
Figure 4.
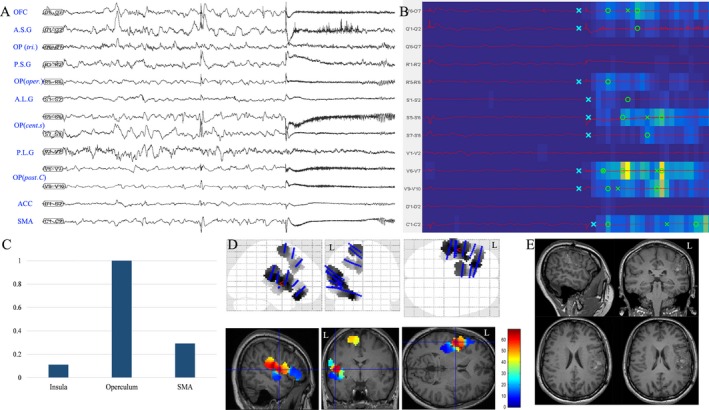
Opercular epilepsy in patient 18. (A) SEEG recordings of entry or target cortex in one seizure episode, including insular cortex, opercular cortex and mesial frontal cortex (SMA and ACC); (B) EI map of the same seizure event presents the increased ER at the ictal onset (from blue to yellow scale) and the detection parameters (circle, alarm time; cross, detection time)15, 16 in each chosen channel. The map showed that the posterior central operculum and opercular part of central sulcus were highly epileptogenic; (C) mean highest EI value of insular cortex, operculum and SMA in two seizure episodes; (D) frequency‐specific (60–180 Hz) epileptogenicity maps were used here to show the cortical distribution of high‐frequency oscillation at the seizure onset (the map here was used to show the involvement of the insular and opercular cortex in the present case, with mean T score (color scale) in two seizure episodes. The detailed methods was described in a previous report30). (E) postoperative MRI after epileptogenic zone resection, including posterior central operculum and opercular part of the central sulcus. Nevertheless, the patients still had focal right perioral clonic seizures without loss of consciousness 20 months after surgery, strongly suggesting incomplete resection of the anterior central operculum as shown in picture D. A.S.G: anterior short gyrus; P.S.G: posterior short gyrus; A.L.G: anterior long gyrus; P.L.G: posterior long gyrus; Cent. S: central sulcus; OP: operculum; OP (post. C): posterior central operculum; OP (oper.): operculum opercularis; OP (tri.): operculum triangularis; ACC: anterior cingulate cortex.
Figure 5.
Insular epilepsy in patient 2. (A) SEEG recordings of entry or target cortex in one seizure episode, including insular cortex, opercular cortex, mesial frontal cortex (SMA and ACC) and OFC; (B) EI map of the same seizure event presents the increased ER at the ictal onset (from blue to yellow scale) and the detection parameters (circle, alarm time; cross, detection time)15, 16 in each chosen channel. The map showed that the middle and posterior insular short gyri were highly epileptogenic; (C) mean highest EI value of insular cortex, operculum and SMA in two seizure episodes; (D) frequency‐specific (40–180 Hz) epileptogenicity maps were used here to show the cortical distribution of high frequency oscillation at the seizure onset (the map here was used to show the involvement of insular and opercular cortex in the present case, with mean T score (color scale) in two seizure episodes. The detailed methods were described in a previous report.30). E, postoperative MRI after epileptogenic zone resection, including anterior and posterior long gyri as well as posterior and middle short gyri in the left insular lobe. A.S.G: anterior short gyrus; P.S.G: posterior short gyrus; A.L.G: anterior long gyrus; P.L.G: posterior long gyrus; Cent. S: central sulcus; OP: operculum; OP (post. C): posterior central operculum; OP (oper.): operculum opercularis; OP (tri.): operculum triangularis; ACC: anterior cingulate cortex; M‐OFC: mesial orbitofrontal cortex; L‐OFC: lateral orbitofrontal cortex.
Surgery resection and pathology
Fifteen patients underwent insulo‐opercular tailored resection, two with insular cortex tailored resection, and four patients with opercular tailored resection. One patient underwent SEEG evaluation without subsequent resective surgery. Since cortical mapping suggested motor function in the epileptogenic zone, resection surgery was refused by the patient because of the risk of facial paralysis.
Postoperative histopathology revealed thirteen FCD lesions (FCD type IIa in eight, FCD type IIb in four, and FCD type I in one). Notably three of these were MRI‐negative cases. Eight patients had only nonspecific pathology, including gliosis and ischemic‐hypoxic changes that could not exclude the results of excessive segmentation during surgery resection. In the present patient group, four patients experience postoperative transient mild hemiparesis and persistent mild hemiparesis occurred in two patients due to infarction of long perforated arteries during posterior insular resection, as reported in a previous study.3 All patients received resection surgery were followed up with a mean duration of 29.2 ± 9.4 months (range: 18–48 months) and 17 patients (80%) were seizure‐free at the most recent follow‐up after surgery (Table 2). Three patients without seizure freedom mainly resulted from incomplete resection according to postoperative evaluation: patient 12 presented residual insular cortex in postoperative MRI; patients 18 and 20 presented incomplete resection of precentral operculum, one has fewer habitual seizures and one has focal perioral clonic seizures. For patient 17 who presented parietal opercular encephalomalacia in MRI, the patient presented automatic symptom and residual anterior insular cortex may be responsible for the postoperative seizure.
Discussion
In this study, we report the electroclinical characteristics of 22 patients with insulo‐opercular epilepsy evaluated by SEEG. Compared with previous reports, three main results were evidenced in our patient group: (1) early focal tonic seizures involving the neck and/or face were common seizure semiologies in insulo‐opercular epilepsy; (2) interictal PET statistical analysis showed that not only insular‐opercular cortex, but also SMA‐MCC cortex as well as subcortical nuclei (caudate nuclei and putamen) were often involved in insulo‐opercular epilepsy; (3) According to EI quantitative analysis, both insular and opercular cortex were commonly together involved in the organization of epileptogenic zone and pure insular epilepsy was rare. SEEG is necessary to identify insular epilepsy and to discriminate the roles of the opercular and insular cortex in the epileptogenic zone in most cases.
A careful analysis of early semiological features appears particularly useful to identify a possible insular origin of seizures, especially neurovegetative and somatosensory/viscerosensory signs.4, 5, 7, 9 In terms of objective semiology, all patients in the present series presented ictal motor signs, which were predominantly elementary motor signs of dystonic or tonic contraction. Notably, 10 patients presented with early focal tonic contraction in cervical muscles, especially neck flexion, and/or facial tonic signs including perioral and periocular contraction. This was commoner in our series than ipsilateral or contralateral upper limb dystonia, or more widespread bilateral hypertonicity, which have previously been described in insular seizures.9 Focal tonic seizures involving the face have been reported in pediatric studies of insular epilepsy,3, 7 but this has not been previously highlighted as a prominent feature in adult patients. Such seizure semiology might result from the involvement of the opercular or ventral part of primary motor and/or premotor cortex. Importantly, such findings pertain to older children and adult patients because very few patients younger than 3 years old were included in the present and previous studies.3 Children younger than 3 years old, as a heterogeneous group, usually present with early motor and tonic seizures in other type of focal epilepsy, including temporal lobe epilepsy.20 On the other hand, oro‐alimentary automatic behavior was rare, observed in only one patient; this is of interest given recent demonstration of the role of insulo‐opercular cortex involvement in temporal lobe seizures presenting oro‐alimentary automatisms, in which this clinical sign was associated with increased theta coherence between temporal and bilateral insulo‐opercular structures.21 In the present series, the rarity of this sign in seizures limited to insulo‐opercular structures without significant temporal lobe involvement, highlights the role for specific network dynamics underlying such complex ictal automatic behaviors.22, 23 Consistent with the findings in the study of Taussig et al.7 in children, seven patients in this study, including five children and two adults, had bilateral or lateralized eye blinking. To date, no specific neural substrate has been confirmed for this semiology. An “autonomic” origin related to the autonomic component of the third cranial nerve might explain this semiology.7
In terms of surface EEG, deep location of the insular cortex as well as its widespread structural connectivity2 contribute to widely distributed interictal and ictal discharges. A nonfocal or multilobar distribution pattern, especially in perisylvian surface electrodes, is indeed a characteristic feature of insulo‐opercular epilepsy. However, in our series, surface EEG could provide reliable information regarding lateralization of insulo‐opercular epilepsy, consistent with the findings of Tassi and colleagues.3
Cerebral PET findings in patients with insulo‐opercular epilepsy have been relatively rarely reported. This study identified a common interictal hypometabolic network, including the insulo‐opercular cortex, SMA‐MCC cortex, bilateral caudate nuclei, and putamen. Although it is commonly accepted that areas with significant hypometabolism may exceed the actual cortex involving seizure onset or propagation, it could also provide data evidence of seizure onset zone and propagation network. Previous studies of TLE found that interictal metabolic changes in PET imaging24 or ictal brain SPECT perfusion25 correlated with ictal electroclinical patterns. Our previous results regarding the interictal hypometabolic network observed in patients presenting seizures with hypermotor behavior12 are consistent with the findings of an ictal SPECT study,26 suggesting that interictal hypometabolic regions may be closely related to those involved in production of semiology. In this context, the present PET analysis showed that the ventral rolandic cortex was significantly hypometabolic in patients with insulo‐opercular epilepsy, which is of interest given the tendency to observe facio‐cervical ictal motor signs. We also observed bilateral hypometabolism of the putamen, which may relate to generation of dystonic seizure behavior, in keeping with previous observations using ictal single photon emission computerized tomography (SPECT).27
Significant hypometabolism of mesial frontal cortex (cingulate motor area, SMA and cingulate sulcus) on PET analysis may reflect a specific role for these structures in production of bilateral asymmetric tonic posturing and/or hypermotor behavior,4, 10 which are the most prevalent complex motor behaviors in insulo‐opercular epilepsy. Higher EI values in MCC/SMA in this study also provided evidence of the early ictal involvement of frontal motor system structures. A previous SEEG study also found that complex motor signs usually appeared when the ictal discharges spread to mesiofrontal regions.4
The epileptogenic network calculated with EI from SEEG ictal signals characterized only a few cases with “pure” insular epilepsy, whereas the most prevalent seizure types were insulo‐opercular and opercular epilepsy. Dense connections between the insular cortex and the operculum underlie the insulo‐opercular network and can be presumed to play a role in the frequently observed insulo‐opercular hypometabolic pattern. Pure tailored insular cortectomy has been rarely reported in previous studies3, 4, 7 and the operculum has been reported to be frequently involved in insular epilepsy as part of the epileptogenic zone.3 From an epileptological point of view, it seems useful to consider the insulo‐opercular zones as an integrated system and accordingly, particular consideration should be given to sampling both insular and opercular cortices when attempting to define the epileptogenic zone. SEEG is thus a particularly valuable approach for evaluation of insulo‐opercular epilepsy: orthogonal trajectories allow exploration of opercula and insular cortex, whereas oblique trajectories offer a larger spatial sampling of the insular cortex in terms of its short and long gyri.28, 29 A combination of orthogonal and oblique trajectories appears to be an optimal strategy.8
Surgical resection of the insular cortex is thought to be difficult because of the anatomical difficulties and the overlying “artery wall.” The tailored resection of insular cortex is easily lost in the depth of the sylvian fissure. With more and more surgical experience and familiarity of insular anatomy, we summarized the following points we think important in insular surgery: (1) the whole length of sylvian should be exposed as much as possible; (2) the insular limiting sulci and insular gyri should be discriminated before surgery; (3) insular gyri should be resected one by one and SEEG electrodes could be valuable markers for gyri discrimination. Long insular perforated arteries should be protected during resection; (4) the depth of insular resection should be stopped as soon as the white matter was exposed deep in the insular sulci and the resection depth of the superior limiting sulcus should be especially cautious for avoiding the underlying corona radiata.
Conclusion
Insulo‐opercular epilepsy should be suspected in patients presenting with somatosensory or neurovegetative symptoms and signs, early focal tonic seizures involving the face and/or neck and extensive perisylvian distribution of interictal and ictal discharges. Interictal PET analysis showed not only insulo‐opercular hypometabolism but also hypometabolism of SMA‐MCC cortex and basal ganglia, which may be related to certain semiological patterns. SEEG implantation is necessary to define the epileptogenic zone in most suspected insulo‐opercular epilepsy cases and tailored resection of the insulo‐opercular cortex is effective in seizure control after careful epilepsy evaluation.
Author Contribution
K.Z and X.Q.S contributed to the study concept and design and critically revised the manuscript for important intellectual content. K.Z supervised the study. X.W. collected the data and analyzed the SEEG signal, and drafted the manuscript. W.H.H analyzed and interpreted the PET data and revised the manuscript. A.M contributed the study design and critically revised the manuscript for important intellectual content. C.Z, L.S, and B.T.Z provides the technique and material support and revised the manuscript. T.S. and F.W. revised the manuscript for important intellectual content. J.G.Z contributed the study design and revised the manuscript.
Conflicts of Interests
We confirm that we have read the Journal's position on issues involved in ethical publication and affirm that this report is consistent with those guidelines. On behalf of all authors, the corresponding author confirms no conflict of interest.
Supporting information
Table S1. Scalp EEG in patients with insulo‐opercular epilepsy.
Figure S1. PET‐MRI coregistration imaging in typical cases with insulo‐opercular epilepsy.
Acknowledgments
The authors thank Professor Olivier David for his sharing of EI mapping toolbox with us in this study. The study was supported by the Capital (China) Health Research and Development Special Fund (2016‐1‐1071), Beijing Municipal Science & Technology Commission (Z161100000216130), National Natural Science Foundation of China (No. 81701276, 81471327), Ningxia Science and Technology Support Project (No. 2016BZ07).
Funding information
The study was supported by the Capital (China) Health Research and Development Special Fund (2016‐1‐1071), Beijing Municipal Science & Technology Commission (Z161100000216130), National Natural Science Foundation of China (No. 81701276, 81471327), Ningxia Science and Technology Support Project (No. 2016BZ07).
Funding Statement
This work was funded by Capital (China) Health Research and Development Special Fund grant 2016‐1‐1071; Ningxia Science and Technology Support Project grant 2016BZ07; Beijing Municipal Science & Technology Commission grant Z161100000216130; National Natural Science Foundation of China grants 81471327 and 81701276.
Contributor Information
Xiaoqiu Shao, Email: shaoxiaoqiu2000@aliyun.com.
Kai Zhang, Email: zhangkai62035@163.com.
References
- 1. Shura RD, Hurley RA, Taber KH. Insular cortex: structural and functional neuroanatomy. J Neuropsychiatry Clin Neurosci 2014;26:276–282. [DOI] [PubMed] [Google Scholar]
- 2. Mesulam MM, Mufson EJ. Insula of the old world monkey. III: efferent cortical output and comments on function. J Comp Neurol. 1982;212:38–52. [DOI] [PubMed] [Google Scholar]
- 3. Freri E, Matricardi S, Gozzo F, et al. Perisylvian, including insular, childhood epilepsy: presurgical workup and surgical outcome. Epilepsia 2017;58:1360–1369. [DOI] [PubMed] [Google Scholar]
- 4. Proserpio P, Cossu M, Francione S, et al. Insular‐opercular seizures manifesting with sleep‐related paroxysmal motor behaviors: a stereo‐EEG study. Epilepsia 2011;52:1781–1791. [DOI] [PubMed] [Google Scholar]
- 5. Levy A, Yen Tran TP, Boucher O, et al. Operculo‐insular epilepsy: scalp and intracranial electroencephalographic findings. J Clin Neurophysiol 2017;34:438–447. [DOI] [PubMed] [Google Scholar]
- 6. Bourdillon P, Ryvlin P, Isnard J, et al. Stereotactic electroencephalography is a safe procedure including for insular implantations. World Neurosurg 2017;99:353–361. [DOI] [PubMed] [Google Scholar]
- 7. Dylgjeri S, Taussig D, Chipaux M, et al. Insular and insulo‐opercular epilepsy in childhood: an SEEG study. Seizure 2014;23:300–308. [DOI] [PubMed] [Google Scholar]
- 8. Gras‐Combe G, Minotti L, Hoffmann D, et al. Surgery for nontumoral insular epilepsy explored by stereoelectroencephalography. Neurosurgery 2016;79:578–588. [DOI] [PubMed] [Google Scholar]
- 9. Isnard J, Guenot M, Sindou M, Mauguiere F. Clinical manifestations of insular lobe seizures: a stereo‐electroencephalographic study. Epilepsia 2004;45:1079–1090. [DOI] [PubMed] [Google Scholar]
- 10. Ryvlin P, Minotti L, Demarquay G, et al. Nocturnal hypermotor seizures, suggesting frontal lobe epilepsy, can originate in the insula. Epilepsia 2006;47:755–765. [DOI] [PubMed] [Google Scholar]
- 11. Montavont A, Mauguiere F, Mazzola L, et al. On the origin of painful somatosensory seizures. Neurology 2015;84:594–601. [DOI] [PubMed] [Google Scholar]
- 12. Wang X, Hu W, Zhang K, et al. The anatomo‐electrical network underlying hypermotor seizures. Front Neurol 2018;9:243. [DOI] [PMC free article] [PubMed] [Google Scholar]
- 13. Hu WH, Wang X, Liu LN, et al. Multimodality image post‐processing in detection of extratemporal MRI‐negative cortical dysplasia. Front Neurol 2018;9:450. [DOI] [PMC free article] [PubMed] [Google Scholar]
- 14. Ferrie CD, Maisey M, Cox T, et al. Focal abnormalities detected by 18FDG PET in epileptic encephalopathies. Arch Dis Child 1996;75:102–107. [DOI] [PMC free article] [PubMed] [Google Scholar]
- 15. Bartolomei F, Chauvel P, Wendling F. Epileptogenicity of brain structures in human temporal lobe epilepsy: a quantified study from intracerebral EEG. Brain 2008;131(Pt 7):1818–1830. [DOI] [PubMed] [Google Scholar]
- 16. Pizzo F, Roehri N, Catenoix H, et al. Epileptogenic networks in nodular heterotopia: a stereoelectroencephalography study. Epilepsia 2017. [DOI] [PubMed] [Google Scholar]
- 17. Blumcke I, Thom M, Aronica E, et al. The clinicopathologic spectrum of focal cortical dysplasias: a consensus classification proposed by an ad hoc Task Force of the ILAE Diagnostic Methods Commission. Epilepsia 2011;52:158–174. [DOI] [PMC free article] [PubMed] [Google Scholar]
- 18. Bonini F, McGonigal A, Wendling F, et al. Epileptogenic networks in seizures arising from motor systems. Epilepsy Res 2013;106(1–2):92–102. [DOI] [PubMed] [Google Scholar]
- 19. Aubert S, Wendling F, Regis J, et al. Local and remote epileptogenicity in focal cortical dysplasias and neurodevelopmental tumours. Brain 2009;132(Pt 11):3072–3086. [DOI] [PubMed] [Google Scholar]
- 20. Fogarasi A, Jokeit H, Faveret E, Jo′zsef J, Tuxhorn I. The effect of age on seizure semiology in childhood temporal lobe epilepsy. Epilepsia 2002;43:638–643. [DOI] [PubMed] [Google Scholar]
- 21. Aupy J, Noviawaty I, Krishnan B, et al. Insulo‐opercular cortex generates oroalimentary automatisms in temporal seizures. Epilepsia 2018;59:583–594. [DOI] [PubMed] [Google Scholar]
- 22. Chauvel P, McGonigal A. Emergence of semiology in epileptic seizures. Epilepsy Behav 2014;38:94–103. [DOI] [PubMed] [Google Scholar]
- 23. Bartolomei F, Lagarde S, Wendling F, et al. Defining epileptogenic networks: contribution of SEEG and signal analysis. Epilepsia 2017;58:1131–1147. [DOI] [PubMed] [Google Scholar]
- 24. Chassoux F, Semah F, Bouilleret V, et al. Metabolic changes and electro‐clinical patterns in mesio‐temporal lobe epilepsy: a correlative study. Brain 2004;127(Pt 1):164–174. [DOI] [PubMed] [Google Scholar]
- 25. Bouilleret V, Valenti MP, Hirsch E, et al. Correlation between PET and SISCOM in temporal lobe epilepsy. J Nucl Med 2002;43:991–998. [PubMed] [Google Scholar]
- 26. Wong CH, Mohamed A, Larcos G, et al. Brain activation patterns of versive, hypermotor, and bilateral asymmetric tonic seizures. Epilepsia 2010;51:2131–2139. [DOI] [PubMed] [Google Scholar]
- 27. Newton MR, Berkovic SF, Austin MC, et al. Dystonia, clinical lateralization, and regional blood flow changes in temporal lobe seizures. Neurology 1992;42:371–377. [DOI] [PubMed] [Google Scholar]
- 28. Afif A, Chabardes S, Minotti L, et al. Safety and usefulness of insular depth electrodes implanted via an oblique approach in patients with epilepsy. Neurosurgery. 2008;62(5 Suppl 2):ONS471–ONS479; discussion 479‐480. [DOI] [PubMed] [Google Scholar]
- 29. Desai A, Bekelis K, Darcey TM, Roberts DW. Surgical techniques for investigating the role of the insula in epilepsy: a review. Neurosurg Focus 2012;32:E6. [DOI] [PubMed] [Google Scholar]
- 30. David O, Blauwblomme T, Job AS, et al. Imaging the seizure onset zone with stereo‐electroencephalography. Brain 2011;134(Pt 10):2898–2911. [DOI] [PubMed] [Google Scholar]
Associated Data
This section collects any data citations, data availability statements, or supplementary materials included in this article.
Supplementary Materials
Table S1. Scalp EEG in patients with insulo‐opercular epilepsy.
Figure S1. PET‐MRI coregistration imaging in typical cases with insulo‐opercular epilepsy.