

Abstract
Neuropathological studies showed early locus coeruleus (LC) neuronal loss associated with tauopathy in Alzheimer’s Disease (AD). We used the LC signal intensity (LC‐I) on 3T MRI to assess the LC integrity in AD (n = 37) and controls (n = 17). The LC‐I was decreased in AD regardless of typical (amnesic) and atypical presentation (logopenic aphasia/visuo‐spatial deficit), from the prodromal stage, and independently of the amyloid load measured by PiB‐PET. The LC‐I was correlated with memory performance of typical AD. This supports the pathophysiological model in which the LC plays a critical role in AD and may thus be a potential therapeutic target.
Introduction
Besides cortical ß‐amyloid plaques and tau protein aggregates which characterize Alzheimer’s disease (AD), neuropathological studies point to a significant neuronal loss in the locus coeruleus (LC), associated with disease severity, estimated between 13 and 30% at the prodromal stage and between 30 and 55% at mild or moderate stages when compared with controls.1, 2, 3, 4, 5 LC is among the earliest sites of detectable tau pathology in AD, and some authors suggest that LC tau pathology precedes the primary symptoms by several decades.6, 7, 8, 9 Some authors suggest that it may seed the development of tau aberrant protein aggregates in interconnected brain regions.6, 9, 10 In animal studies, lesions of the LC exacerbate AD neuropathology and cognitive deficits in both amyloid‐based transgenic mouse models and mouse models of tauopathy.11, 12 Due to its noradrenergic function, LC could also play a critical role in cognition, especially mental flexibility or memory‐retrieval.13 Neuropathological studies in AD showed a correlation between the decreased number of noradrenergic LC neurons and cognitive performance, especially memory formation and retrieval.4 All neuropathological studies remained focused on typical AD, and, until today, data in atypical AD remain lacking.
The LC can be studied in vivo using a new MRI method based on the measure of the LC signal intensity (LC‐I) using the paramagnetic properties of neuromelanin, the main pigment contained in the LC.14 The LC‐I was related to the number of LC cells observed in post‐mortem healthy individuals15 and was proposed as an early markers of non‐dopaminergic Parkinson’s disease pathology.16
This study aimed to assess the LC signal intensity (LC‐I) in AD patients and its correlations with cognition and amyloid load. By contrasting typical and atypical AD, we aimed to decipher the role of LC neuronal loss in AD pathogenesis. We hypothesized that, if LC alteration plays a critical role for tau deposition as suggested in recent works, we should find a similar LC‐I decrease in both AD sub‐groups.
Methods
Patients
We included 54 participants from the Shatau7‐Imatau study (NCT02576821): 37 patients with AD according the following criteria (1) for typical AD: progressive episodic memory impairment, characterized by a low free recall not normalized with semantic cueing according to the Free and Cued Selective Reminding Test (FCSRT), associated or not with other cognitive deficits; (2) for atypical AD: visuo‐spatial deficit and/or logopenic progressive aphasia (LPA) with relative preservation of memory function; (3) the positivity of pathophysiological biomarkers suggestive of AD: cerebrospinal fluid (CSF) biomarkers (IATI score < 0.8)17 and amyloid PET imaging (PiB global cortical index (GCI) >1.45); (4) Clinical Dementia Rating (CDR) scale ≤ 1. Seventeen controls with normal neuropsychological testing and negative PiB‐PET were included.
We did not include subjects with (1) systemic illnesses that could interfere with cognitive functioning or unstable or severe pathology; (2) extrapyramidal signs or neurological history suggestive of Parkinson’s disease with dementia, progressive supranuclear palsy, corticobasal degeneration, or dementia with Lewy bodies; (3) depression assessed with a score > 15 on the Montgomery‐Asberg Depression Rating Scale (MADRS); (4) a history of epileptic pathology; (5) Fazekas score ≥ 3.
Patients were defined as prodromal AD when the CDR scale score was 0.5, and as mild AD dementia when the CDR score was 1.
The clinical characteristics of the patients and controls are summarized in Table 1.
Table 1.
Data are given as mean (SD)
| Controls (n = 17) | Typical AD (n = 21) | Atypical AD (n = 16) | |
|---|---|---|---|
| Age, y | 68.5 (3.9) | 68.9 (7) | 66.3 (7.2) |
| Sex (Male/female) | 5/12 | 10/11 | 6/10 |
| No. patients with CDR = 0 | 17 | 0 | 0 |
| No. patients with CDR = 0.5 | 0 | 15 | 12 |
| No. patients with CDR = 1 | 0 | 6 | 4 |
| MMSE | 28.8 (1.0) | 24.0 (3.5)** | 21.6 (2.2)* , ** |
| Episodic Memory Score 1 | 89.9 (6.5) | 40.8 (19.2) ** | NA |
| FCSRT free recall (max score:48) | 32.2 (5.8) | 10.1 (7.4) ** | NA |
| FCSRT total recall (max score 48) | 47.0 (1.3) | 24.2 (10.8) ** | NA |
| Doors A test (max score:12) | 10.2 (1.3) | 6.5 (2.5) ** | 6.7 (2.4)** |
| Cognitive Parietal Score 2 | 156.5 (1.5) | 147.8 (13.8) | 125.9 (22.8)* , ** |
| Denomination (max score: 80) | 79.6 (0.6) | 76.3 (4.2) | 71.9 (7.8)* , ** |
| Gestural praxis (max score: 36) | 35.5 (0.9) | 34.4 (2.3) | 27.2 (11.3)* , ** |
| ROCF copy (max score: 36) | 35.4 (0.9) | 31.1 (10.5) | 21.9 (15.2)** |
| Construction score of the MATTIS DRSγ (max score: 6) | 6.0 (0) | 5.9 (0.4) | 4.9 (1.7)* |
| Executive functions | |||
| Category fluency (2 minutes) | 34.4 (10.1) | 19.0 (5.6) ** | 14.6 (6.3)** |
| Forward digit span | 5.6 (1.2) | 5.3 (1.0) | 4.9 (1.2) |
| Backward digit span | 4.5 (1.1) | 4.3 (1.1) | 2.6 (0.9)* , ** |
| Similarities WAIS | 23.8 (3.6) | 19.8 (4.5)*** | 14.2 (4.8)* , ** |
| MADRS | 5.3 (3.5) | 5.5 (6.5) | 7.6 (5.3) |
| Treatment | |||
| AchEI, No./total No. (%) | 0/17 (0) | 16/21 (76) | 15/16 (94) |
| SSRIs, No./total No. (%) | 0/17 (0) | 9/21 (43) | 9/16 (56) |
| SSNIs, No./total No. (%) | 0/17 (0) | 4/21 (19) | 2/16 (12.5) |
| GCI [11C] –PIB | 1.30 (0.11) | 2.95 (0.67)** | 2.67 (0.62)** |
| CSF IATI Score | NA | 0.54 (0.21) | 0.45 (0.17) |
| LC‐I | 1.28 ± 0.04 | 1.23 ± 0.04** | |
| 1.24 ± 0.04** | 1.21 ± 0.03 ** | ||
| HV/TIV | 2.38 (0.18) | 2.05 (0.34) *** | 2.15 (0.22) |
| FAZEKAS Score | |||
| Score = 0/1/2 | 11/5/1 | 13/6/2 | 7/3/6 |
IATI score: Innotest Amyloid Tau Index (IATI) score was calculated using the formula: amyloid‐β42/[240 + (1.18xT‐tau)]).
AD, Alzheimer’s disease; CDR, Clinical Dementia Rating scale; MMSE, Mini‐Mental State examination; FCSRT, Free and Cued Selective Reminding Test, maximal score = 48, the FCSRT was not applicable (NA) in atypical AD patients due to aphasia; ROCF recall, Rey figure recall; MATTIS DRS, MATTIS Dementia Rating Scale; WAIS, Wechsler Adult Intelligence Scale; MADRS, Montgomery‐Asberg Depression Rating Scale; AChEI, acetylcholinesterase inhibitors; SSRIs, selective serotonin reuptake inhibitors; SSNIs, serotonin‐norepinephrine reuptake inhibitors; GCI, global cortical index; PiB‐PET imaging was acquired in 17 controls, 21 typical AD, and 13 atypical AD. HV/TIV, hippocampal volume normalized to the total intracranial volume.
The episodic memory score was defined by the sum of FCSRT free and total recall and Doors A test scores (maximal score = 102).
The cognitive parietal score was defined by the sum of denomination, gestural praxis, and visuo‐constructive (Rey and MATTIS figures copy) scores (maximal score = 156).
P < 0.05 between typical and atypical AD,
P ≤ 0.005 in patients versus controls,
P < 0.05 in patients versus controls.
Ethics statement
The Ethics Committee (Ile‐de‐France VI) approved the study. All the subjects provided written informed consent.
Magnetic resonance imaging and measure of LC signal intensity
A 3T MRI was performed at the Centre de Neuro‐Imagerie de Recherche (Siemens PRISMA) including (a) three‐dimensional (3D) T1‐weighted volumetric magnetization‐prepared rapid gradient echo (MP‐RAGE) sequence, (b) neuromelanin‐sensitive images acquired using two‐dimensional axial turbo spin echo T1‐weighted images that were positioned on the sagittal 3D T1‐weighted images perpendicular to the posterior border of the brainstem from the lower part of the pons to the upper part of the midbrain, covering the entire LC; (c) a Fluid Attenuated Inversion Recovery (FLAIR) sequence.
The analysis of neuromelanin‐sensitive images was performed using a previously described automated method.16 Three regions (serving as bounding boxes) were manually defined on the International Consortium for Brain Mapping template and were resampled onto the individual neuromelanin‐sensitive T1‐weighted images. The first region corresponded to the rostral pontomesencephalic area (6200 mm3) and was used as a reference region for the normalization of the signal between subjects. This normalization allowed the direct comparison of intensity values between subjects. The other regions corresponded to the bilateral regions containing the coeruleus‐subcoeruleus complexes (700 mm3 each), avoiding any other structure that could be considered as “bright” such as the substantia nigra. We used in‐house software to automatically determine the 10 brightest connected voxels bilaterally, which were considered as the LC areas.16 The appropriate location of voxels in the LC area was checked visually on each image (none was modified).
Volumetric segmentation of the hippocampi was automatically performed on the 3D T1‐weighted MP‐RAGE scans using FreeSurfer 6.0.0 (http://surfer.nmr.mgh.harvard.edu/).18 The volume measures of hippocampi were corrected using the individual total intracranial volume (TIV).
Statistical analysis
Data were analyzed using SPSS 24 (SPSS Inc, Chicago, IL, USA). We verified the Gaussian distribution of data using the Shapiro‐Wilk test. Differences between groups were assessed using analysis of covariance (ANCOVA) (age, educational level, and disease duration as covariates). We averaged the left and right values of the LC signal intensity. The correlation analyses between signal intensity in the LC and the clinical variables or PET SUVr were performed by using linear partial correlation analysis, which was corrected for age, disease duration, and educational level. The level of statistical significance was set at P < 0.05. The Bonferroni correction for multiple comparisons was used for ANCOVAs and for all correlations.
Results
Locus coeruleus signal intensity (LC‐I)
The LC‐I was lower in the whole AD group compared to controls (P < 0.001). The LC‐I was also lower in each typical and atypical AD sub‐group (P = 0.009 and P < 0.001) (Table 1, Fig. 1A and B. There was no statistical difference between typical and atypical AD patients (P = 0.089). We confirmed the absence of significant difference between both AD subgroups with an equivalence test (P = 0.000003, with a 90% confidence interval contained within the [−0.1, 0.1] interval of equivalence). The LC‐I was significantly lower in prodromal (n = 27; 1.23 ± 0.05, P = 0.001) and mild demented AD (n = 10, 1.22 ± 0.03, P = 0.001) patients compared to controls (Fig1C).
Figure 1.
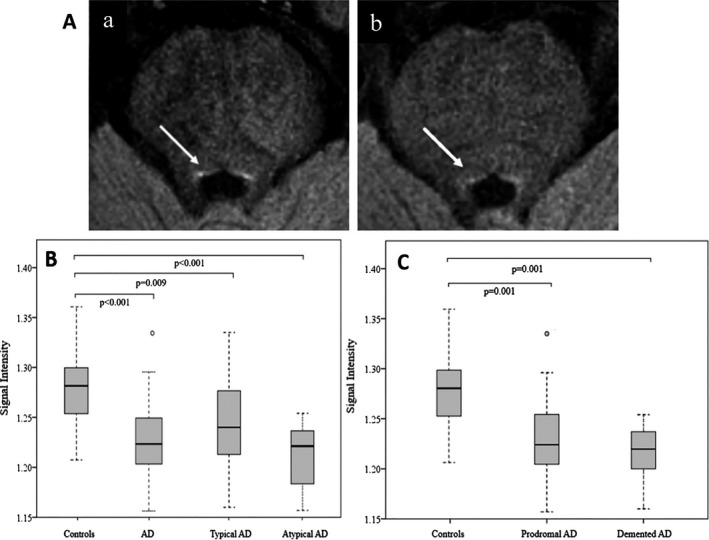
Imaging of locus coeruleus with 3T MRI and Box plot of the locus coeruleus signal intensity across groups. (A) Axial neuromelanin‐sensitive T1‐weighted images of the locus coeruleus/subcoeruleus (a) in a 64‐year‐old control and (b) in a 61‐year‐old patient with prodromal typical Alzheimer’s disease, MMSE = 27/30. The locus coeruleus area (arrows) is visible as an area of increased signal intensity. (B) Box plot of the locus coeruleus intensity in controls compared to the whole AD group (typical and atypical AD) or typical and atypical AD subgroups. (C) Box plot of the locus coeruleus intensity in controls compared to prodromal and mild demented AD subgroups. Signal intensity: normalized signal intensity in the locus coeruleus area. Plots indicate median, the boxes indicate the upper and lower quartiles. Whiskers are defined as the lowest (highest) values still within the 1.5 interquartile range from the box. AD = Alzheimer’s disease.
Correlations between the LC‐I and cognition, HV and amyloid load
No significant correlations were found between the LC‐I and age or the MMSE score.
We found no correlation between the LC‐I and MADRS score (Montgomery‐Asberg Depression Rating Scale).
As cholinergic treatment can improve neuropsychological performances, correlation analysis with cognition scores were performed in AD patients who were taking a stable dose of cholinesterase inhibitors (n = 31). In typical AD patients (n = 16), we observed significant positive correlations between the LC‐I and the episodic memory score (sum of the verbal and visual episodic memory scores; r = 0.51, P = 0.039; Fig. 2). No correlation was found with the parietal cognitive score and executive functions. In atypical AD patients (n = 15), we found no significant correlation with any cognitive score.
Figure 2.
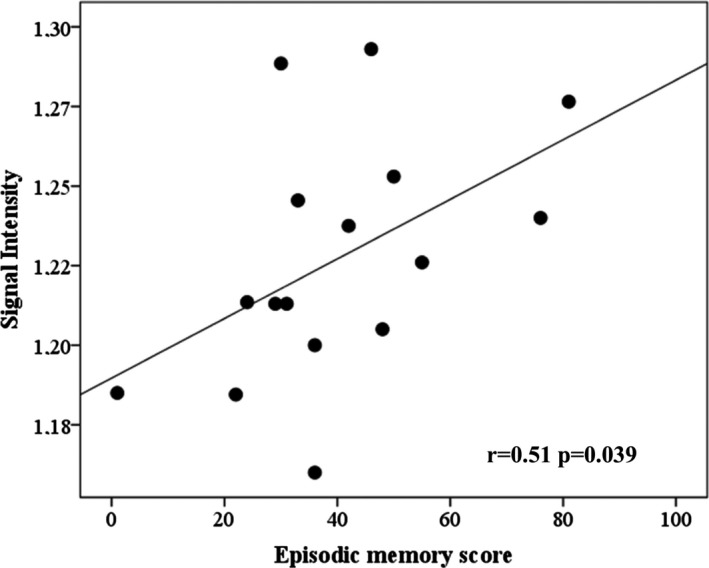
Correlation between the locus coeruleus signal intensity and memory scores in typical AD patients. Signal intensity: normalized signal intensity in the locus coeruleus area. Correlations adjusted for age, educational level, and disease duration
We verified that removing the six patients who took noradrenergic treatment did not modify our results.
No correlation was found between the LC‐I and the HV or the PIB‐PET binding.
Discussion
We investigated the LC‐I in vivo, which likely reflects LC neuronal integrity, in typical and atypical AD patients (amnesic/limbic and non‐amnesic/cortical clinical presentations). The study has two major findings: (1) LC‐I was lower in AD patients regardless of clinical presentation, from the prodromal stage, and independently of the amyloid load, (2) the LC‐I was correlated with memory performances in typical AD.
Our data are in agreement with neuropathological studies, which have all shown early LC neuronal loss but remained focused on typical AD.2, 4
We chose strict inclusion criteria based on clinical and pathophysiological AD markers (PiB‐PET and CSF biomarkers). We found no difference between the typical and atypical AD subgroups for global or regional amyloid load, as previously described.17 Because LC damage in AD could begin long before the first symptoms occur,19 we also chose strict inclusion criteria for the control subjects, who all exhibited negative PiB‐PET, to limit the risk of preclinical AD.
Unlike other previous in vivo studies in healthy controls,20, 21 we found no correlation between the LC‐I and age. Although this could be due to the low sample size and limited age range, our data are in accordance with recent neuropathological studies that have shown no age‐related cell loss in the LC.9, 22
Only few studies have investigated the LC in vivo using the paramagnetic properties of neuromelanin via MRI. Most of them concerned Parkinson’s disease, aging or psychiatric disorders.16 To the best of our knowledge, only three studies investigated the LC‐I in AD and two of them showed a decrease in LC signal, without clear conclusions regarding the involvement of the LC at the prodromal stage of the disease.23, 24, 25 These works did not use the same method as ours. First, patients were not included on clinical‐biological criteria. Second, the LC‐I signal was measured in manually defined ROIs and calculated via the ratio with the adjacent white matter.
As expected, we found correlations between the LC‐I and the memory scores in typical AD. The lack of correlation between LC‐I and cognition in the atypical AD group could be explained by the more heterogeneous cognitive profiles in this group, which was characterized by LPA and focal visuospatial deficit.
The absence of correlation between the LC‐I and PiB binding is in agreement with neuropathological studies, showing that the LC is an early target of tau pathology, without direct relationship with cortical amyloid deposition. The norepinephrine (NE) system has nevertheless been described as an important regulator of microglial functions that facilitate Aβ clearance; however, the MRI method used here does not allow direct quantification of the cortical NE depletion. Further studies are needed to determine the role of LC alteration in the pathogenesis of AD.
Taken together, this study supports the hypothesis that LC alteration plays a critical role in AD pathophysiology. It has been suggested that neurofibrillary tangles (NFT) in LC neurons may act as an initiator in the connectome‐dependent transmission of tau pathology during the progression of AD, through “prion‐like” transmission, also called “systemic propagon”.8, 10, 26, 27 In this scenario, we should have observed a correlation with the HV, which is considered as a neurodegenerative marker in AD. The LC might not be the only source of tau spreading. Some experimental studies in mice have demonstrated that the LC pathway does not exactly replicate tau spreading observed in the human AD brain.27 The relationships between LC and tauopathy deserves to be tested in vivo using new tau PET ligands in a larger longitudinal cohort.
Faced with failures of anti‐amyloid therapeutic trials in AD, it is crucial to investigate alternative models to the only amyloid cascade to develop new curative treatments. Our results suggest that targeting the LC system to promote noradrenergic signaling and to possibly prevent neurodegeneration could be an effective therapeutic strategy in AD, with a potential long window of opportunity for therapeutic intervention, as LC neurons can survive for a long time with AD pathology.10
Conflicts of Interest
The authors declare that they have no competing interests.
Authors' Contributions
PO and AM participated in data acquisition. PO analyzed the data and drafted the manuscript for intellectual content. MS, JL, and MB designed and conceptualized study, analyzed the data, and drafted the manuscript for intellectual content. SL, RV, FC, and PG interpreted the data and revised the manuscript for intellectual content. All authors read and approved the final version of the manuscript.
Acknowledgments
The authors would like to thank chemical/radiopharmaceutical and nursing staff of Service Hospitalier Frederic Joliot for the synthesis of [11C]‐PIB and patient management, the team of CENIR (Centre de Neuroimagerie de Recherche) in Salpetriere Hospital for patient management during the MRI acquisition. The work was partly supported by grants from the Investissements d'Avenir, IAIHU‐06 (Paris Institute of Neurosciences – IHU), and ANR‐11‐INBS‐0006. The authors gratefully acknowledge la Fondation pour la Recherche. PO has obtained a grant from La Fondation pour la Recherche médicale (FRM : DEA 41203).
Funding information
French Health Ministry under reference (2013‐0919), CEA (reference 100033), and Fondation pour la recherche sur Alzheimer, France Alzheimer. PET imaging has been partially funded by Institut de Recherches International Servier, Center for Therapeutic Innovation in Neuropsychiatry.
Funding Statement
This work was funded by French Health Ministry grant 2013-0919; Institut de Recherches International Servier grant ; Association France Alzheimer grant ; Fondation pour la recherche sur Alzheimer grant ; CEA grant 100033.
References
- 1. Arendt T, Brückner MK, Morawski M, et al. Early neurone loss in Alzheimer’s disease: cortical or subcortical? Acta Neuropathol Commun 2015;3:10. [DOI] [PMC free article] [PubMed] [Google Scholar]
- 2. Grudzien A, Shaw P, Weintraub S, et al. Locus coeruleus neurofibrillary degeneration in aging, mild cognitive impairment and early Alzheimer’s disease. Neurobiol Aging 2007;28:327–335. [DOI] [PubMed] [Google Scholar]
- 3. Zarow C, Lyness SA, Mortimer JA, Chui HC. Neuronal loss is greater in the locus coeruleus than nucleus basalis and substantia nigra in Alzheimer and Parkinson diseases. Arch Neurol 2003;60:337–341. [DOI] [PubMed] [Google Scholar]
- 4. Kelly SC, He B, Perez SE, et al. Locus coeruleus cellular and molecular pathology during the progression of Alzheimer’s disease. Acta Neuropathol Commun 2017;5:8. [DOI] [PMC free article] [PubMed] [Google Scholar]
- 5. Šimić G, Leko MB, Wray S, et al. Monoaminergic neuropathology in Alzheimer’s disease. Prog Neurogibol 2017;151:101–138. [DOI] [PMC free article] [PubMed] [Google Scholar]
- 6. Braak H, Thal DR, Ghebremedhin E, Del Tredici K. Stages of the pathologic process in Alzheimer disease: age categories from 1 to 100 years. J Neuropathol Exp Neurol 2011;70:960–969. [DOI] [PubMed] [Google Scholar]
- 7. Braak H, Del Tredici K. Alzheimer’s pathogenesis: is there neuron‐to‐neuron propagation? Acta Neuropathol 2011;121:589–595. [DOI] [PubMed] [Google Scholar]
- 8. Eisele YS, Duyckaerts C. Propagation of Aß pathology: hypotheses, discoveries, and yet unresolved questions from experimental and human brain studies. Acta Neuropathol 2016;131:5–25. [DOI] [PubMed] [Google Scholar]
- 9. Theofilas P, Ehrenberg AJ, Dunlop S, et al. Locus coeruleus volume and cell population changes during Alzheimer’s disease progression: A stereological study in human postmortem brains with potential implication for early‐stage biomarker discovery. Alzheimers Dement 2017;13:236–246. [DOI] [PMC free article] [PubMed] [Google Scholar]
- 10. Weinshenker D. Long road to ruin: noradrenergic dysfunction in neurodegenerative disease. Trends Neurosci 2018;41:211–223. 10.1016/j.tins.2018.01.010. [DOI] [PMC free article] [PubMed] [Google Scholar]
- 11. Heneka MT, Nadrigny F, Regen T, et al. Locus ceruleus controls Alzheimer’s disease pathology by modulating microglial functions through norepinephrine. Proc Natl Acad Sci USA 2010;107:6058–6063. [DOI] [PMC free article] [PubMed] [Google Scholar]
- 12. Hammerschmidt T, Kummer MP, Terwel D, et al. Selective loss of noradrenaline exacerbates early cognitive dysfunction and synaptic deficits in APP/PS1 mice. Biol Psychiatry 2013;73:454–463. [DOI] [PMC free article] [PubMed] [Google Scholar]
- 13. Sara SJ. The locus coeruleus and noradrenergic modulation of cognition. Nat Rev Neurosci 2009;10:211–223. [DOI] [PubMed] [Google Scholar]
- 14. Keren NI, Taheri S, Vazey EM, et al. Histologic validation of locus coeruleus MRI contrast in post‐mortem tissue. NeuroImage 2015;113:235–245. [DOI] [PMC free article] [PubMed] [Google Scholar]
- 15. Keren NI, Lozar CT, Harris KC, et al. In vivo mapping of the human locus coeruleus. NeuroImage 2009;47:1261–1267. [DOI] [PMC free article] [PubMed] [Google Scholar]
- 16. García‐Lorenzo D, Longo‐Dos Santos C, Ewenczyk C, et al. The coeruleus/subcoeruleus complex in rapid eye movement sleep behaviour disorders in Parkinson’s disease. Brain 2013;136:2120–2129. [DOI] [PMC free article] [PubMed] [Google Scholar]
- 17. de Souza LC, Corlier F, Habert M‐O, et al. Similar amyloid‐β burden in posterior cortical atrophy and Alzheimer’s disease. Brain 2011;134:2036–2043. [DOI] [PubMed] [Google Scholar]
- 18. Fischl B, Salat DH, Busa E, et al. Whole brain segmentation: automated labeling of neuroanatomical structures in the human brain. Neuron 2002;33:341–355. [DOI] [PubMed] [Google Scholar]
- 19. Braak H, Del Tredici K. Where, when, and in what form does sporadic Alzheimer’s disease begin? Curr Opin Neurol 2012;25:708–714. [DOI] [PubMed] [Google Scholar]
- 20. Liu KY, Acosta‐Cabronero J, Cardenas‐Blanco A, et al. In vivo visualization of age‐related differences in the locus coeruleus. Neurobiol Aging 2019;74:101–111. [DOI] [PMC free article] [PubMed] [Google Scholar]
- 21. Shibata E, Sasaki M, Tohyama K, et al. Age‐related changes in locus ceruleus on neuromelanin magnetic resonance imaging at 3 Tesla. Magn Reson Med Sci 2006;5:197–200. [DOI] [PubMed] [Google Scholar]
- 22. Ohm TG, Busch C, Bohl J. Unbiased estimation of neuronal numbers in the human nucleus coeruleus during aging. Neurobiol Aging 1997;18:393–399. [DOI] [PubMed] [Google Scholar]
- 23. Takahashi J, Shibata T, Sasaki M, et al. Detection of changes in the locus coeruleus in patients with mild cognitive impairment and Alzheimer’s disease: high‐resolution fast spin‐echo T1‐weighted imaging. Geriatr Gerontol Int 2015;15:334–340. [DOI] [PMC free article] [PubMed] [Google Scholar]
- 24. Dordevic M, Müller‐Fotti A, Müller P, et al. Optimal cut‐off value for locus coeruleus‐to‐pons intensity ratio as clinical biomarker for Alzheimer’s disease: a pilot study. J Alzheimers Dis Rep 2017;1:159–167. [DOI] [PMC free article] [PubMed] [Google Scholar]
- 25. Miyoshi F, Ogawa T, Kitao SI, et al. Evaluation of Parkinson disease and Alzheimer disease with the use of neuromelanin MR imaging and (123)I‐metaiodobenzylguanidine scintigraphy. AJNR Am J Neuroradiol 2013;34:2113–2118. [DOI] [PMC free article] [PubMed] [Google Scholar]
- 26. Satoh A, Iijima KM. Roles of tau pathology in the locus coeruleus (LC) in age‐associated pathophysiology and Alzheimer’s disease pathogenesis: potential strategies to protect the LC against aging. Brain Res 2019;1702:17–28. 10.1016/j.brainres.2017.12.027. [DOI] [PubMed] [Google Scholar]
- 27. Iba M, McBride JD, Guo JL, et al. Tau pathology spread in PS19 tau transgenic mice following locus coeruleus (LC) injections of synthetic tau fibrils is determined by the LC’s afferent and efferent connections. Acta Neuropathol 2015;130:349–362. [DOI] [PMC free article] [PubMed] [Google Scholar]