

Abstract
A substantial body of work supports the existence of a general psychopathology factor (“p”). Psychometrically, this is important because it implies that there is a psychological phenomenon (overall psychopathology) that can be measured and potentially used in clinical research or treatment. The present study aimed to construct, calibrate, and begin to validate a computerized adaptive (CAT) screener for “p”. In a large community sample (N = 4544; age 11 - 21), we modeled 114 clinical items using a bifactor multidimensional item response theory (MIRT) model and constructed a fully functional (and public) CAT for assessing “p” called the Overall mental illness (OMI) screener. In a random, non-overlapping sample (N = 1019) with extended phenotyping (neuroimaging) from the same community cohort, adaptive versions of the OMI screener (10-, 20-, and 40-item) were simulated and compared to the full 114-item test in their ability to predict demographic characteristics, common mental disorders, and brain parameters. The OMI screener performed almost as well as the full test, despite being only a small fraction of the length. For prediction of 13 mental disorders, the mid-length (20-item) adaptive version showed mean area under the receiver operating characteristic curve of 0.76, compared to 0.79 for the full version. For prediction of brain parameters, mean absolute standardized relationship was 0.06 for the 20-item adaptive version, compared to 0.07 for the full form. This brief, public tool may facilitate the rapid and accurate measurement of overall psychopathology in large-scale studies and in clinical practice.
Keywords: Psychopathology, Computer Adaptive Testing, Item Response Theory, Psychometrics, Validation, Clinical Screen
While psychiatric disorders are generally conceptualized as distinct but overlapping clusters of symptoms, such as embodied in the Diagnostic and Statistical Manual of the American Psychiatric Association (American Psychiatric Association, 2011), there is an accumulating body of work supporting the existence of a general psychopathology factor (“p”) (Caspi et al., 2014). The discovery of the p factor was presaged by the overwhelming comorbidity consistently found among mental disorders (Kessler et al., 2005), and indeed, most factor analyses of psychopathology data find that the higher-order classifications of psychopathologies (e.g. internalizing, externalizing, etc.) are themselves correlated. For example, Krueger (1999), Krueger et al. (1998), and others have shown that mental disorders can usually be grouped into three correlated dimensions: externalizing, anxious-misery, and fear. Our clinical interview included a fourth disorder type, Psychosis, for a total of 4 factors.
An important takeaway from the above is that endorsement of any psychopathological symptom increases the probability of endorsement of any other symptom, regardless of whether the symptoms are part of the same disorder (or even higher-order domain). Psychometrically this is important because it implies that there is a psychological phenomenon (overall psychopathology) that can be measured and potentially used in clinical research or treatment. Despite the overwhelming evidence for the existence of “p”, at present it is usually measured by aggregating responses across extensive, time-consuming clinical interviews. In other domains including cognitive assessment and “high-stakes” testing (e.g. Graduate Record Examinations), modern measurement tools such as item response theory (IRT) and computerized adaptive testing (CAT) provide nearly-equivalent accuracy in a fraction of the time. Despite this, the considerable advantages of such procedures have not been applied to the measurement of “p”.
IRT (Embretson and Reise, 2009,Lord, 1980) is a psychometric method that focuses on various characteristics of individual test or scale items (rather than a test/scale as a whole). One of the most common IRT models is the 2-parameter model described by the following equation:
| (1) |
Where pi(θ) is the probability of endorsement (or a correct response, in the case of cognitive testing), ai is the item discrimination, bi is the item difficulty, and θ is the trait level of the person (in our case, overall mental illness, OMI). The discrimination parameter, ai, determines how precisely the item can place an individual on a trait spectrum; higher discrimination is always better. The difficulty parameter, bi, determines how high on the latent trait continuum one has to be in order to have a 50% chance of endorsing the item. For example, a depression item that asked about current plans to commit suicide would presumably be a “difficult” item because one would need to be fairly high on the Depression continuum to endorse that item. The more likely an item is to be endorsed at any given trait level, the lower its difficulty (i.e. the “easier” it is).
Because we anticipated the item response data analyzed here to be multidimensional, we used multidimensional IRT (MIRT) (Edwards et al., 2014, Reckase, 2009), an extension that allows modeling of multiple dimensions simultaneously. The unidimensional model shown in Eq. 1 can be expanded to account for multiple dimensions as follows:
| (2) |
Where pi(x=1) is the probability of a correct response, ai1 is the item discrimination for dimension 1, ai2 is the item discrimination for dimension 2, bi1 is the item difficulty for dimension 1, bi2 is the item difficulty for dimension 2, θ1 is the ability level of the person on dimension 1, and θ2 is the ability level of the person on dimension 2. This model can be expanded to account for as many dimensions as necessary and in almost any structural configuration necessary. Here, because we wanted to model not only the multiple dimensions but also a single overall (“general”) factor, we used a specific type of MIRT model configuration called a bifactor model (Reise, Steven P., 2012,Reise, Steven P. et al., 2010). In a bifactor model, items load on up to two factors simultaneously—their own “specific” factor (e.g. “internalizing symptoms”) and a general factor (OMI). The bifactor model allows accurate estimation of item parameters on the overall factor in the presence of multidimensionality, which can cause biased discrimination parameter estimates if ignored (Reise, S. P. et al., 2015,Reise, Steven P. et al., 2011).
An advantage of IRT (in this case, MIRT) is that its emphasis on individual items allows using the parameter estimates produced by the model to assess the overall quality of the items. Here, “quality” is determined by the amount of information provided by the item at any given trait level, where information is represented by the following equation:
| (3) |
Where I(θ) is the information produced by the item, ai is the item discrimination, pi(θ) is the probability of endorsement, and qi(θ) is the probability of non-endorsement. Three key features are notable about this equation. First, as ai goes up, information always goes up, thus higher discrimination parameters are always good. Second, the amount of information provided by the item differs by person. For example, keeping ai constant at 1.0, a person low on the trait might have pi(θ) = 0.1 and qi(θ) = 0.9, for total information of 0.1*0.9 = 0.09, while a person slightly higher on the trait might have pi(θ) = 0.2 and qi(θ) = 0.8, for total information of 0.2*0.8 = 0.16. Finally, all items produce maximum information when administered to a person with a 50% probability of endorsement—i.e. where bothpi(θ) and qi(θ) are 0.5. An implication of this last point is that items provide maximum information when administered to someone whose trait level (θ) is the same as the item difficulty (bi).
These parameters pave the way for arguably one of the most groundbreaking applications of IRT, computerized adaptive testing (CAT) (Weiss and Kingsbury, 1984,Wainer and Dorans, 2000), which we have previously used to develop short and adaptive forms of cognitive and clinical tests (Moore et al., 2018,Moore et al., 2015,Roalf, Moore et al., 2016). In CAT, after the first item-administration (and response), a scoring algorithm estimates the examinee’s trait level, and based on this rough estimate, chooses the most appropriate next item to administer, where “most appropriate” is determined by how much information it will provide. After this next item administration (and response), the algorithm then uses both item responses to estimate the examinee’s ability. Then the next most appropriate item is selected, and so on. The test stops when some stopping criterion is met—e.g. when the examinee’s standard error of measurement reaches some lower bound. A step-by-step example of the CAT item-selection process is provided in the Supplement. Note that because IRT scoring is based on the item parameters (ai and bi), endorsement of an “easy” item will affect a person’s score differently than endorsement of a “difficult” item. Because all items were calibrated in the same model (the bifactor MIRT model described above), examinees can be scored on the same scale even if the sets of items administered to each examinee are completely non-overlapping. This feature is especially useful for longitudinal studies, where item repetition can be problematic.
The purpose of the present study was to develop and validate a CAT assessment of overall mental illness (OMI). To do so, we calibrated a set of 114 clinical items for use as an item bank for CAT assessment. Then, we examined the external validity of scores from this adaptive OMI assessment, compared to validity of scores on the full 114-item scale. Multiple criteria were used for predictive validity assessment, including demographic information, environmental experiential information (e.g. neighborhood crime rates), and multimodal brain parameters (volume, cerebral blood flow, and fractional anisotropy). The brain areas selected for use as validity criteria were based on established research suggesting relationships among multiple psychopathologies and the amygdala (Bogerts et al., 1993,Cullen et al., 2014,Feinstein et al., 2013,Oler et al., 2016,Rajarethinam et al., 2001,Siegle et al., 2007,Sterzer et al., 2007), anterior insula (Alvarez et al., 2015,Makris et al., 2006,Moran et al., 2013,Paulus and Stein, 2006,Penner et al., 2016,Senatorov et al., 2014,Uddin and Menon, 2009), and hippocampus (Bogerts et al., 1993,Bois et al., 2015,Bremner et al., 2000,Erk et al., 2014,Kwon, 2003,Plessen et al., 2006,Videbech and Ravnkilde, 2004). Similarly, fractional anisotropy of the cingulate gyrus (Han et al., 2013,Nakamae et al., 2008,Peterson et al., 2011,Wang, Fei et al., 2004), superior longitudinal fascicles (Bennett et al., 2013,Harris et al., 2008,Svatkova et al., 2016,Zou et al., 2008), and the uncinate fasciculus (Kitis et al., 2012,Konrad et al., 2010,Kubicki et al., 2002,Phan et al., 2009,Sarkar et al., 2012,Von Der Heide, R J et al., 2013,Zarei et al., 2011) have been implicated in diverse psychopathologies. Consequently, we used volume and cerebral blood flow (CBF) of the amygdala, anterior insula, and hippocampus, and we used fractional anisotropy (FA) of the cingulate gyrus, superior longitudinal fascicles, and uncinate fasciculus. We also selected an fMRI measure of activation of the anterior insula during a working memory task. Task-Activation in various brain regions during functional MRI has been implicated in numerous psychiatric disorders, including depression (Smith et al., 2011), bipolar depression (Marchand et al., 2007), psychosis (Fusar-Poli et al., 2011), anorexia (Castro-Fornieles et al., 2010), and others (Dibbets et al., 2010).
Specific predictions related to the above validity analyses were as follows: 1) OMI will be negatively associated with mother’s education, positively associated with trauma exposure, and unrelated to age; 2) OMI will be negatively related to neighborhood SES and positively related to neighborhood crime rates; 3) OMI will be positively associated with resting CBF and negatively associated with regional brain volumes and FA; 4) OMI will be negatively associated with activation of the anterior insula during a working memory task.
Method
Participants
Participants in this study were from the Philadelphia Neurodevelopmental Cohort (PNC), which has been described in detail elsewhere (Calkins et al., 2015). Briefly, the PNC is a community sample of N = 9498 individuals age 8 – 21 years (mean = 14.2), 51.7% female, 55.8% European American, 32.9% African-American, from the greater Philadelphia area. In the present study, age range was limited to 11 – 21 (participants age 8 – 10 were not directly interviewed), and the sample was randomly split into calibration and validation samples. Table 1 shows the demographic characteristics and clinical diagnosis rates for these samples, as well as the combined (full) sample for the study. As expected in a community sample, rates of clinical diagnoses in this age range mostly reflect national rates. For example, depression, obsessive-compulsive disorder, panic disorder, and ADHD have lifetime prevalence rates (Table 1) of 15%, 3%, 2%, and 16%, respectively. These (and other diagnostic proportions in Table 1) approximate those found by others in the US (Merikangas et al., 2010).
Table 1.
Clinical Diagnostic Rates and Demographic Characteristics of Samples
| Characteristic | Full Sample | Calibration Sample | Validation Sample |
|---|---|---|---|
| N | 5563 | 4544 | 1019 |
| Mean Age, years (SD) | 15.7 (2.6) | 15.7 (2.7) | 15.7 (2.5) |
| Proportion Female | 0.54 | 0.54 | 0.52 |
| Proportion European-American | 0.57 | 0.6 | 0.45 |
| Proportion African-American | 0.32 | 0.3 | 0.45 |
| Proportion Other Race | 0.11 | 0.1 | 0.1 |
| Mean Maternal Edu, years (SD) | 14.4 (2.4) | 14.5 (2.4) | 14.2 (2.4) |
| Depression, prop. | 0.15 | 0.14 | 0.17 |
| GAD, prop. | 0.03 | 0.03 | 0.02 |
| Psychosis Risk, prop.† | 0.25 | 0.24 | 0.33 |
| Mania, prop. | 0.01 | 0.01 | 0.01 |
| Separation Anxiety, prop. | 0.04 | 0.04 | 0.04 |
| Specific Phobia, prop. | 0.30 | 0.30 | 0.31 |
| Social Phobia/Anxiety, prop. | 0.23 | 0.22 | 0.27 |
| Panic Disorder, prop. | 0.02 | 0.02 | 0.01 |
| Agoraphobia, prop. | 0.06 | 0.06 | 0.08 |
| OCD, prop. | 0.03 | 0.03 | 0.03 |
| ADD, prop. | 0.16 | 0.15 | 0.17 |
| ODD, prop. | 0.33 | 0.33 | 0.37 |
| Conduct Disorder, prop. | 0.07 | 0.07 | 0.11 |
Note. SD = standard deviation; prop. = proportion; Edu = education; GAD = generalized anxiety disorder; OCD = obsessive-compulsive disorder; ADD = attention deficit disorder; ODD = oppositional defiant disorder;
Psychosis Risk is not a diagnosis as such, but rather, comparable to Clinical High Risk reported in other studies.
Measures
Clinical.
The clinical assessment used in the PNC has been described in detail elsewhere (Calkins et al., 2015,Calkins et al., 2014). Briefly, psychopathology was assessor administered using a computerized, structured interview (GOASSESS), which was abbreviated and modified from the NIMH Genetic Epidemiology Research Branch Kiddie-SADS (Merikangas et al., 2009). The interview included a timeline of life events, demographics and medical history, psychopathology screen, Children’s Global Assessment Scale (C-GAS) (Shaffer, 1983), and interviewer observations. Items for the current investigation were 114 dichotomous items drawn from the psychopathology screen. These items assessed psychiatric and psychological treatment history, and lifetime occurrence of major domains of psychopathology including psychosis, mood (major depressive episode, manic episode), anxiety (generalized anxiety disorder, separation anxiety disorder, specific phobia, social phobia, panic disorder, agoraphobia, obsessive-compulsive disorder, post-traumatic stress disorder), attention deficit/hyperactivity disorder (ADHD), behavioral (oppositional defiant disorder, conduct disorders), eating disorders (anorexia, bulimia), and suicidal thinking and behavior. Computerized algorithms assigned rankings reflecting DSM-IV categories of each psychopathology domain based on endorsement of contributing items by either the proband or collateral (behavioral domains), or by the proband (all other domains). Psychopathology categories were considered significant if sufficient symptoms were endorsed with frequency and duration approximating DSM-IV disorder or episode criteria, accompanied by significant distress or impairment rated ≥ 5 on an 11 point.
In addition, two screening tools to assess subthreshold psychosis spectrum symptoms were embedded within the psychopathology screen (Calkins et al., 2014). First, positive subpsychotic symptoms were assessed using the PRIME Screen-Revised [PS-R (Kobayashi et al., 2008,Miller et al., 2004)] which contains 12 items rated on a 7-point Likert scale (Extremely Disagree to Extremely Agree) and which were split dichotomously for the current analyses. Second, negative/disorganized symptoms were assessed using six assessor-rated subscales of the Scale of Prodromal Symptoms (SOPS) from the Structured Interview for Prodromal Syndromes (SIPS v. 4.0) (Miller et al., 2003): Avolition; Expression of Emotion; Experience of Emotions and Self; Occupational Functioning; Trouble with Focus and Attention; Disorganized Communication. Ratings on the SOPS were based on selected closed (yes/no) questions from the SIPS, which were used in the present investigation.
Neuroimaging.
Neuroimaging acquisition, processing, and quality assurance has been described in detail elsewhere (Satterthwaite, Theodore D. et al., 2016,Satterthwaite, Theodore D. et al., 2014). Briefly, 1,601 youth who completed clinical and cognitive assessment as part of the PNC also completed multi-modal neuroimaging (Satterthwaite et al., 2014,Satterthwaite et al., 2016). All participants were imaged at a single site using the same scanner (Siemens 3T Tim Trio; 32 channel head coil). Imaging sequences provided complementary information regarding brain structure, organization, metabolism, and function. A T1-weighted image provided information regarding brain structure (Satterthwaite, Theodore D., Wolf et al., 2016,Rosen et al., 2018); an arterial-spin labeled (ASL) image provided an estimate of cerebral perfusion (Kaczkurkin et al., 2017,Satterthwaite, T. D. et al., 2014); a diffusion-weighted image provided information regarding white matter microstructure (Roalf, Quarmley et al., 2016,Vandekar et al., 2015). Finally, a fractal version of the n-back working memory task provided information regarding functional responses to working memory load, with the contrast of interest being 2-back versus 0-back (Satterthwaite, T. D. et al., 2013,Shanmugan et al., 2016). All image processing and quality assurance is as previously described. In order to derive consistent regional summary measures across sequences, the structural image was segmented using an advanced multi-atlas labelling procedure with joint label fusion (Wang, H. et al., 2013,Wang, Hongzhi and Yushkevich, 2013). Within these regions, volume (from the T1 image), cerebral blood flow (from the ASL image), fractional anisotropy (from the diffusion image), and activation to working memory load (from the n-back task) was measured. To reduce multiple comparisons, specific regions with previously-described associations with overall psychopathology were selected for further analysis.
Geographic/Environmental.
Two measures used here—“Neighborhood SES” and “Neighborhood Crime”—are based on census and crime data linked to participants’ block groups. The methods and analyses used to derive these scores are detailed in Moore et al. (2016). Briefly, Neighborhood SES comprises census variables reflective of socio-economic status in that area—e.g. median family income, percent of residents who are married, percent of residents who are in poverty, percent of real estate lots that are vacant, etc. Higher values of Neighborhood SES indicate higher SES. Neighborhood Crime comprises rates (per 100 people) of 49 crimes in each block group—e.g. robbery, aggravated assault, arson, etc. Higher values of Neighborhood Crime indicate more crime in that participant’s living environment.
Analysis
First, a validation sample (N = 1019) was selected (based on whether they had neuroimaging) and set aside for validation purposes (see below); all non-validation analyses described below were therefore run on the remaining (N = 4544) participants meeting age criteria after removing the validation sample. In preparation for the bifactor IRT model, we conducted an exploratory factor analysis (EFA) on the 114 psychopathology items based on the matrix of tetrachoric inter-item correlations (within the psych package in R). The number of factors to extract (4) was determined by theory, as described above. Shanmugan et al (2016) performed a nearly identical analysis on a super-set of these data using 112 items instead of 114, and they found that the four-factor solution cleanly replicates previous literature, with the 4 factors being anxious-misery, fear, psychosis, and externalizing.
The EFA results were used to assign items to factors for the bifactor IRT model—specifically, a bifactor 2-parameter logistic (2PL) model (Gibbons and Hedeker, 1992,Gibbons et al., 2007) implemented in the mirt package (Chalmers, 2012) in R using Bock-Aitkin expectation-maximization (BAEM) estimation (Bock and Aitkin, 1981). Parameter estimates from the bifactor general factor (OMI) were used as the final CAT parameters for the 114-item bank. That is, with the bifactor model estimated, discrimination parameter estimates from the general factor only were used in a unidimensional 2-parameter model along with the intercepts (transformed to traditional difficulty parameters) from the bifactor model (Weiss and Gibbons, 2007).
Parameter estimates for the item bank were entered into Firestar (Choi, 2009), a CAT-simulation program. CAT administrations were then simulated in the validation sample (N = 1019) to determine what would have happened if these participants had been administered an adaptive version of the full clinical interview. CAT simulations were set to stop after 10, 20, and 40 items (regardless of standard error of measurement), and participants thus received three scores corresponding to a 10-item, 20-item, and 40-item CAT. Full 114-item scores were also examined for comparison. Note that most CATs use the standard error of measurement to determine when to stop—i.e. an examinee is administered items until his/her standard error of measurement has reached an acceptably low level, and different examinees can thus receive different numbers of items. However, a problem with the SE-based approach is that it is difficult to predict how long the test will take—e.g. some examinees might reach the stopping rule threshold after only 10 items, while others must answer 20 items before reaching the stopping threshold. The difficulty in predicting administration time is not a major problem in clinical practice, but in large-scale genomic studies requiring precise scheduling of study participants’ time, the variability in administration time using the SE-based stopping rule might be unacceptable. We therefore use the fixed-length stopping rule here, although the stopping rule can easily be changed in the CAT program (see below and Supplement). To be clear, the 10-, 20-, and 40-item “short forms” are administered adaptively—i.e. individuals receive different sets of items depending on their response patterns—but the length of the test is fixed.
Finally, scores from the CAT simulations described above were related to clinical categories, demographic variables, and brain parameters. For clinical categories, receiver operating characteristic (ROC) curve analysis was performed to compare the sensitivity and specificity of the four scores (10-item CAT, 20-item CAT, 40-item CAT, and full test). For demographic and brain parameters, Pearson correlations were used to compare test scores. Significance of differences among these correlations was determined by bootstrapped confidence intervals of the difference (Efron and Tibshirani, 1986). Note that for the clinical categories, many items used in the OMI adaptive screener are identical to the items used in the diagnosis process itself, and the ROC results are therefore inflated (sometimes highly). However, the goal of this analysis is not to test whether the adaptive screener is sufficient for diagnosis, but rather to compare the (albeit inflated) ROC results for the adaptive versions with the ROC results from the full 114-item version. All results from this analysis will be inflated (including for the full version), making them useful only for comparison across forms. A related goal is to examine how the relationships of OMI scores to diagnoses change as items are added—e.g. as items are added, does the OMI score correlate more and more highly with a particular disorder?
Building the CAT-OMI for Public Release
The adaptive OMI for public use was built using the free, open-source software Concerto (Scalise and Allen, 2015). Information about how to install and use Concerto is provided in the Supplementary Materials, and the test itself is provided in the Supplementary .json file.
Results
Supplementary Table S1 shows the 4-factor EFA solution based on tetrachoric correlations, along with item text. As anticipated, the item groupings make theoretical and clinical sense; specifically, F1 = Externalizing, F2 = Anxious-Misery, F3 = Psychosis, and F4 = Fear.
Supplementary Table S2 shows the IRT parameter estimates (normal metric) for the bifactor model estimated using item assignment based on the EFA described above. Supplementary Table S3 shows the same results where item discrimination parameters have been converted to factor analysis loadings (standardized item-trait correlations). Discrimination parameter estimates were highest for items MAN002 (“Has there ever been a time when you felt so full of energy that you couldn’t stop doing things and didn’t get tired?”) and MAN004 (“Have there been times when you … couldn’t stop talking … or had so many ideas in your head that you could hardly keep track of them?”), whereas they were the lowest for items PHB005 (“Have you ever been very nervous or afraid of doctors, needles, or blood?”) and PHB002 (“Have you ever been very nervous or afraid of being in really high places, like a roof or tall building?”). Difficulty parameter estimates were highest for items CDD011 (“Have you ever tricked or threatened someone into having sex with you…?”) and CDD010 (“Have you ever attacked someone to steal from them?”), and the lowest for items PHB001 and GAD001 (“Have you ever been a worrier?”). Average discrimination across the whole item bank was 0.84 (range = 0.26 – 1.94), and average difficulty was 1.15 (range = −0.04 – 2.79).
All results described below are from analyses performed using the validation sample (N = 1019). Supplementary Table S4 shows the results of the ROC analysis examining the ability of the adaptive scores and the full version to predict diagnosis on 13 psychological disorders, as well as the Global Assessment Scale (GAS), and Figure 1 shows these results graphically (ordered by AUC of the full form). For the shortest (10-item) adaptive version, AUC is highest for mania and panic disorder, and lowest for specific phobia, ADD, and separation anxiety. For the 20-item adaptive version, AUC is highest for mania and OCD, and lowest for specific phobia, ADD, and separation anxiety. For the 40-item version, the AUC is highest for OCD and panic disorder, and lowest for specific phobia and separation anxiety. Finally, for the full form, AUC is highest for OCD and depression, and lowest for specific phobia and ADD. Overall, as items are added, AUC increases for all disorders except mania and GAD, both of which remain about the same regardless of the number of items. When the adaptive and full forms are compared, the full form AUC is significantly higher than all adaptive forms for separation anxiety, specific phobia, social anxiety, conduct disorder, agoraphobia, and psychosis. For the remaining seven disorders (ADD, ODD, GAD, depression, mania, OCD, and panic disorder), at least one of the adaptive forms shows no significant difference from the full form. For GAD and mania specifically, all adaptive forms are statistically indistinguishable from the full form.
Figure 1.
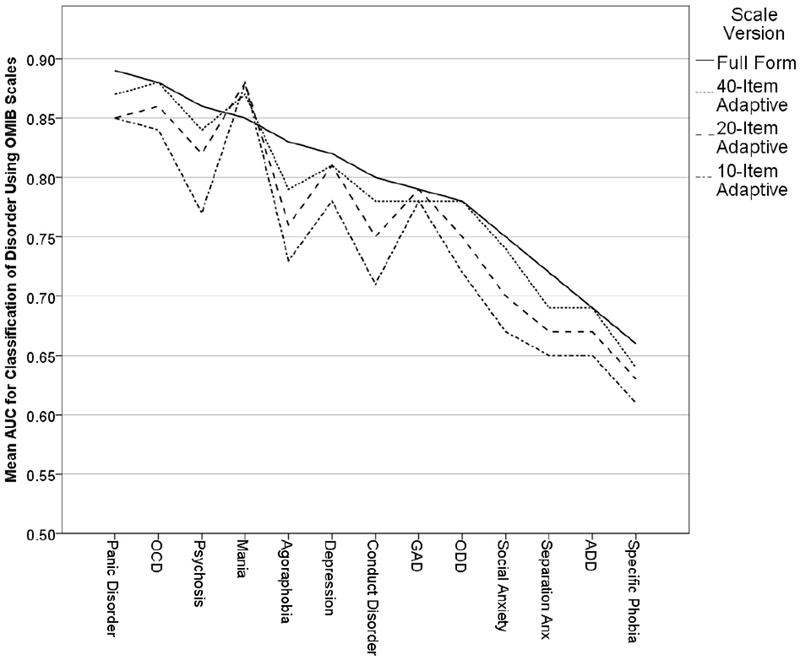
Areas Under the Receiver Operating Characteristic Curves for Prediction of 13 Common Mental Disorders Using the Full and Adaptive Versions of the OMI Screener.
Note. OCD = Obsessive-Compulsive Disorder; GAD = Generalized Anxiety Disorder; ODD = Oppositional Defiant Disorder; Anx = Anxiety; ADD = Attention Deficit Disorder.
Table 2 shows the correlations of the adaptive and full OMI scores with demographic-experiential and brain parameters. Mother’s education, neighborhood SES, and trauma exposure all show significant relationships with all OMI forms (including full). Significant differences between the correlations of the full form and adaptive forms were found for three of the five demographic-experiential variables. Specifically, the full form correlated more strongly than all three adaptive forms with mother’s education, neighborhood SES, and trauma exposure. For age and neighborhood crime, there were no significant differences between the full and adaptive forms.
Table 2.
Correlations of Demographic, Environmental, and Brain Variables with Three Adaptive Versions of the Clinical Screener for Overall mental illness.
| Adaptive Versions |
||||
|---|---|---|---|---|
| Variable | 10-Item | 20-Item | 40-Item | Full (114-Item) |
| Age | −0.011 | −0.028 | −0.020 | −0.025 |
| Mother’s Edu | −0.097* | −0.127* | −0.128* | −0.148 |
| Neighborhood SES | −0.141* | −0.185* | −0.205* | −0.227 |
| Neighborhood Crime | 0.016 | 0.042 | 0.044 | 0.054 |
| Trauma Exposure | 0.307* | 0.340* | 0.354* | 0.378 |
| Brain Measures | ||||
| Amygdala (volume) | −0.034* | −0.061 | −0.060* | −0.079 |
| Amygdala (CBF) | 0.049 | 0.050 | 0.060 | 0.060 |
| A Insula (volume) | −0.044* | −0.073* | −0.076* | −0.101 |
| A Insula (CBF) | 0.043 | 0.029 | 0.032 | 0.026 |
| A Insula (task activation) | −0.078 | −0.085 | −0.092 | −0.101 |
| Hippocampus (volume) | −0.044* | −0.088 | −0.082* | −0.099 |
| Hippocampus (CBF) | 0.061 | 0.055 | 0.057 | 0.055 |
| Cingulate Gyrus (FA) | −0.038 | −0.033 | −0.032 | −0.027 |
| Sup Longitudinal Fasciculus (FA) | −0.062 | −0.065 | −0.071 | −0.080 |
| Uncinate Fasciculus (FA) | −0.093 | −0.097 | −0.101 | −0.102 |
Note. Significant effects bolded;
indicates that the correlation is significantly different from the correlation of the full form (rightmost column);
indicates that the correlation is significantly different from the correlation with the full form, but neither correlation is significantly different from 0; SES = socioeconomic status; CBF = cerebral blood flow; A = anterior; FA = fractional anisotropy; Sup = superior.
For correlations with brain parameters, regional volume showed significant correlations with OMI scores for the amygdala (full form only), anterior insula (20-item, 40-item, and full form), and hippocampus (20-item, 40-item, and full form). Regional CBF did not show any significant relationships with OMI scores. Regional FA showed significant correlations with OMI scores for the superior longitudinal fasciculus (40-item and full form) and uncinated fasciculus (all forms). Finally, task activation of the anterior insula showed significant relationships with the OMI for all forms. For the brain variables listed in Table 2, no significant differences were found between correlations with the full form versus any of the three adaptive forms. Overall, correlations of OMI with brain parameters are in the expected directions, with all showing negative correlations except for CBF.
Discussion
The purpose of the present study was to construct, calibrate, and validate a CAT screener for overall mental illness. The results were generally encouraging. All relationships of CAT-OMI scores with demographic characteristics, common mental disorders, and brain measures were in the expected direction. Specifically, higher OMI was associated with, 1) lower socio-economic status and mother’s education, 2) higher neighborhood crime (not significant) and trauma exposure, 3) higher probability of all mental disorders measured here, 4) lower volume in relevant brain regions, 5) lower FA in relevant brain regions, and 6) lower activation of the anterior insula during task-fMRI. Importantly, most of these relationships were almost as strong for the adaptive versions as for the full versions of the scale. Note that the work done here builds on previous work aimed at rapidly (and sometimes adaptively) assessing clinical outcomes, often at intake. Perhaps the largest example is the Patient-Reported Outcomes Measurement Information System (PROMIS) (Fries et al., 2005). Another representative example of smaller scales designed for quick screening is the Brief Risk-Resilience Index for SCreening (BRISC) (Williams et al., 2012).
The “target user” of the CAT-OMI would be a researcher who wishes to rapidly assess a participant’s overall level of psychopathology. This test would clearly be inappropriate if the topic of interest were a specific disorder (e.g. depression); however, many studies even peripherally related to psychopathology would benefit from a measure of psychopathology as a covariate. In such cases, where psychopathology is not a focus but should not be ignored entirely, conventional scales (e.g. depression scales) might be too narrow, while a combination of conventional scales will almost certainly be too time-consuming. The adaptive OMI assessment meets potential needs of non-clinical researchers insofar as it is broad enough to cover most mental disorders, but efficient enough to be of minimal time burden (3 – 10 minutes, depending on version).
Another potential use of the OMI assessment is as a screener in recruitment of participants. A benefit of CAT is that, after each response, it estimates a standard error of measurement (SEM), which can itself be used to estimate confidence intervals around the test-taker’s interim trait estimate. Thus, one can set the CAT to stop when the 95% confidence interval around a trait estimate no longer contains a particular target trait level, such as the cutoff level that would classify someone as “ill” or not; see “Clinical-Decision Adaptive Testing” in Waller & Reise (1989, p. 1054). This could allow recruiters to decide, with very few items, whether a participant meets psychopathology-based exclusion criteria.
It is unclear whether the adaptive OMI assessment would be useful to clinicians. On one hand, clinicians usually prefer to obtain a diagnosis before deciding on treatment (if any), and knowing a patient’s OMI would likely be insufficiently informative. On the other hand, there are scenarios in which the efficiency of the OMI assessment might be optimal. For example, in disaster zones or very low-income areas with scarce resources (where the professional to patient ratio is very small), the only option might be to assess people very roughly but rapidly to help prioritize professional attention.
Overall, results support the feasibility and utility of the CAT-OMI for research purposes and, possibly, clinical purposes; however, the present study has several important limitations. First, there are several forms of replication required to bolster the current findings. The 114 items used in the current analyses were extracted from a larger K-SADS based interview and therefore it is possible that participants may respond to the questions in that context differently than they do within the truly adaptive framework. Thus, the adaptive form still needs to be validated using concurrent assessment with the full GOASSESS. Second, the age range is relatively young (11 – 21 years), and given differences in manifestations of psychopathology in children, adults, and the elderly, replication in samples with wider and/or different age ranges will be important. Relatedly, although the CAT-OMI includes symptoms from a wide range of common mental illnesses, some important ones are not covered—e.g. autism spectrum disorders, substance abuse, eating disorders, dissociative disorders, and some others. Fourth, for the neuroimaging validation, while we undertook great effort to specify a priori brain regions based on existing literature, there are undoubtedly many more brain-psychopathology relationships that we simply failed to find. Thus, validity results related to brain regions must be interpreted with caution, and their specificity of effect cannot be strongly claimed. Fifth, the association between OMI and SES (including with maternal education) does not add much to the validity evidence because it is so non-specific (SES correlates with many things). The finding that the full form correlated more highly with SES than did any of the adaptive forms could therefore be interpreted in a number of ways and requires further study. Sixth, related to the problem of age range mentioned above, there are known sex differences in brain development that have been unaccounted for here. This, combined with the development-rich age range, increases the likelihood of both Type 1 and Type 2 error. Finally, measurement invariance (differential item functioning) has not been explored in the present study. Future research should explore the possibility that the measurement model is different across groups (e.g. by race, sex, age group, disease status, socioeconomic class, etc.).
Despite the above limitations, the CAT-OMI screener shows promise and may facilitate the rapid and accurate measurement of overall psychopathology in large-scale studies and in clinical practice. The CAT-OMI is brief—i.e. as few as 10 items, depending on the desired level of measurement precision—and most importantly, it is publicly available and customizable, free of charge. It is thus poised to become part of the repertory of common tests available for large-scale studies and with minimal resource cost.
Supplementary Material
Acknowledgments
This work was supported by the Lifespan Brain Institute (LiBI); NIMH grants MH089983, MH019112, MH096891, MH107235, and MH107703; and the Dowshen Program for Neuroscience.
Footnotes
Publisher's Disclaimer: This is a PDF file of an unedited manuscript that has been accepted for publication. As a service to our customers we are providing this early version of the manuscript. The manuscript will undergo copyediting, typesetting, and review of the resulting proof before it is published in its final citable form. Please note that during the production process errors may be discovered which could affect the content, and all legal disclaimers that apply to the journal pertain.
Conflict of Interest (COI) summary for Development of a Computerized Adaptive Screening Tool for Overall Psychopathology (“p”)
Tyler M. Moore reports no conflict of interest.
Monica E. Calkins reports no conflict of interest.
Theodore D. Satterthwaite reports no conflict of interest.
David R. Roalf reports no conflict of interest.
Adon F. G. Rosen reports no conflict of interest.
Ruben C. Gur reports no conflict of interest.
Raquel E. Gur reports no conflict of interest.
References
- Alvarez RP, Kirlic N, Misaki M, Bodurka J, Rhudy JL, Paulus MP, Drevets WC, 2015. Increased anterior insula activity in anxious individuals is linked to diminished perceived control. Translational Psychiatry 5, e591. [DOI] [PMC free article] [PubMed] [Google Scholar]
- American Psychiatric Association, 2011. Diagnostic and Statistical Manual of Mental Disorders, Fourth Edition, Text Revision (DSM-IV-TR). [Google Scholar]
- Bennett MR, Farnell L, Gibson WG, 2013. Fiber Pathway Pathology, Synapse Loss and Decline of Cortical Function in Schizophrenia. PLoS ONE 8, e60518. [DOI] [PMC free article] [PubMed] [Google Scholar]
- Bock RD, Aitkin M, 1981. Marginal maximum likelihood estimation of item parameters: Application of an EM algorithm. Psychometrika 46, 443–459. [Google Scholar]
- Bogerts B, Lieberman JA, Ashtari M, Bilder RM, Degreef G, Lerner G, Johns C, Masiar S, 1993. Hippocampus-amygdala volumes and psychopathology in chronic schizophrenia. Biol. Psychiatry 33, 236–246. [DOI] [PubMed] [Google Scholar]
- Bois C, Levita L, Ripp I, Owens DCG, Johnstone EC, Whalley HC, Lawrie SM, 2015. Hippocampal, amygdala and nucleus accumbens volume in first-episode schizophrenia patients and individuals at high familial risk: A cross-sectional comparison. Schizophr. Res 165, 45–51. [DOI] [PubMed] [Google Scholar]
- Bremner JD, Narayan M, Anderson ER, Staib LH, Miller HL, Charney DS, 2000. Hippocampal Volume Reduction in Major Depression. Am. J. Psychiatry 157, 115–118. [DOI] [PubMed] [Google Scholar]
- Calkins ME, Merikangas KR, Moore TM, Burstein M, Behr MA, Satterthwaite TD, Ruparel K, Wolf DH, Roalf DR, Mentch FD, Qiu H, Chiavacci R, Connolly JJ, Sleiman PMA, Gur RC, Hakonarson H, Gur RE, 2015. The Philadelphia Neurodevelopmental Cohort: constructing a deep phenotyping collaborative. Journal of Child Psychology and Psychiatry 56, 1356–1369. [DOI] [PMC free article] [PubMed] [Google Scholar]
- Calkins ME, Moore TM, Merikangas KR, Burstein M, Satterthwaite TD, Bilker WB, Ruparel K, Chiavacci R, Wolf DH, Mentch F, Qiu H, Connolly JJ, Sleiman PA, Hakonarson H, Gur RC, Gur RE, 2014. The psychosis spectrum in a young U.S. community sample: findings from the Philadelphia Neurodevelopmental Cohort. World Psychiatry 13, 296–305. [DOI] [PMC free article] [PubMed] [Google Scholar]
- Caspi A, Houts RM, Belsky DW, Goldman-Mellor S, Harrington H, Israel S, Meier MH, Ramrakha S, Shalev I, Poulton R, Moffitt TE, 2014. The p Factor. Clinical Psychological Science 2, 119–137. [DOI] [PMC free article] [PubMed] [Google Scholar]
- Castro-Fornieles J, Caldú X, Andrés-Perpiñá S, Lázaro L, Bargalló N, Falcón C, Plana MT, Junqué C, 2010. A cross-sectional and follow-up functional MRI study with a working memory task in adolescent anorexia nervosa. Neuropsychologia 48, 4111–4116. [DOI] [PubMed] [Google Scholar]
- Chalmers RP, 2012. mirt: A Multidimensional Item Response Theory Package for theREnvironment. Journal of Statistical Software 48. [Google Scholar]
- Choi SW, 2009. Firestar: Computerized Adaptive Testing Simulation Program for Polytomous Item Response Theory Models. Applied Psychological Measurement 33, 644–645. [Google Scholar]
- Cullen KR, Westlund MK, Klimes-Dougan B, Mueller BA, Houri A, Eberly LE, Lim KO, 2014. Abnormal Amygdala Resting-State Functional Connectivity in Adolescent Depression. JAMA Psychiatry 71, 1138. [DOI] [PMC free article] [PubMed] [Google Scholar]
- Dibbets P, Evers EA, Hurks PP, Bakker K, Jolles J, 2010. Differential brain activation patterns in adult attention-deficit hyperactivity disorder (ADHD) associated with task switching. Neuropsychology 24, 413. [DOI] [PubMed] [Google Scholar]
- Edwards MC, Wirth RJ, Houts CR, Bodine AJ, 2014. Three (or four) factors, four (or three) models, in Reise SP, Revicki D (Eds.), Handbook of Item Response Theory Modeling. Routledge, New York. [Google Scholar]
- Efron B, Tibshirani R, 1986. Bootstrap Methods for Standard Errors, Confidence Intervals, and Other Measures of Statistical Accuracy. Statistical Science 1, 54–75. [Google Scholar]
- Embretson SE, Reise SP, 2009. Item Response Theory for Psychologists, Repr. ed. Erlbaum, Mahwah, NJ: [u.a.]. [Google Scholar]
- Erk S, Meyer-Lindenberg A, Schmierer P, Mohnke S, Grimm O, Garbusow M, Haddad L, Poehland L, Mühleisen TW, Witt SH, Tost H, Kirsch P, Romanczuk-Seiferth N, Schott BH, Cichon S, Nöthen MM, Rietschel M, Heinz A, Walter H, 2014. Hippocampal and Frontolimbic Function as Intermediate Phenotype for Psychosis: Evidence from Healthy Relatives and a Common Risk Variant in CACNA1C. Biol. Psychiatry 76, 466–475. [DOI] [PubMed] [Google Scholar]
- Feinstein JS, Buzza C, Hurlemann R, Follmer RL, Dahdaleh NS, Coryell WH, Welsh MJ, Tranel D, Wemmie JA, 2013. Fear and panic in humans with bilateral amygdala damage. Nat. Neurosci 16, 270–272. [DOI] [PMC free article] [PubMed] [Google Scholar]
- Fries JF, Bruce B, Cella D, 2005. The promise of PROMIS: using item response theory to improve assessment of patient-reported outcomes. Clin. Exp. Rheumatol 23, S53. [PubMed] [Google Scholar]
- Fusar-Poli P, Howes OD, Allen P, Broome M, Valli I, Asselin MC, Montgomery AJ, Grasby PM, McGuire P, 2011. Abnormal prefrontal activation directly related to pre-synaptic striatal dopamine dysfunction in people at clinical high risk for psychosis. Mol. Psychiatry 16, 67. [DOI] [PubMed] [Google Scholar]
- Gibbons RD, Bock RD, Hedeker D, Weiss DJ, Segawa E, Bhaumik DK, Kupfer DJ, Frank E, Grochocinski VJ, Stover A, 2007. Full-Information Item Bifactor Analysis of Graded Response Data. Applied Psychological Measurement 31, 4–19. [Google Scholar]
- Gibbons RD, Hedeker DR, 1992. Full-information item bi-factor analysis. Psychometrika 57, 423–436. [Google Scholar]
- Han K, Choi S, Jung J, Na K, Yoon H, Lee M, Ham B, 2013. Cortical thickness, cortical and subcortical volume, and white matter integrity in patients with their first episode of major depression. Journal of Affective Disorders 155, 42–48. [DOI] [PubMed] [Google Scholar]
- Harris GJ, Jaffin SK, Hodge SM, Kennedy D, Caviness VS, Marinkovic K, Papadimitriou GM, Makris N, Oscar-Berman M, 2008. Frontal White Matter and Cingulum Diffusion Tensor Imaging Deficits in Alcoholism. Alcoholism: Clinical and Experimental Research 32, 1001–1013. [DOI] [PMC free article] [PubMed] [Google Scholar]
- Kaczkurkin AN, Moore TM, Calkins ME, Ciric R, Detre JA, Elliott MA, Foa EB, Garcia de la Garza A, Roalf DR, Rosen A, Ruparel K, Shinohara RT, Xia CH, Wolf DH, Gur RE, Gur RC, Satterthwaite TD, 2017. Common and dissociable regional cerebral blood flow differences associate with dimensions of psychopathology across categorical diagnoses. Molecular psychiatry . [DOI] [PMC free article] [PubMed] [Google Scholar]
- Kessler RC, Chiu WT, Demler O, Walters EE, 2005. Prevalence, Severity, and Comorbidity of 12-Month DSM-IV Disorders in the National Comorbidity Survey Replication. Arch. Gen. Psychiatry 62, 617. [DOI] [PMC free article] [PubMed] [Google Scholar]
- Kitis O, Ozalay O, Zengin EB, Haznedaroglu D, Eker MC, Yalvac D, Oguz K, Coburn K, Gonul AS, 2012. Reduced left uncinate fasciculus fractional anisotropy in deficit schizophrenia but not in non-deficit schizophrenia. Psychiatry Clin. Neurosci 66, 34–43. [DOI] [PubMed] [Google Scholar]
- Kobayashi H, Nemoto T, Koshikawa H, Osono Y, Yamazawa R, Murakami M, Kashima H, Mizuno M, 2008. A self-reported instrument for prodromal symptoms of psychosis: Testing the clinical validity of the PRIME Screen—Revised (PS-R) in a Japanese population. Schizophrenia Research 106, 356–362. [DOI] [PubMed] [Google Scholar]
- Konrad A, Dielentheis TF, El Masri D, Bayerl M, Fehr C, Gesierich T, Vucurevic G, Stoeter P, Winterer G, 2010. Disturbed structural connectivity is related to inattention and impulsivity in adult attention deficit hyperactivity disorder. Eur. J. Neurosci 31, 912–919. [DOI] [PubMed] [Google Scholar]
- Krueger RF, 1999. The Structure of Common Mental Disorders. Arch. Gen. Psychiatry 56, 921. [DOI] [PubMed] [Google Scholar]
- Krueger RF, Caspi A, Moffitt TE, Silva PA, 1998. The structure and stability of common mental disorders (DSM-III-R): A longitudinal-epidemiological study. J. Abnorm. Psychol 107, 216–227. [DOI] [PubMed] [Google Scholar]
- Kubicki M, Westin C, Maier SE, Frumin M, Nestor PG, Salisbury DF, Kikinis R, Jolesz FA, McCarley RW, Shenton ME, 2002. Uncinate Fasciculus Findings in Schizophrenia: A Magnetic Resonance Diffusion Tensor Imaging Study. Am. J. Psychiatry 159, 813–820. [DOI] [PMC free article] [PubMed] [Google Scholar]
- Kwon JS, 2003. Similarity and disparity of obsessive-compulsive disorder and schizophrenia in MR volumetric abnormalities of the hippocampus-amygdala complex. Journal of Neurology, Neurosurgery & Psychiatry 74, 962–964. [DOI] [PMC free article] [PubMed] [Google Scholar]
- Lord FM, 1980. Applications of Item Response Theory to Practical Testing Problems. Erlbaum, Hillsdale, NJ. [Google Scholar]
- Makris N, Goldstein JM, Kennedy D, Hodge SM, Caviness VS, Faraone SV, Tsuang MT, Seidman LJ, 2006. Decreased volume of left and total anterior insular lobule in schizophrenia. Schizophr. Res 83, 155–171. [DOI] [PubMed] [Google Scholar]
- Marchand WR, Lee JN, Thatcher GW, Jensen C, Stewart D, Dilda V, Thatcher J, Creem-Regehr SH, 2007. A functional MRI study of a paced motor activation task to evaluate frontal-subcortical circuit function in bipolar depression. Psychiatry Research: Neuroimaging 155, 221–230. [DOI] [PubMed] [Google Scholar]
- Merikangas KR, Avenevoli S, Costello EJ, Koretz D, Kessler RC, 2009. National Comorbidity Survey Replication Adolescent Supplement (NCS-A): I. Background and Measures. Journal of the American Academy of Child & Adolescent Psychiatry 48, 367–379. [DOI] [PMC free article] [PubMed] [Google Scholar]
- Merikangas KR, He J, Burstein M, Swanson SA, Avenevoli S, Cui L, Benjet C, Georgiades K, Swendsen J, 2010. Lifetime prevalence of mental disorders in US adolescents: results from the National Comorbidity Survey Replication–Adolescent Supplement (NCS-A). Journal of the American Academy of Child & Adolescent Psychiatry 49, 980–989. [DOI] [PMC free article] [PubMed] [Google Scholar]
- Miller TJ, Cicchetti D, Markovich PJ, McGlashan TH, Woods SW, 2004. The SIPS screen: A brief self-report screen to detect the schizophrenia prodrome. Schizophrenia Research 70, 78. [Google Scholar]
- Miller TJ, McGlashan TH, Rosen JL, Cadenhead K, Ventura J, McFarlane W, Perkins DO, Pearlson GD, Woods SW, 2003. Prodromal Assessment With the Structured Interview for Prodromal Syndromes and the Scale of Prodromal Symptoms: Predictive Validity, Interrater Reliability, and Training to Reliability. Schizophr. Bull 29, 703–715. [DOI] [PubMed] [Google Scholar]
- Moore TM, Martin IK, Gur OM, Jackson CT, Scott JC, Calkins ME, Ruparel K, Port AM, Nivar I, Krinsky HD, Gur RE, Gur RC, 2016. Characterizing social environment’s association with neurocognition using census and crime data linked to the Philadelphia Neurodevelopmental Cohort. Psychological medicine 46, 599–610. [DOI] [PMC free article] [PubMed] [Google Scholar]
- Moore TM, Calkins ME, Reise SP, Gur RC, Gur RE, 2018. Development and public release of a computerized adaptive (CAT) version of the Schizotypal Personality Questionnaire. Psychiatry Res. 263, 250–256. [DOI] [PMC free article] [PubMed] [Google Scholar]
- Moore TM, Scott JC, Reise SP, Port AM, Jackson CT, Ruparel K, Savitt AP, Gur RE, Gur RC, 2015. Development of an abbreviated form of the Penn Line Orientation Test using large samples and computerized adaptive test simulation. Psychol. Assess 27, 955–964. [DOI] [PMC free article] [PubMed] [Google Scholar]
- Moran LV, Tagamets MA, Sampath H, O’Donnell A, Stein EA, Kochunov P, Hong LE, 2013. Disruption of Anterior Insula Modulation of Large-Scale Brain Networks in Schizophrenia. Biol. Psychiatry 74, 467–474. [DOI] [PMC free article] [PubMed] [Google Scholar]
- Nakamae T, Narumoto J, Shibata K, Matsumoto R, Kitabayashi Y, Yoshida T, Yamada K, Nishimura T, Fukui K, 2008. Alteration of fractional anisotropy and apparent diffusion coefficient in obsessive-compulsive disorder: A diffusion tensor imaging study. Prog. Neuro-Psychopharmacol. Biol. Psychiatry 32, 1221–1226. [DOI] [PubMed] [Google Scholar]
- Oler JA, Fox AS, Shackman AJ, Kalin NH, 2016. The central nucleus of the amygdala is a critical substrate for individual differences in anxiety, in Amaral DG, Adolphs R (Eds.), Living without an Amygdala. Guilford, New York. [Google Scholar]
- Paulus MP, Stein MB, 2006. An Insular View of Anxiety. Biol. Psychiatry 60, 383–387. [DOI] [PubMed] [Google Scholar]
- Penner J, Ford KA, Taylor R, Schaefer B, Théberge J, Neufeld RWJ, Osuch EA, Menon RS, Rajakumar N, Allman JM, Williamson PC, 2016. Medial Prefrontal and Anterior Insular Connectivity in Early Schizophrenia and Major Depressive Disorder: A Resting Functional MRI Evaluation of Large-Scale Brain Network Models. Frontiers in Human Neuroscience 10. [DOI] [PMC free article] [PubMed] [Google Scholar]
- Peterson DJ, Ryan M, Rimrodt SL, Cutting LE, Denckla MB, Kaufmann WE, Mahone EM, 2011. Increased Regional Fractional Anisotropy in Highly Screened Attention-Deficit Hyperactivity Disorder (ADHD). J. Child Neurol 26, 1296–1302. [DOI] [PMC free article] [PubMed] [Google Scholar]
- Phan KL, Orlichenko A, Boyd E, Angstadt M, Coccaro EF, Liberzon I, Arfanakis K, 2009. Preliminary Evidence of White Matter Abnormality in the Uncinate Fasciculus in Generalized Social Anxiety Disorder. Biol. Psychiatry 66, 691–694. [DOI] [PMC free article] [PubMed] [Google Scholar]
- Plessen KJ, Bansal R, Zhu H, Whiteman R, Amat J, Quackenbush GA, Martin L, Durkin K, Blair C, Royal J, Hugdahl K, Peterson BS, 2006. Hippocampus and Amygdala Morphology in Attention-Deficit/Hyperactivity Disorder. Arch. Gen. Psychiatry 63, 795. [DOI] [PMC free article] [PubMed] [Google Scholar]
- Rajarethinam R, DeQuardo JR, Miedler J, Arndt S, Kirbat R, Brunberg J,A, Tandon R, 2001. Hippocampus and amygdala in schizophrenia: assessment of the relationship of neuroanatomy to psychopathology. Psychiatry Research: Neuroimaging 108, 79–87. [DOI] [PubMed] [Google Scholar]
- Reckase MD, 2009. Multidimensional Item Response Theory Models. Multidimensional Item Response Theory , 79–112. [Google Scholar]
- Reise SP, Cook KF, Moore TM, 2015. Evaluating the impact of multidimensionality on unidimensional Item Response Theory model parameters, in Reise SP, Revicki D (Eds.), Handbook of Item Response Theory Modeling. Routledge, New York, pp. 13–40. [Google Scholar]
- Reise SP, 2012. The Rediscovery of Bifactor Measurement Models. Multivariate Behavioral Research 47, 667–696. [DOI] [PMC free article] [PubMed] [Google Scholar]
- Reise SP, Moore TM, Maydeu-Olivares A, 2011. Target Rotations and Assessing the Impact of Model Violations on the Parameters of Unidimensional Item Response Theory Models. Educational and Psychological Measurement 71, 684–711. [Google Scholar]
- Reise SP, Moore TM, Haviland MG, 2010. Bifactor Models and Rotations: Exploring the Extent to Which Multidimensional Data Yield Univocal Scale Scores. J. Pers. Assess. 92, 544–559. [DOI] [PMC free article] [PubMed] [Google Scholar]
- Roalf DR, Moore TM, Wolk DA, Arnold SE, Mechanic-Hamilton D, Rick J, Kabadi S, Ruparel K, Chen-Plotkin A, Chahine LM, Dahodwala NA, Duda JE, Weintraub DA, Moberg PJ, 2016. Defining and validating a short form Montreal Cognitive Assessment (s-MoCA) for use in neurodegenerative disease. Journal of Neurology, Neurosurgery & Psychiatry 87, 1303–1310. [DOI] [PMC free article] [PubMed] [Google Scholar]
- Roalf DR, Quarmley M, Elliott MA, Satterthwaite TD, Vandekar SN, Ruparel K, Gennatas ED, Calkins ME, Moore TM, Hopson R, Prabhakaran K, Jackson CT, Verma R, Hakonarson H, Gur RC, Gur RE, 2016. The impact of quality assurance assessment on diffusion tensor imaging outcomes in a large-scale population-based cohort. Neuroimage 125, 903–919. [DOI] [PMC free article] [PubMed] [Google Scholar]
- Rosen AFG, Roalf DR, Ruparel K, Blake J, Seelaus K, Villa LP, Ciric R, Cook PA, Davatzikos C, Elliott MA, Garcia de LG, Gennatas ED, Quarmley M, Schmitt JE, Shinohara RT, Tisdall MD, Craddock RC, Gur RE, Gur RC, Satterthwaite TD, 2018. Quantitative assessment of structural image quality. Neuroimage 169, 407–418. [DOI] [PMC free article] [PubMed] [Google Scholar]
- Sarkar S, Craig MC, Catani M, Dell’Acqua F, Fahy T, Deeley Q, Murphy DGM, 2012. Frontotemporal white-matter microstructural abnormalities in adolescents with conduct disorder: a diffusion tensor imaging study. Psychol. Med 43, 401–411. [DOI] [PubMed] [Google Scholar]
- Satterthwaite TD, Shinohara RT, Wolf DH, Hopson RD, Elliott MA, Vandekar SN, Ruparel K, Calkins ME, Roalf DR, Gennatas ED, Jackson C, Erus G, Prabhakaran K, Davatzikos C, Detre JA, Hakonarson H, Gur RC, Gur RE, 2014. Impact of puberty on the evolution of cerebral perfusion during adolescence. Proceedings of the National Academy of Sciences 111, 8643–8648. [DOI] [PMC free article] [PubMed] [Google Scholar]
- Satterthwaite TD, Wolf DH, Erus G, Ruparel K, Elliott MA, Gennatas ED, Hopson R, Jackson C, Prabhakaran K, Bilker WB, Calkins ME, Loughead J, Smith A, Roalf DR, Hakonarson H, Verma R, Davatzikos C, Gur RC, Gur RE, 2013. Functional Maturation of the Executive System during Adolescence. Journal of Neuroscience 33, 16249–16261. [DOI] [PMC free article] [PubMed] [Google Scholar]
- Satterthwaite TD, Connolly JJ, Ruparel K, Calkins ME, Jackson C, Elliott MA, Roalf DR, Hopson R, Prabhakaran K, Behr M, Qiu H, Mentch FD, Chiavacci R, Sleiman PMA, Gur RE, Gur RC, Hakonarson H, 2016. The Philadelphia Neurodevelopmental Cohort: A publicly available resource for the study of normal and abnormal brain development in youth. NeuroImage 124, 1115–1119. [DOI] [PMC free article] [PubMed] [Google Scholar]
- Satterthwaite TD, Elliott MA, Ruparel K, Loughead J, Prabhakaran K, Calkins ME, Hopson R, Jackson C, Keefe J, Riley M, Mentch FD, Sleiman P, Verma R, Davatzikos C, Hakonarson H, Gur RE, Gur RC, 2014. Neuroimaging of the Philadelphia Neurodevelopmental Cohort. NeuroImage 86, 544–553. [DOI] [PMC free article] [PubMed] [Google Scholar]
- Satterthwaite TD, Wolf DH, Calkins ME, Vandekar SN, Erus G, Ruparel K, Roalf DR, Linn KA, Elliott MA, Moore TM, Hakonarson H, Shinohara RT, Davatzikos C, Gur RC, Gur RE, 2016. Structural Brain Abnormalities in Youth With Psychosis Spectrum Symptoms. JAMA Psychiatry 73, 515–524. [DOI] [PMC free article] [PubMed] [Google Scholar]
- Scalise K, Allen DD, 2015. Use of open-source software for adaptive measurement: Concerto as an R-based computer adaptive development and delivery platform. Br. J. Math. Stat. Psychol 68, 478–496. [DOI] [PubMed] [Google Scholar]
- Senatorov VV, Damadzic R, Mann CL, Schwandt ML, George DT, Hommer DW, Heilig M, Momenan R, 2014. Reduced anterior insula, enlarged amygdala in alcoholism and associated depleted von Economo neurons. Brain 138, 69–79. [DOI] [PMC free article] [PubMed] [Google Scholar]
- Shaffer D, 1983. A Children’s Global Assessment Scale (CGAS). Arch. Gen. Psychiatry 40, 1228. [DOI] [PubMed] [Google Scholar]
- Shanmugan S, Wolf DH, Calkins ME, Moore TM, Ruparel K, Hopson RD, Vandekar SN, Roalf DR, Elliott MA, Jackson C, Gennatas ED, Leibenluft E, Pine DS, Shinohara RT, Hakonarson H, Gur RC, Gur RE, Satterthwaite TD, 2016. Common and Dissociable Mechanisms of Executive System Dysfunction Across Psychiatric Disorders in Youth. Am. J. Psychiatry 173, 517–526. [DOI] [PMC free article] [PubMed] [Google Scholar]
- Siegle GJ, Thompson W, Carter CS, Steinhauer SR, Thase ME, 2007. Increased Amygdala and Decreased Dorsolateral Prefrontal BOLD Responses in Unipolar Depression: Related and Independent Features. Biol. Psychiatry 61, 198–209. [DOI] [PubMed] [Google Scholar]
- Smith R, Fadok RA, Purcell M, Liu S, Stonnington C, Spetzler RF, Baxter LC, 2011. Localizing sadness activation within the subgenual cingulate in individuals: a novel functional MRI paradigm for detecting individual differences in the neural circuitry underlying depression. Brain imaging and behavior 5, 229–239. [DOI] [PubMed] [Google Scholar]
- Sterzer P, Stadler C, Poustka F, Kleinschmidt A, 2007. A structural neural deficit in adolescents with conduct disorder and its association with lack of empathy. Neuroimage 37, 335–342. [DOI] [PubMed] [Google Scholar]
- Svatkova A, Nestrasil I, Rudser K, Goldenring Fine J, Bledsoe J, Semrud-Clikeman M, 2016. Unique white matter microstructural patterns in ADHD presentations-a diffusion tensor imaging study. Hum. Brain Mapp 37, 3323–3336. [DOI] [PMC free article] [PubMed] [Google Scholar]
- Uddin LQ, Menon V, 2009. The anterior insula in autism: Under-connected and under-examined. Neuroscience & Biobehavioral Reviews 33, 1198–1203. [DOI] [PMC free article] [PubMed] [Google Scholar]
- Vandekar SN, Shinohara RT, Raznahan A, Roalf DR, Ross M, DeLeo N, Ruparel K, Verma R, Wolf DH, Gur RC, Gur RE, Satterthwaite TD, 2015. Topologically Dissociable Patterns of Development of the Human Cerebral Cortex. Journal of Neuroscience 35, 599–609. [DOI] [PMC free article] [PubMed] [Google Scholar]
- Videbech P, Ravnkilde B, 2004. Hippocampal Volume and Depression: A Meta-Analysis of MRI Studies. American Journal of Psychiatry 161, 1957–1966. [DOI] [PubMed] [Google Scholar]
- Von Der Heide RJ, Skipper LM, Klobusicky E, Olson IR, 2013. Dissecting the uncinate fasciculus: disorders, controversies and a hypothesis. Brain : a journal of neurology 136, 1692–1707. [DOI] [PMC free article] [PubMed] [Google Scholar]
- Wainer H, Dorans NJ, 2000. Computerized Adaptive Testing, 2nd ed ed. Routledge Ltd, Mahwah. [Google Scholar]
- Waller NG, Reise SP, 1989. Computerized adaptive personality assessment: An illustration with the Absorption scale. Journal of Personality and Social Psychology 57, 1051–1058. [DOI] [PubMed] [Google Scholar]
- Wang F, Sun Z, Cui L, Du X, Wang X, Zhang H, Cong Z, Hong N, Zhang D, 2004. Anterior Cingulum Abnormalities in Male Patients With Schizophrenia Determined Through Diffusion Tensor Imaging. Am. J. Psychiatry 161, 573–575. [DOI] [PubMed] [Google Scholar]
- Wang H, Suh JW, Das SR, Pluta JB, Craige C, Yushkevich PA, 2013. Multi-Atlas Segmentation with Joint Label Fusion. TPAMI 35, 611–623. [DOI] [PMC free article] [PubMed] [Google Scholar]
- Wang H, Yushkevich PA, 2013. Multi-atlas segmentation with joint label fusion and corrective learning-an open source implementation. Frontiers in neuroinformatics 7, 27. [DOI] [PMC free article] [PubMed] [Google Scholar]
- Weiss DJ, Gibbons RD, 2007. Computerized adaptive testing with the bifactor model, in Weiss DJ (Ed.), Proceedings of the 2007 GMAC Conference on Computerized Adaptive Testing IACAT. [Google Scholar]
- Weiss DJ, Kingsbury GG, 1984. Application of Computerized Adaptive Testing to Educational Problems. Journal of Educational Measurement 21, 361–375. [Google Scholar]
- Williams LM, Cooper NJ, Wisniewski SR, Gatt JM, Koslow SH, Kulkarni J, DeVarney S, Gordon E, Rush AJ, 2012. Sensitivity, specificity, and predictive power of the “Brief Risk-resilience Index for SC reening,” a brief pan-diagnostic web screen for emotional health. Brain and behavior 2, 576–589. [DOI] [PMC free article] [PubMed] [Google Scholar]
- Zarei M, Mataix-Cols D, Heyman I, Hough M, Doherty J, Burge L, Winmill L, Nijhawan S, Matthews PM, James A, 2011. Changes in Gray Matter Volume and White Matter Microstructure in Adolescents with Obsessive-Compulsive Disorder. Biol. Psychiatry 70, 1083–1090. [DOI] [PubMed] [Google Scholar]
- Zou K, Huang X, Li T, Gong Q, Li Z, Ou-yang L, Deng W, Chen Q, Li C, Ding Y, Sun X, 2008. Alterations of white matter integrity in adults with major depressive disorder: a magnetic resonance imaging study. Journal of psychiatry & neuroscience : JPN 33, 525. [PMC free article] [PubMed] [Google Scholar]
Associated Data
This section collects any data citations, data availability statements, or supplementary materials included in this article.