

SUMMARY
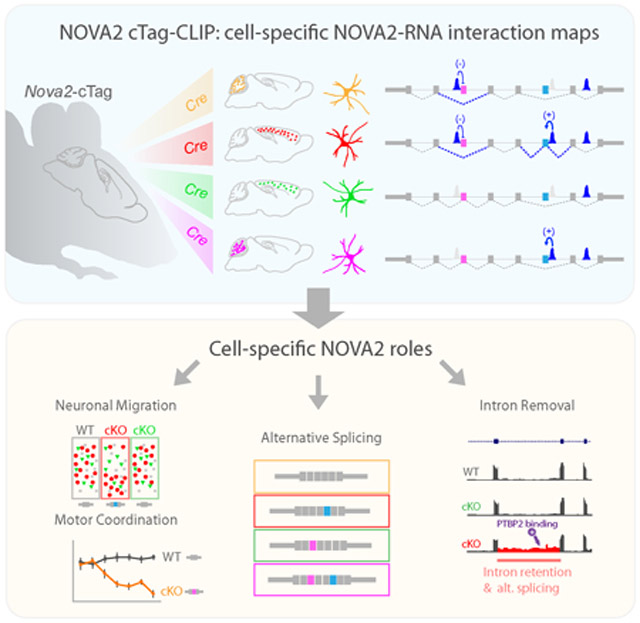
RNA-binding proteins (RBPs) regulate genetic diversity, but the degree to which they do so in individual cell-types in vivo is unknown. We developed NOVA2 cTag-CLIP to generate functional RBP-RNA maps from different neuronal populations in the mouse brain. Combining cell-type datasets from Nova2-cTag and Nova2 conditional knock-out mice revealed differential NOVA2 regulatory actions on alternative splicing (AS) on the same transcripts expressed in different neurons. This includes functional differences in transcripts expressed in cortical and cerebellar excitatory versus inhibitory neurons where we find NOVA2 is required for, respectively, development of laminar structure and motor coordination and synapse formation. We also find that NOVA2 regulated AS is coupled to NOVA2 regulation of intron retention in hundreds of transcripts, which can sequester the trans-acting splicing factor PTBP2. In summary, cTag-CLIP compliments single cell RNAseq studies by providing a means for understanding RNA regulation of functional cell diversity.
Keywords: CLIP, alternative splicing, intron retention, cTag-CLIP, RNA-binding protein, NOVA2, conditional knock-out mouse, PTBP2
Graphical Abstract
eTOC Blurb
cTag-CLIP provides a next generation strategy to profile functional protein:RNA interactions at cell-specific resolution in vivo. Saito et al., show that differential NOVA2 regulatory actions on alternative splicing coupled to intron removal in different neurons.
INTRODUCTION
Alternative splicing (AS) plays spectacular roles in mammalian biology that are especially evident in the brain, where it can generate many variants from individual primary transcripts, facilitating a limited genome to act as a major driver of system complexity (Darnell, 2013; Raj and Blencowe, 2015; Zheng and Black, 2013). The first example came from Amara and Evans, who discovered that the gene for calcitonin is alternatively spliced in hypothalamic neurons to generate the neurotransmitter peptide, CGRP (Amara et al., 1982). Subsequently, enormous diversity was discovered in Drosophila where stochastic AS generates mutually exclusive isoforms of DSCAM (Schmucker et al., 2000; Zipursky and Grueber, 2013) that regulate appropriate axon fasciculation. Other examples of AS playing a pivotal role in mammalian brain development include developmentally regulated AS switches controlled by neuronal proteins such as PTBP2 (Coutinho-Mansfield et al., 2007; Li et al., 2014; Licatalosi et al., 2012; Makeyev et al., 2007), NOVA (Eom et al., 2013; Jensen et al., 2000; Ruggiu et al., 2009; Saito et al., 2016; Ule et al., 2005b; Yano et al., 2010), RBFOX (Gehman et al., 2012; Lovci et al., 2013; Weyn-Vanhentenryck et al., 2014), MBNL (Charizanis et al., 2012; Wang et al., 2012), nELAVL (Ince-Dunn et al., 2012), and nSR100 (Calarco et al., 2009; Quesnel-Vallières et al., 2015) that govern proper early neuronal development.
An unresolved question in these studies is the extent to which such regulatory factors contribute to neuronal type specific identity, diversity and function within the mammalian brain. This issue has been challenging due to methodological limitations. Current techniques of dissociation and purification of individual cell types and populations, for example by laser capture microdissection or antibody-mediated panning methods, can produce limited numbers of cells and/or neurons, astrocytes or microglia but missing their processes, which may account for large percentages of the net volume of such cells. Moreover, while such methods and more refined methods of microfluidic single cell purification have been used for RNA sequencing, they have not been informative about cell-type specific protein-RNA regulation.
We previously developed a means for studying RNA regulation termed CLIP by purifying native protein-RNA regulatory complexes from intact flash-frozen brains termed CLIP (Licatalosi et al., 2008; Ule et al., 2003). Bioinformatic analysis of this data resolves RNA-protein interactions at single nucleotide resolution (Zhang et al., 2010, Zhang and Darnell, 2011). We recently modified CLIP using a technology termed cTag (“conditionally” tagged)-PAPERCLIP to conditionally express AcGFP-tagged poly(A) binding protein PABPC1 in vivo in selected cell populations using Cre/Lox system (Hwang et al., 2017, Jereb et al., 2018); after isolation of brain, CLIP and AcGFP purification, PAPERCLIP was able to purify and differentiate all of the polyadenylated (poly(A)) RNAs that were unique to excitatory and inhibitory neurons, and distinguish these from microglia and astrocytes. This led to identification of microglia-specific poly(A) changes after inflammatory brain stimulation (LPS) (Hwang et al., 2017) that were otherwise undetectable using standard methods to purify brain microglia.
Here we explore whether cTag-CLIP can be applied more generally for purification of a subset of RNA-protein regulatory interactions in specific neuronal types and populations and whether sensitivity is achievable with a single regulatory RBP, particularly when binding to short lived species such as introns of nascent RNA. We developed cTag-CLIP for NOVA2, a neuron-specific RNA regulatory protein together with its bound RNA targets. NOVA1 (Buckanovich and Darnell, 1997) and NOVA2 (Yang et al., 1998) proteins have been implicated in excitatory-inhibitory neuronal balance, from their original identification as targets in paraneoplastic opsoclonus-myoclonus-ataxia (POMA), as well as studies in mice. In the latter, Nova2 haploinsufficiency leads to spontaneous epilepsy (Eom et al., 2013), and homozygous loss of either or both NOVA isoforms leads to early postnatal death (Jensen et al., 2000) and developmental defects in acetylcholine clustering and synaptic transmission at the neuromuscular junction (NMJ; Ruggiu et al., 2009), long-term potentiation of inhibitory postsynaptic currents (Huang et al., 2005), neuronal migration (Yano et al., 2010), and axonal guidance (Saito et al., 2016).
In this study we harnessed cTag technology to examine high resolution maps of NOVA2-RNA interactions in vivo with neuronal cell-type and population specific resolution. Integrating data from NOVA2 cTag-CLIP with RNA-seq in Nova2-conditional knock out (Nova2-cKO) mice in different neuronal types and populations led us to distinguish NOVA2 properties and functions on the same transcripts in different cellular contexts. These unique binding profiles have functional consequences: NOVA2 acts as an essential factor specifically for development of laminar structure in cortical excitatory but not inhibitory neurons, and for proper motor coordination and synapse formation in cerebellar Purkinje, respectively. Exploring these findings further led to the discovery of a mechanism by which NOVA2 action leads to different outcomes in different cells on the same transcripts: NOVA2 acts as a cis-acting AS element to prevent intron retention (IR), and these RNA elements can serve as scaffolds to alter the binding and actions of another trans-acting AS factor, PTBP2. The cTag CLIP platform provides a general strategy for studying RNA regulation in single cell types and populations, complimenting ongoing RNAseq studies in single cells, and thereby developing insight into how RBPs mediate RNA diversity and functional complexity in complex organs such as the brain.
RESULTS
Alternative splicing and RBPs expression diversity across CNS regions and neuronal types
To first evaluate spatial and temporal AS diversity across the central nervous system (CNS), we re-analyzed publically available RNA-seq datasets of multiple CNS regions and developmental stages using the Quantas pipeline (Charizanis et al., 2012; Yan et al., 2015). Over 3,000 cassette-type AS events could be identified as showing significant differences (∣Δexon inclusion rate∣(∣ΔI∣)>=0.1 (Ule et al., 2005b) and FDR<0.05) during mouse cortical development and among different adult CNS regions (cerebral cortex, cerebellum, and spinal cord), including over 1,800 AS events in the neonatal cortex and midbrain, hindbrain, and cerebellum (Figure 1A, S1A, and S1B). AS events regulated by neural-enriched splicing factors, including NOVA, nSR100, PTBP2, MBNL, and RBFOX proteins, were determined by re-analyzing published RNA-seq datasets of each RBP-KO mouse. The total number of AS event changed in each RBP-KO mouse brain is shown in Figure S1C and Table S1. This analysis revealed that NOVA2 was the top ranked splicing regulator contributing to spatial and temporal AS diversity across CNS regions (Figure 1A).
Figure 1. Diversity of alternative splicing and RNA binding proteins expression within the CNS regions and neuronal types.

(A) AS diversity across the CNS regions and during cortical development. Upper panel shows the schematics illustrating the summary of AS changes determined by RNA-seq data across the mouse CNS regions and during mouse cortical development. The number indicates the significantly changed cassette-type AS event number (FDR<0.05, ∣ΔI∣>=0.1) between two tissues indicated by bidirectional arrows. Lower graph shows the AS event numbers intersecting with the AS events changing in each RBP-KO mouse brain (FDR<0.05, ∣ΔI∣>=0.1). (B) AS diversity between neuronal-types. Schematics illustrating the strategy for AS analysis between two distinct neuronal types prepared from e18.5 cortex of tdTomato reporter mouse which expresses tdTomato in Cre dependent fashion (Left panel). 1,236 AS events were significantly changed between two neuronal types (FDR<0.05, ∣ΔI∣>=0.1). Heatmaps show the excitatory or inhibitory neuron markers enrichment determined by RNA-seq (Upper right). AS event numbers intersecting with AS events changing in each RBP-KO mouse brain (FDR<0.05, ∣ΔI∣>=0.1) (Lower right). (C) RBPs expression diversity within the CNS regions and neuronal types. NOVA2, NOVA1 and RBFOX3 or PTBP2 immunofluorescence staining images in 4 weeks old mouse brain sections. Scale bars: left: 1 mm, middle and right: 50 μm. “See also Figure S1 and Table S1.”
Neurons and glia, the main cell-types in the brain, use different sets of AS exons (Zhang et al., 2014). It is unclear, however, the extent to which AS diversity exists among individual neuronal subtypes, nor what might govern such regulation. As a baseline for demarcating neuronal type regulatory factors that might govern cell-specific AS events, single cell suspensions prepared from embryonic day 18.5 (e18.5) cortex of tdTomato reporter mice (ControltdTomato) crossed with Gad2-Cre (inhibitory neuron-linage) or Emx1-Cre (cortical excitatory neuron-linage) driver mouse (ControltdTomato,Gad2-Cre or ControltdTomato,Emx1-Cre, respectively) were subjected to FACS and RNA-seq analysis (Figure 1B). Cre-dependent tdTomato expression was confirmed by immunofluorescence staining for tdTomato (Figure S1D). As anticipated, GABAergic inhibitory neuronal markers (e.g. Gad1, Gad2, and Lhx6) and glutamatergic excitatory neuronal markers (e.g. Tbr1 and Slc17a7) were significantly enriched in inhibitory neuronal-linage and excitatory neuronal-linage, respectively (Figure 1B). RNA levels of genes encoding AS regulators in each neuronal population were then assessed and found to be non-uniform, such that Nova1, Mbnl1, Elavl2, Elavl4, and Celf4 were significantly enriched in inhibitory neuronal-linage, and Nova2, Rbfox1, Rbfox3, Celf2, and Celf6 tended to be enriched in excitatory neuronal-linage (Figure S1E), although these demarcations were relative, not absolute. The comparison of exon inclusion rate between inhibitory and excitatory neuronal-linage identified 1,236 significant AS changes (FDR<0.05, ∣ΔI∣>=0.1) (Figure 1B, S1F, and Table S1), over two hundred of which overlapped with the NOVA2 target AS events (Figure 1B and S1C). As a quality control, we assessed the rate of contamination of non-neuronal cells in mouse e18.5 cortex, and found it to be less than 4.4% (Figure S1G), and found; no significant overlap with differentially regulated astrocyte-type AS events in the Emx1-Cre lineage (Figure S1H); no enrichment of glia markers in both Gad2- and Emx1-Cre linage samples (Figure S1I); enrichment of inhibitory and excitatory neuron markers in Gad2- and Emx1-Cre linage samples, respectively. These datasets clearly demonstrate that contamination of non-neuronal cells to both Gad2- and Emx1-Cre linage samples is slight and that cortical inhibitory and excitatory neurons express different exons. Taken together, these data suggest that just as neuronal-enriched trans-acting splicing regulators show diverse expression patterns across CNS regions and neuronal types (Figure 1C), AS diversity across CNS regions and neuronal cell-types may be generated by the expression and action of individual trans-acting splicing factors such as NOVA2.
Discovery of neuron cell-type specific AS regulation with NOVA2 cTag-CLIP
NOVA was the first RBP whose in vivo RNA-binding map was generated with CLIP (Ule et al., 2003) and high throughput sequencing (HITS-CLIP; (Licatalosi et al., 2008)), generating robust transcriptome-wide regulatory protein-RNA interaction maps in vivo. To generate NOVA2 CLIP maps with cell-type specific resolution in intact CNS tissue, we generated “Nova2-cTag” mice that conditionally express AcGFP-tagged NOVA2 (NOVA2-AcGFP) in a Cre-dependent manner (Figure 2A and 2B). A knock-in strategy was employed, targeting the endogenous Nova2 locus, in order to maintain wild-type Nova2 RNA stoichiometry and regulation (Figure S2A). Nova2-cTag heterozygous and homozygous mice had no apparent phenotype.
Figure 2. Generation of Nova2-cTag and Nova2-cKO mouse models discovering neuronal linage selective NOVA2 AS targets.

(A) Schematics illustrating simplified Nova2-cTag mouse model providing selective AcGFP-tagged NOVA2 expression in specified neuronal-type in vivo. (B) Schematics illustrating the strategy for selective NOVA2 cTag-CLIP in the targeted neuronal type in vivo. (C) Cre-dependent NOVA2-AcGFP protein expression. Indicated mouse brain lysate were subjected to immunoblot analysis with anti-NOVA2 or anti-GFP antibody. SuperNOVA2 is a different NOVA2 isoform translated from the same gene (Saito et al., 2016). (D) Autoradiograph image of neuronal linage specific NOVA2 cTag-CLIP. Colored box regions were subjected to CLIP library cloning steps. (E) Schematics illustrating the Nova2-cKO model providing NOVA2 depletion from selective neuronal type in vivo. (F) Schematics illustrating the strategy for AS analysis in specific neuronal type (FDR<0.05, ∣ΔI∣>=0.1, n=3). (G) NOVA2 depletion from selective neuronal populations. NOVA2 (green) and tdTomato (red) immunofluorescent staining images in the e18.5 hippocampus of indicated 4 mouse lines. Scale bars: 100 μm. (H) UCSC genome browser view of NOVA2-regulated Dab1.7bc AS difference in the different neuronal cell-type. Significantly different CLIP peak between neuron-types was highlighted with magenta shadow. ***; p<0.001. (I) RT-PCR confirmation of Dab1.7bc AS changes detected by RNA-seq (n=3). ***; p<0.001. (J) NOVA2 cTag-CLIP peak enrichment normalized to RNA abundance and functional NOVA2 protein abundance. Each dot indicates an individual NOVA2 CLIP peak on Dab1 transcript; 3 of 53 peaks were significantly different between inhibitory (Gad2-cre) and excitatory (Emx1-Cre) neurons (p<0.01, Fisher’s exact test). (K) Cortical excitatory neuron specific migration defect in Nova2-cKO mice. 3 weeks old indicated mouse lines were subjected to immunostaining. Cux1: layer II-IV marker. Quantification of Cux1 (left) and tdTomato immunointensity (right) (n >= 4, **; p<0.01, ***; p < 0.001). Scale bars: 50 μm. “See also Figure S2 and Table S1.”
To examine the RNA targets of AcGFP-tagged NOVA2 relative to endogenous NOVA2, we first bred Nova2-cTag mice to a near ubiquitous Cre driver mouse (CMV-Cre) in mouse neurons (Nova2-cTagCMV-Cre). Immunoblot and immunofluorescent staining experiments on Nova2-cTagCMV-Cre demonstrated successful and complete Cre-dependent expression of NOVA2-AcGFP (Figure 2C and S2B) at e18.5. We then undertook a side-by-side comparison of the RNA binding properties of native NOVA2 relative to AcGFP-tagged NOVA2. We undertook NOVA2-AcGFP HITS-CLIP (referred as NOVA2 cTag-CLIP) in the e18.5 cortex of Nova2-cTagCMV-Cre mice, using a mixture of two high-affinity monoclonal anti-GFP antibodies (Figure 2D). Comparison of the results from 3 biologic replicate NOVA2 cTagCMV-Cre-CLIP experiments and endogenous NOVA2 CLIP revealed NOVA2 binding to nearly identical (R=0.99) target transcripts with extremely similar CLIP peaks (R= 0.87, respectively) (Figure S2C), including NOVA2 binding to its known YCAY motifs (Buckanovich and Darnell, 1997; Lewis et al., 1999) in CLIP peaks (Figure S2D). Taken together, this data indicates that AcGFP-tagged NOVA2 is not detectably altered in its RNA binding properties in vivo.
We next applied NOVA2 cTag-CLIP to generate NOVA2-RNA interaction maps in two major neuronal-types: GABAergic inhibitory and glutamatergic excitatory neuronal populations within e18.5 cortex. Nova2-cTag mice were crossed with cell-specific Cre drivers for inhibitory neurons (Nova2-cTagGad2-Cre) and excitatory neurons (Nova2-cTagEmx1-Cre). GFP immunofluorescent staining on these mice showed successful Cre-dependent expression of NOVA2-AcGFP in the appropriate subsets of neurons (Figure S2B). Comparing the NOVA2 cTag-CLIP in inhibitory and excitatory neurons revealed significant enrichment of NOVA2 binding in a total of 923 and 791 transcripts, with 823 and 752 CLIP peaks specifically enriched to each neuronal subtype, respectively (FDR<0.05, ∣log2 fold change∣>=1) (Figure S2E). These results indicate that NOVA2 cTag-CLIP is able to discriminate large differences in NOVA2-RNA binding profiles between inhibitory and excitatory neurons. Taken together with prior cTag-PAPERCLIP studies of PABPC1 (Hwang et al., 2017, Jereb et al., 2018)), the cTag-CLIP platform provides broadly applicable approach to define RNA-protein interactions at cell-type resolution in vivo.
To search for NOVA2 directly-mediated regulation in selective neuronal populations, we first set out to define all AS events in Nova2-cKO by RNAseq (Figure 2E and 2F). Newly generated Nova2-cKO (Figure 2E and S2F) were crossed with the cell-specific Cre drivers mentioned above, and Cre-dependent NOVA2 protein depletion from a selective neuronal population at e18.5 in Nova2-cKO mice was confirmed by immunofluorescent staining on 4 mouse lines (ControltdTomato;Gad2-Cre, Nova2-cKOtdTomato;Gad2-Cre, ControltdTomato;Emx1-Cre, and Nova2-cKOtdTomato;Emx1-Cre; Figure 2G and S2G). tdTomato positive cells from control or Nova2-cKO crossed with Cre-driver lines were collected by FACS before subjected to RNA-seq and subsequent AS analysis (Figure 2F and S2H). 1,970 or 2,682 AS events displayed NOVA2-dependent splicing patterns in inhibitory and excitatory neurons, respectively (Figure 2F and S2H).
NOVA2 cTag-CLIP identifies cell-type specific functional RNA regulation in cortical development
The Dab1.7bc exons were previously identified as a NOVA2-dependent switch of Reelin-Dab1 signaling in cortex (Yano et al., 2010), however, it was not known which neuronal cell subtype NOVA2 acted on to mediate this developmental switch. Accordingly, we used cTag CLIP to assess whether NOVA2 acted in either Emx-1 positive excitatory neurons, Gad2 positive inhibitory neurons, or another cell type. cTag-CLIP revealed that enrichment of NOVA2 bound to sites previously identified upstream of Dab1.7bc exons in standard whole cortex CLIP (Yano et al., 2010) in excitatory when compared with inhibitory neurons (Figure 2H). Moreover, this binding difference corresponded to functional changes in alternative Dab1.7bc exon splicing, which was misregulated in RNAseq analysis of Nova2-cKO excitatory but not inhibitory neurons (Figure 2H), changes were confirmed by RT-PCR (Figure 2I). Stringent comparisons revealed that 3 of 53 stringently defined NOVA2 peaks on the Dab1 transcript showed significant differences between inhibitory or excitatory neuronal populations, and 1 of 3 NOVA2 peaks abutted the Dab1.7bc exon (Figure 2J); this peak was enriched in the excitatory neuronal population. As a measure of specificity, we noted that NOVA2 bound to other more distant sites within the Dab1 transcript to an equal extent in the different neuronal populations. These datasets demonstrate that NOVA2 binding to some particular positions, and its actions on splicing are distinct between cortical excitatory and inhibitory neuronal populations. Future refinement of such results with cTag-CLIP will depend on evolving technology, including the analysis of Cre expression from different drivers in precise (vs. mixtures) of neuronal sub-populations, and the expression level or ratio of RNA binding proteins and their target transcripts, which may vary between neuronal sub-populations.
The finding of NOVA2-specific AS regulation in excitatory neurons expressing Dab1.7bc led us to look at the developing cortex in mice specifically lacking NOVA2 in excitatory versus inhibitory cells. Nova2-cKOEmx1-Cre mice died between three and four weeks old and showed disorganized cortical and hippocampal CA1 and CA3 laminar structure (Figure 2K and Figure S2I), which requires proper Reelin signaling (Caviness and Sidman, 1973). In contrast, we found no neuronal migration or position abnormality in Nova2-cKOGad2-Cre mice. 3-week-old Nova2-cKOEmx1-Cre mice displayed reduced thickness of CA1 stratum lacunosum-moleculare (SLM) and dentate gyrus molecular layer (Figure S2J), and these changes were not present in Nova2-cKOGad2-Cre mice (data not shown). We conclude that combining data from Nova2-cTag and Nova2-cKO mouse brain provides a particularly powerful means of defining functionally distinct aspects of RNA regulation in different neuronal cell types, here defining neuronal-lineage selective NOVA2-mediated RNA regulation required for proper development of the neocortex and hippocampus.
NOVA2 characterizes cell-type specific exon skipping in inhibitory cerebellar Purkinje cells
NOVA2 functions in adult cerebellum have been unexplored because Nova2-KO mice die 2-3 weeks after birth (Saito et al., 2016). Here we investigated NOVA2-mediated RNA regulatory networks in adult Purkinje cells (PCs) using combined analysis of Nova2-cTag and Nova2-cKO data. Nova2-cTag mice were bred to Cre driver lines to generate mouse lines expressing NOVA2-AcGFP in the entire cerebellum (CMV-Cre), PCs (Pcp2-Cre) or granule cells (GCs) (vGlut1-Cre), respectively (Figure 3A and S3A). For each cTag/Cre driver line, NOVA2-AcGFP showed highly restricted and expected expression patterns in the cerebellum (Figure S3A). Comparison of pan-NOVA2 cTag-CLIP in 4 weeks old mouse cerebellum (NOVA2 cTagCMV-Cre-CLIP) and endogenous NOVA2 CLIP revealed highly similar tag coverage per transcript and per CLIP peak (Figure S3B), analogous to what was observed in cortex, indicating that the cTag strategy did not alter the RNA binding properties of NOVA2 in the adult cerebellum.
Figure 3. NOVA2 characterizes Purkinje-type exon skip.

(A) Schematics illustrating the overview for neuronal type specific NOVA2 cTag-CLIP in cerebellum. (B) The comparison of neuronal-type specific NOVA2 cTag-CLIP between Purkinje cells (PCs) and granule cells (GCs). Scatter plot shows the correlation of read counts on CLIP peaks between NOVA2 cTagPcp2-Cre-CLIP to NOVA2 cTagvGlut1-Cre-CLIP. Each black dot represents a comparable CLIP peak between two neuronal-type. Each orange or magenta dot represents a significantly enriched CLIP peak in either NOVA2 cTagPcp2-Cre-CLIP or cTagvGlut1-Cre-CLIP, respectively (FDR<0.05, ∣log2 FC∣>=1). R: correlation coefficient. (C) Genomic distribution of NOVA2 and NOVA2 cTag-CLIP unique tags. (D) Schematics illustrating the strategy for AS analysis in PCs. (E) Transcript abundance changes upon NOVA2 depletion from PCs determined by RNA-seq. The empirical cumulative distribution function of NOVA2 targets binned by NOVA2 cTagPcp2-Cre-CLIP peak tags. (F) AS changes depending on NOVA2 depletion from PCs. Scatter plot shows the exon inclusion rate of the 4 weeks old ControltdTomato; Pcp2-Cre and Nova2-cKOtdTomato; Pcp2-Cre determined by RNA-seq. Each black dot represents a comparative AS event. Each blue or limegreen dot indicates the significantly changed AS event which skipped in Nova2-cKOtdTomato; Pcp2-Cre (409 AS events) or included in Nova2-cKOtdTomato; Pcp2-Cre (194 AS events), respectively (n=3, FDR<0.05, (∣ΔI∣>=0.1). (G) Discovery of a PC-selective NOVA2 mediated AS event. UCSC genome browser view of around Arhgap26 AS exon 21 (NM_175164) (left). A significantly different NOVA2 CLIP peak among neuron-types was highlighted with purple shadow; peaks that were unchanged across all cell types are underscored with grey dotted shadow. RT-PCR confirmation of AS change detected by RNA-seq (right panels) (n=3). **; p<0.01, ***; p<0.001. (H & I) GCs-type exon inclusion in PCs of Nova2-cKO. ΔI of 1; ControltdTomato; Pcp2-Cre PCs layer (RNA-seq), 2; wild-type PCs (TRAP) or 3; wild-type GCs (TRAP; Mellén et al., 2012) versus Nova2-cKOtdTomato; Pcp2-Cre PCs layer (RNA-seq) (H). Schematics illustrating the AS patterns switch from inhibitory PCs-type to excitatory GCs-type in Nova2-cKOtdTomato; Pcp2-Cre PCs (I). “See also Figure S3 and Table S1.”
Comparison of the NOVA2 cTag-CLIP results in inhibitory Purkinje and excitatory granule neurons showed remarkable differences (Figure 3B and S3C). Large numbers of NOVA2 binding sites were significantly different in PCs versus GCs per transcript (4,840 in PCs versus 3,850 in GCs; FDR<0.05, ∣log2 fold change∣>=1); Figure S3C) and per CLIP peaks (3,234 in PCs versus 2,329 in GCs; FDR<0.05, ∣log2 fold change∣>=1) (Figure 3B). Interestingly, NOVA2 displayed higher 3’UTR binding (25%) in PCs relative to other neuronal-types (less than 10% each; Figure 3C). Despite these differences, NOVA2 retained its overall YCAY motif binding enrichment across all examined NOVA2 cTag-CLIP peaks (Figure S2D and S3D). Thus NOVA2 discriminates between cognate YCAY binding targets expressed in some of the same transcripts present in both cerebellar excitatory and inhibitory neurons.
We next investigated NOVA2-mediated regulation of RNA metabolism by comparing results with NOVA2 cTag-CLIP in individual cell types with results obtained by “cell-specific” RNA-seq. For this analysis, we performed RNA-seq on manually dissected PC enriched layers from acute cerebellar slices of ControltdTomato; Pcp2-Cre and Nova2-cKOtdTomato; Pcp2-Cre mice (Figure 3D and S3E). Known PC markers (Itpr1, Grid2, Calb1, Grm1) were significantly enriched in the dissected PC layer relative to whole cerebellar, while GCs markers (Neurod1, Slc17a7, Calb2, Rbfox3) were significantly depleted (FDR<0.01; Figure S3F). Since cTag-NOVA2 binding showed PC-specific enrichment in 3’UTRs (Figure 3C), we examined potential NOVA2-dependent RNA abundance changes in Nova2-cKOtdTomato; Pcp2-Cre versus ControltdTomato; Pcp2-Cre PCs. Transcripts with PC-specific NOVA2 binding in 3’UTRs showed decreased levels upon NOVA2 loss, while transcripts free of NOVA2 3’UTR binding sites did not show any overall differences (Figure 3E and S3G). This suggests that NOVA2 3’UTR binding specifically in Purkinje neurons promotes functional differences in mRNA stability in different cerebellar cell types.
We also examined NOVA2-dependent AS changes in RNA-seq from the dissected PCs layer or Nova2 ControltdTomato;Pcp2-Cre and Nova2-cKOtdTomato;Pcp2-Cre mice, and revealed a total or 603 NOVA2-dependent AS changes (Figure 3F). By overlaying these AS events with PC-specific NOVA binding sites defined from cerebellar and cortical NOVA2 cTag-CLIP, we identified 396 PC-specific NOVA2 target AS events (Figure S3H). For example, Arhgap26, the target antigen in a patient with subacute autoimmune cerebellar ataxia (Jarius et al., 2010), harbored an exon (exon 21) that was suppressed by NOVA2 in a PC-restricted manner (Figure 3G, RNA-seq track). PC-specific suppression of exon 21 correlated with a PC-specific and significant NOVA2 binding enrichment to immediately upstream of the regulated exon 21 (Figure 3G, CLIP tracks and Figure S3I); we consider this as PC-specific because no significant NOVA2 binding was evident at this site in other neuron-specific NOVA2 cTag-CLIP data and no loss of Nova2 dependent AS changes were evident in other neuronal cell-types (Figure 3G). Dlg2 also displayed PC specific NOVA2-dependent splicing change correlated with a PC-specific NOVA2 binding site (again, absent in neuron cTag CLIP peak and no AS change in loss of Nova2 in other neuron types) that was adjacent to the regulated AS exon (Figure S3I and S3J). Ccdc64 and Map4 AS were significantly changed in both PC and GC and NOVA2 binding patterns were comparative (Figure S3K).
We explored whether NOVA2 regulation might be involved in switching from GCs-like splicing to a unique PCs profile, based on our observation that NOVA2 mediated Arhgap26 exon 21 suppression in PCs (ControltdTomato;Pcp2-Cre) while in the absence of NOVA2 (Nova2-cKOtdTomato;Pcp2-Cre) splicing switched to inclusion exon 21 normally seen in GCs (lane 2 and 3 or 9 in Figure 3G right panel). We re-analyzed publically available translating ribosome affinity purification (TRAP) datasets of PCs and GCs with our AS analysis pipeline and identified a total of 6,163 AS events that were significantly different between PCs and GCs (Figure S3L; n=4, FDR<0.05, ∣ΔI∣>=0.1). NOVA2 promoted exon skipping in 75 cassette-type, and in Nova2-cKO PCs the resulting pattern was switched to a GCs-type splicing profile (Figure 3H-I).
Taken together, these analyses demonstrate that differential NOVA2 binding generates AS diversity within specific neuronal types and helps to define a subset of specific AS pattern on the same transcripts in different cell types.
Purkinje cell specific Nova2 deficiency leads progressive motor discoordination and cerebellar atrophy
We used functional annotation clustering to determine gene ontology (GO) terms enriched in the NOVA2-mediated PC-type AS targets (Figure 3H). Synapse related terms (synapse, presynaptic membrane, cell junction, neuronal cell body), intracellular signal transduction term, and kinase activity term were significantly enriched (Figure S4A). NOVA2-dependent AS events among these terms had potentials to convert protein-protein or protein-DNA interactions, or RNA stoichiometry (Figure S4B). This prompted us to investigate the role of NOVA2 in cerebellar PC synaptic and cellular functions. Immunofluorescent microscopy of Nova2-cKOPcp2-Cre PCs identified a marked defect in their dendritic morphology (Figure 4A). Nova2-cKOPcp2-Cre mice also had noticeable cerebellar atrophy (Figure 4B), motor coordination defects (Figure 4C and Movie S1), PC degeneration (Figure 4D and S4C), loss of synaptic layer thickness accompanied by neuritic swelling (Figure 4E, S4D, and S4E), and reduced spine density (Figure 4F). These results ranging from histological to physiological demonstrate that NOVA2 cTag reveals functions in a single neuronal cell-type that are essential in aggregate for cell-type specific neuronal morphology, activity and survival.
Figure 4. Purkinje cell specific Nova2 deficiency leads progressive motor discoordination and cerebellar atrophy.

(A) Selective NOVA2 depletion from PCs. NOVA2 (green), calbindin D28 (calb, red: PCs marker), and NeuN (blue: GCs marker) immunofluorescent staining images in the 4 weeks old cerebellum of ControlPcp2-Cre and Nova2-cKOPcp2-Cre. Scale bars: 25 μm. (B) Progressive cerebellar atrophy in the PCs specific Nova2-cKO mouse. Brain images of 16 weeks old ControlPcp2-Cre and Nova2-cKOPcp2-Cre mouse (left). Tissue weight of cerebellum and the other brain regions in 4 weeks old (4W) or 16 weeks old (16W) ControlPcp2-Cre and Nova2-cKOPcp2-Cre mouse (right) (n=3, *; p<0.05). Scale bars: 2 mm. (C) Progressive motor coordination defect in the PCs specific Nova2-cKO mouse. Rotarod test result at indicated age (weeks) (n>=5, **; p<0.01, ***; p<0.001). (D) PCs-degradation in the 12 months old PCs specific Nova2-cKO mouse. tdTomato immunostaining images with anti-mRFP antibody. Scale bars: 500 μm. (E) The climbing fiber innervation defect and reduced PCs molecular layer thickness upon PCs specific Nova2 deficiency. vGlut2 (green, climbing fiber terminal marker), calbindin D28 (red, PCs marker), and NeuN (blue, GCs marker) immunofluorescent staining images in the 16 weeks old ControlPcp2-Cre and Nova2-cKOPcp2-Cre mouse (upper left). Quantification analysis of vGlut2, calbindin D28, and NeuN fluorescent (n=3, ***; p<0.001) (upper right). Quantification analysis of GC and PC-ML layer thickness in 4W or 16W ControlPcp2-Cre and Nova2-cKOPcp2-Cre mouse (lower panel) (n=3, *; p<0.05, **; p<0.01). PC-ML: Purkinje cell and molecular layer. GC: granule cell layer. Scale bars: 25 μm. (F) Reduced PCs spine number upon the NOVA2 depletion. Golgi staining images of 16 weeks old ControlPcp2-Cre and Nova2-cKOPcp2-Cre mouse (left). Quantification of spine numbers per 10 nm dendrite length (neurons number >=14 from three biological replicates) (right). Scale bars: 25 μm. “See also Figure S4 and Movie S1.”
NOVA2 prevents introns retention serving as cis-acting scaffolds for PTBP2
We showed NOVA2-mediated AS diversity among the same transcripts expressed in different neuronal types (Figure 2 and Figure 3), raising the question of the mechanism by which this occurs. Following multiple lines of evidence (Coutinho-Mansfield et al., 2007; Markovtsov et al., 2000; Polydorides et al., 2000; Solana et al., 2016; Venables et al., 2013; Zhang et al., 2010; 2016) suggesting functional interactions between RBPs in vivo, we hypothesized that combinatorial RBP regulation contributes to cell-type specific AS regulation. Based on our RBP target AS analysis in Figure S1C, we found here that PTBP2, which has functional interactions with NOVA2 in vitro (Polydorides et al., 2000), has target AS events showing the greatest intersection with NOVA2 target AS events (Figure 5A) and therefore was a strong candidate for such a trans-acting factor.
Figure 5. NOVA2 prevents IR which serves as a cis-acting scaffold element for AS factor PTBP2.

(A) Intersection of NOVA2 and PTBP2 target AS events. The number of RBPs target AS events intersecting with NOVA2 target AS events. (B) Schematics illustrating the overview for PTBP2 CLIP in the presence or absence of NOVA2 in vivo. (C) UCSC genome browser views of examples for PTBP2 CLIP peak changes coupling with IR and AS changes. Magenta shadow represents a NOVA2 and/or PTBP2 target AS exon. PTBP2 CLIP height scale were fixed in same scale between wild type and Nova2-KO. (D) NOVA2 CLIP tags enriched in both 5’ and 3’end of retained introns. (E) IR recruits trans-acting AS regulator PTBP2. PTBP2 CLIP tag number counted on NOVA2-regulated IR (NOVA2-IRs) which were normalized to total PTBP2 CLIP tag number of each replicate (n=3). (F & G) AS difference in Nova2/Ptbp2-dKO which have IR and increased PTBP2 CLIP peak. (H) IR retains exon-intron junction. qPCR quantification of RNA retaining exon-intron junction (n=3, ; p<0.05). (I) NOVA2 expression increases during cortical development at the protein (upper panels: Western blot) and RNA (lower panel: RNAseq) levels; (J and K) those changes in NOVA2 levels in (I) are inversely related to a decrease of NOVA2-regulated IR (NOVA2-IRs) (J) and PTBP2 binding (K) to those NOVA2-IRs (normalized to both total CLIP tag number and abundance of transcript ***: p<0.001). (L) Cortical developmental stage specific PTBP2 target AS coupling to the degree of NOVA2 regulated IR. UCSC genome browser view of Dlg3 transcript (left: significantly different CLIP peak was highlighted with magenta shadow). Quantification of AS (RT-PCR) and exon-junction (qPCR) of Dlg3 transcript (right). N=3, *; p < 0.05, **; p < 0.01, ***: p < 0.001. “See also Figure S5 and Table S1.”
We studied PTBP2 binding differences in the presence or absence of NOVA2 by performing PTBP2 CLIP in the e18.5 cortex of wild type and Nova2-KO mice (Figure 5B). A total 3,471,193 and 3,706,283 PTBP2 CLIP unique tags were obtained from wild type and Nova2-KO cortices, respectively, with comparable CLIP tag genomic distributions (Figure 5B and S5A). PTBP2 CLIP peak heights in Nova2-KO were significantly higher in some neuronal cell-type selective NOVA2 AS targets (e.g. Itpr1 exon 37-38 and Slc8a1: see below), indicating that NOVA2 absence impacts PTBP2 binding, consistent with the hypothesis that the two interact.
Interestingly, we noted that elevated PTBP2 CLIP peak heights in Nova2-KO were associated with retained introns (Figures 5C and S5G), leading us to undertake a transcriptomewide search of NOVA2-dependent intron retention (NOVA2-IR). This identified a total of 265 retained introns whose differences were significantly increased both in Ribo-Zero and poly(A)-selected Nova2-KO RNA-seq libraries (Figure S5B, Figure 5C), and 93 of 265 NOVA2-IRs were around NOVA2-regulated AS exon. NOVA2 CLIP tags and peaks in wild-type mouse brain were enriched on the 5’ and 3’ end of NOVA2-IR but not in the other introns within the same transcripts (Figure 5D and S5C). No CLIP tag enrichment of several other RBPs to the 5’ and 3’ end of NOVA2-IR was identified (Figure 5D), indicating that NOVA2 is directly and specifically associated with IR removal, likely in conjunction with its local binding. PTBP2 CLIP tag numbers in NOVA2-IRs were significantly increased in Nova2-KO (Figure 5E) but were comparable in other introns or elsewhere in the same transcripts (Figure S5D). Overall, these results demonstrate that NOVA2 normally suppresses IR around NOVA2-regulated AS exons, and that in turn suppresses PTBP2 binding locally in cis on those transcripts; conversely, the absence of NOVA2 allows an increase in IR and concomitant increase in PTBP2 binding on those retained introns.
We assessed whether increased PTBP2 binding to retained introns in the absence of NOVA2 had a functional impact on AS, assessing protein binding by CLIP and AS by RNAseq in Nova2-KO and Ptbp2-KO cortex. We identified 3,415 significant AS events that changed in Nova2/Ptbp2-dKO (FDR<0.05, ∣ΔI∣>=0.1) relative to wild-type mice and 876 of these were uniquely changed in Nova2/Ptbp2-dKO (relatively to either single KO; Figure S5E). We observed two kinds of examples where AS events were additively or synergistically regulated by both NOVA2 and PTBP2 (Figure S5F), indicating that NOVA2 and PTBP2 can co-regulate the same AS events. Increased PTBP2 binding in NOVA2-IR was detected in AS events whose splicing patterns in Nova2/Ptbp2-dKO were distinct from those observed in Nova2- or Ptbp2-single KO: for example, Mcf2l, Itpr1 AS2 (exon37-38) in Figure 5C (see also Slc8a1, Agrn, Ppp3cb in Figure S5G). In contrast, changes in PTBP2 binding were not detected in AS events whose splicing patterns in Nova2/Ptbp2-dKO were comparable with Nova2-KO (e.g. Itpr1 AS1 (exon23) in Figure 5C). Similarly, PTBP2 binding was significantly higher in both NOVA2 and PTBP2-dependent AS events with NOVA2-IR than the others (Figure S5H). AS and IR differences were confirmed by RT-PCR and qPCR interrogating exon-intron junction reads, respectively (Figure 5F-H). Taken together, these results suggest a functional interaction between NOVA2 and PTBP2 includes NOVA2 regulation of IR as a scaffold for PTBP2 binding with the potential to impact AS regulation.
To assess whether such regulation naturally occurs in vivo (beyond our observations in Nova2-KO mice brain), we took advantage of the observation that Nova2 protein and RNA expression gradually increases during cortical development (Figure 5I). This increase correlated with decrease of NOVA2-IR (Figure 5J and S5I) and of PTBP2 binding (Figure 5K), which relevant to AS regulation mediated by PTBP2 in e12.5 cortex but not in e18.5 and to distinguishable AS pattern of Nova2/Ptbp2-double KO from Nova2-single KO (e.g. Dlg3 exon 15-17 in Figure 5L), indicating that IR regulation by NOVA2 contributes to alter PTBP2-mediated AS as cortical development proceeds. Taken together, these results are consistent with the suggestion that the trans-acting AS factor NOVA2 regulates IR which acts as a cis-acting scaffolding platform for PTBP2 and thereby allow PTBP2-mediated AS regulation.
As a measure of specificity, we noted that the degree of IR within developmentally regulated AS events was significantly higher than the other introns in same transcripts (Figure S5J). NOVA2 independent splicing and IR in Tnk2 transcript showed AS switch, decrease of IR, of PTBP2 binding, and of PTBP2-dependent AS effect according to cortical development (Figure S5K-M). These results demonstrate that IR acts as a variable cis-acting scaffolding platform for PTBP2 across various natural conditions.
NOVA2 prevents neuronal cell-type specific IR and diversify AS regulation
We found that NOVA2-IR was unique for each individual neuronal type and coupled to AS change. Such differential regulation was seen multiple transcripts, including Gphn, Itpr1, Slc8a1, and Arhgap26 (Figure 3G, 6A and S6A). For example, NOVA2-dependent Gphn AS2 changes were observed in Nova2-cKO Purkinje cells, but not in either cortical excitatory and inhibitory neuron (Figure 6A and 6B). Itpr1 AS1 was changed both in cortical excitatory neurons and Purkinje cells but not in cortical inhibitory neurons. Separately, an occult nonsense mediated decay (NMD) inducible exon within Itpr1 AS2 region, whose inclusion was correlate with decrease of ITPR1 protein amount (Figure S6B), was highly included in the cortical excitatory neurons and ~5% included in Purkinje cells, but not in cortical inhibitory neurons (Figure 6A and 6B). In each case, these neuronal cell-type specific NOVA2-regulated AS events were coupled to NOVA2 cTag-CLIP enrichment close to NOVA2-regulated exon and IR increases in the specific cell-type (Figure 6C and 6D). Taken together, these results reinforce the finding of diverse NOVA2 functions on the same transcripts expressed in different neuronal cell-type in vivo. Moreover, they indicate one potential mechanism by which such cell-type specificity is regulated: NOVA2-mediated IR removal can contribute to generate neuronal types specific mRNA regulatory diversity (Figure 6E).
Figure 6. NOVA2 prevents neuronal cell-type specific IR and diversify AS regulation.

(A) Neuronal subtype selective and NOVA2-dependent AS changes coupling with IR and NOVA2 cTag-CLIP peak enrichment. UCSC genome browser views of examples (Gphn and Itpr1). **; p<0.01, ***; p<0.001. (B) Quantification of AS difference by RT-PCR (n=3, *; p<0.05, **; p<0.01, ***; p<0.001). (C) NOVA2 cTag-CLIP peak enrichment normalized to RNA abundance and functional NOVA2 protein abundance. Each dot indicates an individual NOVA2 CLIP peak on either the Gphn or Itpr1 transcript (as for Figure 3I; p<0.01, Fisher’s exact test). (D) Cell type selective IR retains exon-intron junction. Quantification of transcripts or it retaining exon-intron junction by qPCR (n=3, *; p<0.05). Orange; Purkinje cells, red; cortical excitatory neurons, green; cortical inhibitory neurons. (E) Model Schematics for neuronal subtype specific AS and its regulatory mechanism. NOVA2 regulates exon definition and IR, which serves as a platform for trans-acting AS regulators (left). NOVA2 cTag-CLIP revealed different NOVA2 binding positions on the same transcripts in different neuronal cell-types in which NOVA2 regulates cell-type specific AS and promotes cell-type specific intron removal (right). This cell-type specific IR removal can alter other RBPs binding to intron and exon definition. “See also Figure S6.”
DISCUSSION
In the present work, we have found that a single splicing factor mediates AS diversity across different CNS regions, within individual neuronal subtypes in those regions, and with different mechanisms. These results rely on establishment of a new high-resolution CLIP platform technology, “cTag-CLIP”, to generate regulatory RBP-RNA interaction maps within very small neuronal subsets to their resolve RNA regulatory profiles. For example, with NOVA2 cTag-CLIP we were able to define hundreds of differential NOVA2 binding sites in inhibitory versus excitatory neuronal transcripts in the cortex. Moreover, we could extend the discrimination of differences mediated by the same regulatory protein and the same transcripts in different brain regions. For example, NOVA2 differentially regulates splicing of the transcript encoding the key Reelin signaling protein Dab1, with different consequences in cortical excitatory versus inhibitory neurons. As another example, we observe that NOVA2 regulates exclusion of an occult NMD exon in the Itpr1 transcript in excitatory but not inhibitory neurons in the cortex, yet shows the opposite pattern in the cerebellum, where it regulates the same exon in inhibitory Purkinje neurons (Figure 6A). Itpr1 mRNA was significantly reduced only in PC specific Nova2-cKO when compared with controls (Figure 6D), coincident with selective NOVA2 cTag-CLIP binding in the Itrp1 3’ UTR of PCs (Figure 6A and 6C), but not in cortical excitatory and inhibitory neuron transcripts, indicating that specific NOVA2 function in 3’UTR of Itpr1 in Purkinje cells to regulate mRNA abundance. Hence cTag-CLIP reveals for the first time the extent of fine tuning of RNA regulation, such that it can be tuned to differentially regulate distinct outcomes for the same transcripts in different cell types and brain regions.
We find that NOVA2 action relates to combinations of or competition to regulatory factors within the cells; unexpectedly, the titration of such factors appears to play a key role here. NOVA2 regulates removal of hundreds of retained introns, binding directly and specifically to those pre-mRNAs (Figure 5D). Moreover, NOVA2 cTag-CLIP reveals that NOVA2 suppresses IR uniquely in certain cell types, and as NOVA2 levels decrease, retained introns titrate binding of a second regulatory protein, PTBP2, revealing a tight and mechanistic coupling of splicing regulation with IR. We conclude that NOVA2 acts both as a trans-acting AS factor to determine exon definition and as a cis-acting AS element to regulate IR which can serve as scaffolds to alter RBP-RNA interactions of another trans-acting splicing factor (e.g. PTBP2). Taken together, our results illustrate how cTag-CLIP combined with genetic models can provide novel insights into RNA regulation, leading us to discover a new biological function of NOVA2 in IR and an unexpected role for mechanisms by which different trans-acting factors can interact to regulate splicing in different cell types.
The discriminatory ability of cTag-CLIP in the cerebellum revealed that while NOVA2 is expressed in both Purkinje (inhibitory) and granule (excitatory) neurons, it generates sharp differences in RNA-binding property in both cells. Dysregulation of NOVA2 functions including cell-type specific AS regulation leads to functional defects in the mouse brain; Nova2-cKO in cerebellar PCs leads to Purkinje cell dendritic shrinkage, death, cerebellar atrophy and a motor behavior defect. The PC selective NOVA2-regulated AS exon of Arhgap26 and Dlg2 codes amino acid nearby known protein domain SRC homology 3 domain (SH3) and PDZ domain, respectively, both of which are well-known domain important for protein-protein interaction. Moreover, NOVA2 regulated exons listed in Figure S5A coded amino acid including protein phosphorylation sites (Dlg2, Mtdh), protein-protein interaction domain or motif (Grin1, Erc2, Nrxn1, Snph, Plcb4), DNA binding domain (Smad2) (Figure S5B). This differential regulation may be important for maintaining the degree of cell type specific protein-protein interactions and signaling pathways required for maintaining morphology and survival of PCs. Interestingly, NOVA2-mediated AS of Grin1 alters the local architecture of heterotetrameric NMDA receptors and ion channel properties in NMDA receptors (Regan et al., 2018), suggesting that NOVA2 involves in controlling neuron-type specific NMDA receptor’s property, although we recognize that NMDA receptors may have a relatively minor role in Purkinje neurons. Such functional discrimination is not restricted to the cerebellum, as we also find that NOVA2 regulates cell-type specific function in cortical neurons, as evident from defects in cortical and hippocampal CA1 and CA3 laminar structure (Figure 2K and Figure S2I-J). We anticipate that NOVA2 AS regulation may be responsible for such changes, for example by regulating protein isoforms and thereby regulating neuronal type specific processes such as protein-protein interactions, which are required for the unique morphology or for the unique synaptic functions in individual neuronal type.
RNA processing diversity including AS among different neuronal types might be generated by the difference of RBPs expression ratio in each neuronal type, of RBPs or target RNA modification, and/or of unknown RBPs co-factor. There are clearly different expression levels of AS regulators (e.g. NOVA, RBFOX, ELAVL/Hu and PTBP2) across the CNS areas and neuronal types (Figure 1C; (Gehman et al., 2012; Ince-Dunn et al., 2012; Makeyev et al., 2007)). cTag CLIP in vivo cell-type specific approaches can provide mechanisms of RBPs-mediated RNA regulation diversity, including not only AS, but RNA stability, translation, and RNA modification across different neuronal types. Our observation connecting a major action of NOVA2 on IR in specific cell types and AS reflects recent studies demonstrating connections between IR and translation (Gill et al., 2017), neuronal activity (Mauger et al., 2016), RNA modification (Pendleton et al., 2017), and other aspects of cellular regulation in multiple cell types (Braunschweig et al., 2014) including cancer cells (Braun et a., 2017). More generally, applying our in vivo cTag strategy to cell-types vulnerable to disease may yield insight into how functions of these specific cell-types are disorganized when RNA control is dysregulated.
Overall, our in vivo cell-type specific approach offers novel insights into cell-specific RNA biology within intact living tissues. More generally, cTag CLIP provides a universal platform that can be extended to an array of RNA binding proteins and cell types to reveal mechanisms regulating metabolism of the same transcripts in different neuronal types to generate functional diversity.
STAR METHODS
LEAD CONTACT FOR REAGENT AND RESOURCE SHARING
Further information and requests for resources and reagents generated in this study should be directed to and will be fulfilled by the Lead Contact, Robert B. Darnell (darnelr@rockefeller.edu).
EXPERIMENTAL MODEL AND SUBJECT DETAILS
Generation of Nova2-cTag and Nova2-cKO mice lines
Nova2-cTag and Nova2-cKO targeting vectors were generated through standard restriction cloning. Nova2-cTag targeting vector contains the endogenous Nova2 exon 4 preserving 6.7 kb 3’ UTR, triple synthetic poly(A) sites preceding FRT-NEO-FRT cassette, and last coding exon of Nova2 fused to AcGFP sequence (Figure S2A). Nova2-cKO targeting vector contains Nova2 exon1 preceding FRT-NEO-FRT cassette (Figure S2F). Each construct was electroporated into Bruce 4 ES cells. Correctly targeted ES cells were injected into C57BL/6J blastocysts to screen for chimeras. Chimeric males were bred to C57BL/6J females to generate either heterozygous Nova2-cTag or Nova2-cKO. The FRT-NEO-FRT cassette was removed by breeding heterozygous Nova2-cTag or Nova2-cKO to ACTB-FLPe mice.
Animal experiments
All procedures were conducted according to the Institutional Animal Care and Use Committee (IACUC) guidelines at the Rockefeller University. C57BL/6J (Stock No. 000664), ACTB-FLPe (Stock No. 005703), tdTomato reporter (Stock No. 007914), CMV-Cre (Stock No. 006054), Emx1-Cre (Stock No. 005628), Gad2-Cre (Stock No. 010802), vGlut1-Cre (Stock No. 023527), and Pcp2-Cre (Stock No. 004146) mice were obtained from Jackson Lab. Nova2-KO and Ptbp2-KO mice were previously described (Licatalosi et al., 2012; Ruggiu et al., 2009; Saito et al., 2016; Yano et al., 2010). Mice were housed up to 5 mice per cage in a 12 hour light/dark cycle. For genotyping PCR experiment, mouse genomic DNA was extracted from a tail. The primer sequences are listed in Table S2. Mice of both sexes were pooled for the study. Sex-specific effects were not tested. 4-16 weeks old Nova2-cKOwt/wt; Pcp2-Cre+/− (ControlPcp2-Cre), Nova2-cKOFlox/wt; Pcp2-Cre+/− (Nova2-cKOPcp2-Cre het), and Nova2-cKOFlox/Flox; Pcp2-Cre+/− (Nova2-cKOPcp2-Cre homo) mice on a C57BL/6 background were used for rotarod test.
For fluorescence activated cell sorting (FACS), age-matched e18.5 mice cortex of ControltdTomato; Emx1-Cre, ControltdTomato; Gad2-Cre, Nova2-cKOtdTomato; Emx1-Cre, and Nova2-cKOtdTomato; Gad2-Cre, were digested with 2 mg/mL papain (Worthington; PAPL LSS03119)/Hibernate E minus calcium solution (BrainBits) (n=3). The resulted single cell suspension were subjected to FACS to collect tdTomato(+) and (−) cells.
The tissue region, age, genotype, and number used for CLIP experiment were listed in Table S3. Manually dissected tissue was homogenized 2-3 times by using 1 mL syringe with 20G x1 ½ needle in 1 mL ice-cold PBS. The tissue block solution was transferred to 6 well dishes (FALCON; 353046) on ice for UV-crosslinking. The UV-crosslinked tissue block was spun at 4°C and the pellet was stored at −80°C until usage (three biological replicates for each CLIP).
For immunohistochemistry and Golgi staining, e18.5, 3 weeks, 4 weeks, 16 weeks, or 1 year old mice were perfused with PBS and fixed with 4% praraformaldehyde (PFA)/PBS at 4 degrees overnight, and sequentially replaced to 15% sucrose/PBS and 30% sucrose/PBS at 4 degrees for cryo-protection, then embedded in OCT compound and stored at −80°C until usage.
For manual dissection of cerebellar Purkinje cell layer, cerebellar sections (200 μm) were prepared from 4 weeks old cerebellum of ControltdTomato; Pcp2-Cre and Nova2-cKOtdTomato; Pcp2-Cre by using tissue chopper (McILWAIN TISSUE CHOPPER) and were pooled in ice cold Hebernate EB complete (BrainBits). Purkinje cell layer was manually dissected from the sections by using tungsten dissection needle (ROBOZ; RS-6065) under the SteREO Discovery.V12 fluorescent microscope (Zeiss), snap-frozen in liquid nitrogen, and stored −80°C until usage.
METHOD DETAILS
Antibodies
Primary antibodies used for CLIP, immunofluorescent staining (IF), and western blots (WB) were: mouse anti-GFP ((Heiman et al., 2014), clones 19F7 and 19C8, cTag-CLIP), rat anti-GFP (nacalai tesque, GF090R, IF: 1/1,000), rabbit anti-Cux1 (Santa Cruz, sc-13024, IF: 1/200), mouse anti-GFP (Santa Cruz, sc-9996, WB: 1/1,1000), rabbit anti-mRFP/tdTomato (ROCKLAND, 600-401-379, IF: 1/2,000), rabbit anti-NeuN/RBFOX3 (Millipore, ABN78, IF: 1/1,000), guinea pig anti-NeuN/RBFOX3 (Millipore, ABN90P, IF: 1/1,000), goat anti-NOVA2 (Santa Cruz, sc-10546, IF; 1/500, WB; 1/2,000, CLIP), rabbit anti-NOVA1 [EPR13847] (abcam, ab183024, IF: 1/1,1000), human anti-pan NOVA (anti-NOVA paraneoplastic human serum, WB: 1/5,000), rabbit anti-PTBP2 (Polydorides et al., 2000, IF:1/5,000, CLIP), guinea pig anti-vGlut1 (Synaptic System, 135 304, IF:1/2,000), rabbit anti-vGlut2 (Synaptic System, 135 403, IF: 1/2,000), mouse anti-VGAT (Synaptic System, 131 011, IF:1/1,000), rabbit anti-Calbindin D28 (Millipore, AB1778, IF: 1/1,000), goat anti-Calbindin D28 (Santa Cruz, sc-7691, IF: 1/500), rabbit anti-ITPR1/InsP3R, type1 (Millipore, ABS55, IF:1/2,000), mouse anti-GAPDH (Santa Cruz, sc-32233, WB: 1/1,000).
Fluorescence activated cell sorting and purification of granule cells
Age-matched e18.5 mice cortex of ControltdTomato; Emx1-Cre, ControltdTomato; Gad2-Cre, Nova2-cKOtdTomato; Emx1-Cre, and Nova2-cKOtdTomato; Gad2-Cre were digested with 2 mg/mL papain (Worthington; PAPL LSS03119) in Hibernate E minus calcium solution (BrainBits) for 15 min at 37°C (n=3 for each genotype), added 1/5 volume of 1 mg/mL DNase I/Hibernate E minus calcium solution, incubated for 5 min at 37°C, and transferred on ice. After 2 times wash with ice cold Hibernate EB solution (BrainBits), tissues were gently pipetted 7-10 times with 1,000 μL tip. Large clumps of cells were removed using a cell strainer (BD Biosciences). The single cell suspensions were centrifuged for 2 min at 4°C and re-suspended with ice cold 3% FBS/PBS with 100 ng/mL DAPI. Large clumps of cells were removed using a cell strainer (BD Biosciences) again. tdTomato positive cells or negative cells were sorted into each tube filled with Trizol LS (ambion; 10296010) on a BD FACSAria Cell Sorter (BD Biosciences). DAPI positive cells were excluded from samples. Granule cells were prepared as described (Hatten, 1985) with modifications. Briefly, cerebella were dissected away from the brains of P14 mice. After the pial layer was peeled away, the tissue was treated with papain for 30 minutes at 37°C and triturated into a single-cell suspension using fine bore Pasteur pipettes. The suspension was layered on a discontinuous Percoll gradient and separated by centrifugation. The small cell fraction was isolated, and granule cells were further enriched by panning on tissue culture treated plastic dishes. The resulting cultures routinely contain greater than 95% of cells of the granule cell lineage (Hatten, 1985). RNA was isolated for analysis.
RT-PCR
RNA was reverse transcribed using SuperScript III First-Strand synthesis System for RT-PCR (Invitrogen; 18080-051). qRT-PCR was performed with FastStart SYBR Green Master (Roche; 04 673 492 001) on BIO-RAD TouchTM Real-Time PCR Detection System. The following programme was carried to 40 cycles: 30 s 95 °C (denaturation); 30 s 58 °C (annealing); and 20 s 72 °C (extension). Results were analysed by ΔΔCt, using Actb mRNA for normalization. Semi-quantitative RT-PCR was performed as previously described (Saito et al., 2016).
SDS-PAGE and Western blots
E18.5 whole cortex or P28 whole cerebellum were lysed in PXL buffer (1x PBS; 0.1% SDS; 0.5% Na-DOC; 0.5% NP-40) and lysates (10 ug protein/lane) were separated by NuPAGE™ 4-12% Bis-Tris Protein Gel (Invitrogen; NP0323BOX) and transferred to nitrocellulose blotting membrane (GE Healthcare Life science; 10600002). Antibodies used were listed above. Western blots were quantified normalizing each lane by the GAPDH signal to control for loading differences.
Immunostaining and Golgi staining
Single cell suspensions prepared with same procedure of FACS from 4 individual e18.5 wild type cortex were plated on dish. After 20 min incubation at 37 degree and 5% CO2 in NbActiv4 media (BrainBits), the cells were fixed with 4%PFA and stained with NeuN/RBFOX3 (neuron marker) together with GFAP (astrocytes marker) or ALDH1L1 (astrocytes marker). Nuclear were counter stained with DAPI. Marker positive and DAPI positive cells were counted and quantified. Immunohistochemistry was performed as previously described (Saito et al., 2016). Briefly, 3 or 4 weeks old mice brains were perfused with PBS and fixed with 4% paraformaldehyde (PFA)/PBS at 4 degrees overnight or e18.5 mice brain were fixed with 4% PFA/PBS at 4 degrees overnight, and sequentially replaced to 15% sucrose/PBS and 30% sucrose/PBS at 4 degrees for cryo-protection, then embedded in OCT compound. Frozen brains were sliced into 30 μm (for 4 weeks old mice) or 80 μm (for e18.5 mice) thick sections on a cryostat (CM3050S, LEICA). Brain sections were subjected to immunohistochemistry. These samples were washed three times with PBS at room temperature (RT), incubated with 0.2% Triton X-100/PBS for 15 min at RT, blocked with 1.5% normal donkey serum (NDS)/PBS for 1 hr at RT, and then incubated overnight at 4 degrees with primary antibodies in 1.5% NDS/PBS followed by incubation with Alexa 488, 555 or 647 conjugated donkey secondary antibodies (1:1000) in 1.5% NDS/PBS. Golgi staining were performed according to FD Rapid GolgiStain™ Kit (FD NeuroTechnologies, INC.) manual. Images of specimens were collected by BZ-X700 (KEYENCE) microscope.
Rotarod test
Mice (4, 6, 8, 10, 12, 14, and 16 weeks of age, n>=5 per group) were allowed to acclimate in a behavioral room for 1 hr and then placed on an accelerating rotarod (Med-Associates). On day one only mice were trained. Mice were considered trained when they could stay on the apparatus rotating at 4 RPM without falling for 1 min or until they fell off 5 times. During test trails animals were placed on apparatus rotating at 4 RPM, which was gradually increased to 40 RPM over 5 mins. Latency to fall (in seconds) from the rotating bar was recorded. Mice were rested for 5 min and repeated two additional times per day for three consecutive days. A mouse’s latency to fall for each day was recorded as the mean latency of the three consecutive trials and data are reported ± SEM.
RNA-seq library preparation and analysis
mRNA-seq libraries were prepared from Trizol extracted RNA following Illumina TruSeq protocols for Ribo-zero or poly-A selection, fragmentation, and adaptor ligation. Multiplexed libraries were sequenced as 125 nt paired-end runs on HiSeq-2500 platforms at New York Genome Center. These raw datasets and processed data files have been deposited into Gene Expression Omnibus (GSE103316). The publically available RNA-seq and TRAP datasets used in this study were listed in Table S3. Reads were aligned to the mm10 build of the mouse genome using OLego (Wu et al., 2013), and AS and gene expression were analyzed using the Quantas pipeline (Charizanis et al., 2012; Yan et al., 2015). Transcripts isoform abundance in RNA-seq datasets was estimated using Kallisto (Bray et al., 2016) with customized aggregation index. The mRNA abundance change was assessed by differential analysis of raw sequencing counts in edgeR using TMM methodology. For IR analysis, exon and intron information was obtained from Refseq and Quantas databases, and removed duplicated exons and introns. RNA-seq reads mapped on only either intron or exon-intron junction were used for counting the number of reads on either intron or exon-intron junction, respectively.
Intron Retention score (IR score) was calculated as follows. For each intron, a unique IR was determined by counting intron or exon-intron junction reads; these were then normalized with total reads counted on its gene and with intron and gene length for each biological replicate. Each IR score was subjected to differential analysis to calculate a p value (edgeR). Short introns (less than 250 nt) and introns of low expression genes (less than 100 RNA-seq reads counted on gene for each replicate were excluded from analysis. 265 introns (intron reads; log2FC(Nova2-KO/wild-type)>0.6 and p<0.01 in both Ribo-zero and Poly(A)+ libraries, and 3’ and 5’ exon-intron junction reads; log2FC(Nova2-KO/wild-type)>0.6 and p<0.01 in either Ribo-zero or Poly(A)+ library) were defined as NOVA2-dependent retained introns (NOVA2-IR) (GSE103316). Low coverage introns (average exon-intron junction reads less than 5 reads in Nova2-KO) were excluded from analysis.
Multiplexed CLIP library preparation
PTBP2 CLIP in the e12.5 and e18.5 cortex of wild type and e18.5 Nova2-KO and NOVA2 CLIP in P28 cerebellum were performed generally following previous work (Licatalosi et al., 2012; Saito et al., 2016) combining with multiplexed step (Luna et al., 2015). The publically available CLIP datasets used in this study were listed in Table S3 (NOVA2, MBNL1, RBFOX1/2/3, and nSR100/SRRM4 CLIP). NOVA2 cTag-CLIP was performed as previously described (Ule et al., 2005a) with the following modifications. UV-crosslinked NOVA2-AcGFP::RNA complex extracted using ice cold PXL buffer were immunoprecipitated using mouse monoclonal anti-GFP clones 19F7 (12.5 μg) and 19C8 (12.5 μg) mixture with 200 μL of Dynabeads™ Protein G magnetic beads (Thermo Fisher SCIENTIFIC; 10009D). The mouse brain samples used for NOVA2 cTag-CLIP was listed in Table S3. For controls, mouse brain (no UV irradiation, Nova2-cTagCre(−), and overdigested control) were used. Prior to phosphatase treatment, beads were washed 2 times with each in a series of wash buffers (see below). NOVA2-AcGFP bound RNA fragments were ligated to a degenerate 5’ RNA linker. The two-step PCR amplification was performed with AccuPrime™ Pfx Polymerase (Invitrogen). cDNA was then amplified with MSFP3 and indexed MSFP5 primers pair (Luna et al., 2015). Samples were sequenced (single-end 75 nt) on the MiSeq system (Illumina).
Wash buffers; Wash buffer 1 (PXL) [1xPBS; 0.1%SDS; 0.5%Na-DOC; 0.5% NP-40], Wash buffer 2 [15 mM Tris, pH7.4; 5 mM EDTA; 2.5 mM EGTA; 1% Triton X-100; 1% Na-DOC; 0.1% SDS; 120 mM NaCl; 25 mM KCl], Wash buffer 3 [15 mM Tris, pH7.4; 5 mM EDTA; 2.5 mM EGTA; 1% Triton X-100; 1% Na-DOC; 0.1% SDS; 1 M NaCl], Wash buffer 4 [15 mM Tris, pH7.4; 5 mM EDTA], Wash buffer 5 [50 mM Tris, pH7.4; 10 mM MgCl2; 0.5% NP-40].
Analysis of CLIP data
Analysis of CLIP data were carried out similar to previous reports (Moore et al., 2014; Shah et al., 2017). Data was visualized with UCSC genome browser (http://genome.ucsc.edu/). To reduce mis-alignments due to sequencing errors, reads were initially filtered based on quality score (≥20 in the degenerate linker region; average of ≥20 in the remaining read). Exact sequences were collapsed to remove PCR duplicates and de-multiplexed. The degenerate barcode was removed and the 3’ linker was trimmed. CLIP reads were mapped on the mm10 build of the mouse genome by novoalign (www.novocraft.com). Only unique tags were used for subsequent analyses. All scripts used in the analysis including the peak finding algorithm and more information can be publically obtained at http://zhanglab.c2b2.columbia.edu/index.php/Resources.
Protein domain Analysis
Protein domains were analyzed using Pfam (Finn et al., 2014)
QUANTIFICATION AND STATISTICAL ANALYSIS
Alternative splicing quantification
RNA-seq data were aligned with OLego de-novo splicing aligner. AS were quantified using Quantas. Quantas calculates exon inclusion rate and differential exon inclusion rate between two groups (ΔI). Fisher exact test in Quantas was used to call FDR adjusted P values. We used FDR < 0.05 and ΔI > ∣0.1∣ as significant AS events.
CLIP peaks enrichment
CLIP peaks were called by using all unique cTag-CLIP tags (Shah et al., 2017), and normalized to both RNA abundance (RNA-seq reads per transcript) and functional NOVA2 amount (CLIP read number per each transcript) of each cell-type. Fold change between the different neuronal cell-type was calculated by using the normalized CLIP peak height. Fisher’s exact test was used for calling p value.
For analyses that normalize CLIP data to both RNAseq and estimated protein levels (Figure 2l, Figure S3l, and Figure 6C), we took the following approach. The quantitative normalization of functional NOVA2 protein was normalized by the tag number/peak for specific sites/CLlP peaks to tag number for the entire transcript, and comparing resulted parameters in different cell types. We then re-analyzed our CLIP peak enrichment relative to normalized total CLIP tags/transcript and to mRNA abundance.
One reason to approach NOVA2 protein normalization cautiously (in addition to addressing the issue by RNAseq and quantitative IF) is that we ideally want to normalize to total functional NOVA2 present in the entirety of each cell type. RNAseq per cell does not, for example, discriminate between different phosphorylated isoforms of the protein (see for example Ule, Stefanni et al, Nature 2006), and neither RNAseq nor IF is able to satisfactorily (in our view) quantitate NOVA2 protein present through the cell body and the entire dendritic tree and NOVA protein is clearly present and associated with target transcripts in both locations (see e.g. Racca et al., 2010). Given these limitations, we believe that normalizing to total functional NOVA2 binding across transcripts provides a fair proxy with which to quantitatively estimate functional NOVA2 regulatory capacity per cell type.
DATA AND SOFTWARE AVAILABILITY
The GEO accession number for NOVA2 cTag-CLIP and RNA-seq originated from this study is GSE103316.
Supplementary Material
Movie S1. Related to Figure 4. Motor coordination defect in Nova2-cKOPcp2-Cre mouse. Movie of motor coordination defect in 13 weeks old Nova2-cKO”Pcp2-Cre mouse.
Table S1. Related to Figure 1-3, and 5. RBPs target AS events and NOVA2 target AS events in selective neuronal cell-types. RBPs target AS events in each RBPs-KO were listed.
KEY RESOURCES TABLE
| REAGENT or RESOURCE | SOURCE | IDENTIFIER |
|---|---|---|
| Antibodies | ||
| HtzGFP19C8 (Mouse monoclonal anti-GFP) | Heiman et al. Nat Protocols. 2014 | N/A |
| HtzGFP19F7 (Mouse monoclonal anti-GFP) | Heiman et al. Nat Protocols. 2014 | N/A |
| Mouse monoclonal anti-GFP | Santa Cruz | Cat# sc-9996 RRID: AB_627695 |
| Rat anti-GFP | Nacalai Tesque | Cat# GF090R RRID: AB_2314545 |
| Rabbit anti-mRFP | ROCKLAND | Cat# 600–401-379 RRID: AB_2209751 |
| Rabbit anti-NeuN | Millipore | Cat# ABN78 RRID: AB_10807945 |
| Guinea pig anti-NeuN | Millipore | Cat# ABN90P RRID: AB_2341095 |
| Goat anti-NOVA2 | Santa Cruz | Cat# sc-10546 RRID: AB_2151558 |
| Rabbit anti-NOVA1 [EPR13847] | Abcam | Cat# ab183024 RRID: AB_2632587 |
| Human anti-pan NOVA | Yang et al. Proc Natl Acad Sci USA. 1998 | N/A |
| Rabbit anti-PTBP2 | Polydorides et al. Proc Natl Acad Sci USA. 2000 | N/A |
| Guinea pig anti-vGlut1 | Synaptic System | Cat# 135 304 RRID: AB_887878 |
| Rabbit anti-vGlut2 | Synaptic System | Cat# 135 403 RRID: AB_887883 |
| Mouse anti-VGAT | Synaptic System | Cat# 131 011 RRID: AB_887872 |
| Rabbit anti-Calbindin D-28K | Millipore | Cat# AB1778 RRID: AB_2068336 |
| Goat anti-Calbindin D28K | Santa Cruz | Cat# sc-7691 RRID: AB_634520 |
| Rabbit anti-ITPR1/InsP3R, type1 | Millipore | Cat# ABS55 RRID: AB_10807271 |
| Mouse anti-GAPDH | Santa Cruz | Cat# sc-32233 RRID: AB_627679 |
| Rabbit anti-Cux1/CDP (M-222) | Santa Cruz | Cat# sc-13024 RRID: AB_2261231 |
| Bacterial and Virus Strains | ||
| None | ||
| Biological Samples | ||
| None | ||
| Chemicals, Peptides, and Recombinant Proteins | ||
| None | ||
| Critical Commercial Assays | ||
| FD Rapid GolgiStain™ Kit | FD NeuroTechnologies, INC. | Cat# PK401A |
| Dynabeads mRNA Purification Kit | Ambion | Cat# 61006 |
| Ribo-Zero rRNA Removal Kit (Human/Mouse/Rat) | Illumina | Cat# MRZH116 |
| TruSeq RNA Sample Preparation Kit v2 | Illumina | Cat# RSS-122–2001 |
| Deposited Data | ||
| NOVA2 cTag-CLIP and PTBP2 CLIP | This Paper | GSE103316 |
| RNA-seq | This Paper | GSE103316 |
| See Table S3 for additional GEO/SRA datasets. | ||
| Experimental Models: Cell Lines | ||
| None | ||
| Experimental Models: Organisms/Strains | ||
| Nova2-cTag | This Paper | N/A |
| Nova2-cKO | This Paper | N/A |
| CMV-Cre | The Jackson Lab | Cat# 006054 |
| Emx1-Cre | The Jackson Lab | Cat# 005628 |
| Gad2-Cre | The Jackson Lab | Cat# 010802 |
| vGlut1-Cre/Slc17a7-Cre | The Jackson Lab | Cat# 023527 |
| Pcp2-Cre | The Jackson Lab | Cat# 004146 |
| tdTomato reporter | The Jackson Lab | Cat# 007914 |
| Nova2-KO | Saito et al., eLife 2016 | N/A |
| Ptbp2-KO | Licatalosi et al., Genes Dev. 2012 | N/A |
| Nova2/Ptbp2-dKO | This Paper | N/A |
| Oligonucleotides | ||
| See Table S1 for the list of primers. | ||
| Recombinant DNA | ||
| None | ||
| Software and Algorithms | ||
| CLIP Tool Kit (CTK) | Zhang lab (https://zhanglab.c2b2.columbia.edu/index.php/CTK_Documentation) | N/A |
| OLego | Zhang lab (https://zhanglab.c2b2.columbia.edu/index.php/OLego_Documentation) | N/A |
| Quantas | Zhang lab (https://zhanglab.c2b2.columbia.edu/index.php/Quantas_Documentation) | N/A |
| Kallisto 0.43.0 | Bray et al. Nat Biotechnology. 2016 | https://github.com/pachterlab/kallisto |
| Other | ||
| None | ||
HIGHLIGHTS.
cTag-CLIP provides a strategy to study cell-specific RNA regulation in vivo
NOVA2 controls unique RNA splicing programs in inhibitory and excitatory neurons
NOVA2 cTag-CLIP reveals a new mechanism of cell-specific AS regulation
NOVA2 regulates intron retention as a cis-acting scaffold for AS factor PTBP2
ACKNOWLEDGEMENTS
We thank Darnell lab members for suggestions, expertise, and feedback. This work was supported by funds from the National Institutes of Health to R.B.D. (NS034389, NS081706, NS097404, and 1UM1HG008901) and to D.D.L (R01 GM107331) and the Simons Foundation to R.B.D. (SFARI 240432). Y.S. is a recipient of JSPS postdoctoral fellowship for research abroad and Naito Foundation. R.B.D. is an Investigator of the Howard Hughes Medical Institute.
Footnotes
Publisher's Disclaimer: This is a PDF file of an unedited manuscript that has been accepted for publication. As a service to our customers we are providing this early version of the manuscript. The manuscript will undergo copyediting, typesetting, and review of the resulting proof before it is published in its final citable form. Please note that during the production process errors may be discovered which could affect the content, and all legal disclaimers that apply to the journal pertain.
Declaration of Interests
The authors declare no competing interests.
REFERENCES
- Amara SG, Jonas V, Rosenfeld MG, Ong ES, and Evans RM (1982). Alternative RNA processing in calcitonin gene expression generates mRNAs encoding different polypeptide products. Nature 298, 240–244 [DOI] [PubMed] [Google Scholar]
- Braun JC, Stanciu M, Boutz LP, Patterson CJ, Calligaris D, Higuchi F, Neupane R, Fenoglio S, Cahill PD, Wakimoto H, Agar YRN, Yaffe BM, Sharp AP, Hemann TM, Lees AJ (2017) Coordinated Splicing of Regulatory Detained Introns within Oncogenic Transcripts Creates an Exploitable Vulnerability in Malignant Glioma. Cancer Cell, 32, 411–426 [DOI] [PMC free article] [PubMed] [Google Scholar]
- Braunschweig U, Barbosa-Morais NL, Pan Q, Nachman EN, Alipanahi B, Gonatopoulos-Pournatzis T, Frey B, Irimia M, and Blencowe BJ (2014). Widespread intron retention in mammals functionally tunes transcriptomes. Genome Res. 24, 1774–1786 [DOI] [PMC free article] [PubMed] [Google Scholar]
- Bray NL, Pimentel H, Melsted P, and Pachter L (2016). Near-optimal probabilistic RNA-seq quantification. Nat. Biotechnol 34, 525–527 [DOI] [PubMed] [Google Scholar]
- Buckanovich RJ, and Darnell RB (1997). The neuronal RNA binding protein Nova-1 recognizes specific RNA targets in vitro and in vivo. Mol. Cell. Biol 17, 3194–3201 [DOI] [PMC free article] [PubMed] [Google Scholar]
- Calarco JA, Superina S, O’Hanlon D, Gabut M, Raj B, Pan Q, Skalska U, Clarke L, Gelinas D, van der Kooy D, et al. (2009). Regulation of vertebrate nervous system alternative splicing and development by an SR-related protein. Cell 138, 898–910 [DOI] [PubMed] [Google Scholar]
- Caviness VS, and Sidman RL (1973). Retrohippocampal, hippocampal and related structures of the forebrain in the reeler mutant mouse. J. Comp. Neurol 147, 235–254 [DOI] [PubMed] [Google Scholar]
- Charizanis K, Lee K-Y, Batra R, Goodwin M, Zhang C, Yuan Y, Shiue L, Cline M, Scotti MM, Xia G, et al. (2012). Muscleblind-like 2-mediated alternative splicing in the developing brain and dysregulation in myotonic dystrophy. Neuron 75, 437–450 [DOI] [PMC free article] [PubMed] [Google Scholar]
- Coutinho-Mansfield GC, Xue Y, Zhang Y, and Fu X-D (2007). PTB/nPTB switch: a post-transcriptional mechanism for programming neuronal differentiation. Genes Dev 21, 1573–1577 [DOI] [PubMed] [Google Scholar]
- Darnell RB (2013). RNA protein interaction in neurons. Annu Rev Neurosci [DOI] [PMC free article] [PubMed] [Google Scholar]
- Eom T, Zhang C, Wang H, Lay K, Fak J, Noebels JL, and Darnell RB (2013). NOVA-dependent regulation of cryptic NMD exons controls synaptic protein levels after seizure. eLife 2, e00178. [DOI] [PMC free article] [PubMed] [Google Scholar]
- Finn RD, Bateman A, Clements J, Coggill P, Eberhardt RY, Eddy SR, Heger A, Hetherington K, Holm L, Mistry J, et al. (2014). Pfam: the protein families database. Nucleic Acids Res. 42, D222–D230 [DOI] [PMC free article] [PubMed] [Google Scholar]
- Gehman LT, Meera P, Stoilov P, Shiue L, O’Brien JE, Meisler MH, Ares M, Otis TS, and Black DL (2012). The splicing regulator Rbfox2 is required for both cerebellar development and mature motor function. Genes Dev. 25, 445–460 [DOI] [PMC free article] [PubMed] [Google Scholar]
- Gill J, Park Y, McGinnis JP, Perez-Sanchez C, Blanchette M, and Si K (2017). Regulated Intron Removal Integrates Motivational State and Experience. Cell 169, 836–848.e15 [DOI] [PMC free article] [PubMed] [Google Scholar]
- Hatten ME, (1985). Neuronal regulation of astroglial morphology and proliferation in vitro. The Journal of Cell Biology 100, 384–396 [DOI] [PMC free article] [PubMed] [Google Scholar]
- Heiman M, Kulicke R, Fenster RJ, Greengard P, and Heintz N (2014). Cell type-specific mRNA purification by translating ribosome affinity purification (TRAP). Nat Protoc 9, 1282–1291 [DOI] [PMC free article] [PubMed] [Google Scholar]
- Huang CS, Shi S-H, Ule J, Ruggiu M, Barker LA, Darnell RB, Jan YN, and Jan LY (2005). Common molecular pathways mediate long-term potentiation of synaptic excitation and slow synaptic inhibition. Cell 123, 105–118 [DOI] [PubMed] [Google Scholar]
- Hwang H-W, Saito Y, Park CY, Blachere N, Tajima Y, Zucker-Scharff I, Darnell RB (2017) cTag-PAPERCLIP reveals alternative polyadenylation promotes cell-type specific protein diversity in the brain to upregulate ARAF after microglia activation. Neuron 95, 1334–1349 [DOI] [PMC free article] [PubMed] [Google Scholar]
- Ince-Dunn G, Okano HJ, Jensen KB, Park W-Y, Zhong R, Ule J, Mele A, Fak JJ, Yang C, Zhang C, et al. (2012). Neuronal Elav-like (Hu) proteins regulate RNA splicing and abundance to control glutamate levels and neuronal excitability. Neuron 75, 1067–1080 [DOI] [PMC free article] [PubMed] [Google Scholar]
- Jarius S, Wandinger KP, Horn S, Heuer H, and Wildemann B (2010). A new Purkinje cell antibody (anti-Ca) associated with subacute cerebellar ataxia: immunological characterization. J Neuroinflammation 7, 21. [DOI] [PMC free article] [PubMed] [Google Scholar]
- Jensen KB, Dredge BK, Stefani G, Zhong R, Buckanovich RJ, Okano HJ, Yang YY, and Darnell RB (2000). Nova-1 regulates neuron-specific alternative splicing and is essential for neuronal viability. Neuron 25, 359–371 [DOI] [PubMed] [Google Scholar]
- Jereb S, Hwang H-W, Otterloo EV, Govek E-E, Fak JJ, Yuan Y, Hatten ME, Darnell RB (2018) Differential 3’ processing of specific transcripts expands regulatory and protein diversity across neuronal cell types. eLife 7, e34042. [DOI] [PMC free article] [PubMed] [Google Scholar]
- Lewis HA, Chen H, Edo C, Buckanovich RJ, Yang YY, Musunuru K, Zhong R, Darnell RB, and Burley SK (1999). Crystal structures of Nova-1 and Nova-2 K-homology RNA-binding domains. Structure 7, 191–203 [DOI] [PubMed] [Google Scholar]
- Li Q, Zheng S, Han A, Lin C-H, Stoilov P, Fu X-D, and Black DL (2014). The splicing regulator PTBP2 controls a program of embryonic splicing required for neuronal maturation. eLife 3, e01201. [DOI] [PMC free article] [PubMed] [Google Scholar]
- Licatalosi DD, Mele A, Fak JJ, Ule J, Kayikci M, Chi SW, Clark TA, Schweitzer AC, Blume JE, Wang X, et al. (2008). HITS-CLIP yields genome-wide insights into brain alternative RNA processing. Nature 456, 464–469 [DOI] [PMC free article] [PubMed] [Google Scholar]
- Licatalosi DD, Yano M, Fak JJ, Mele A, Grabinski SE, Zhang C, and Darnell RB (2012). Ptbp2 represses adult-specific splicing to regulate the generation of neuronal precursors in the embryonic brain. Genes Dev. 26, 1626–1642 [DOI] [PMC free article] [PubMed] [Google Scholar]
- Lovci MT, Ghanem D, Marr H, Arnold J, Gee S, Parra M, Liang TY, Stark TJ, Gehman LT, Hoon S, et al. (2013). Rbfox proteins regulate alternative mRNA splicing through evolutionarily conserved RNA bridges. Nat. Struct. Mol. Biol 20, 1434–1442 [DOI] [PMC free article] [PubMed] [Google Scholar]
- Luna JM, Scheel TKH, Danino T, Shaw KS, Mele A, Fak JJ, Nishiuchi E, Takacs CN, Catanese MT, de Jong YP, et al. (2015). Hepatitis C Virus RNA Functionally Sequesters miR-122. Cell 160, 1099–1110 [DOI] [PMC free article] [PubMed] [Google Scholar]
- Makeyev EV, Zhang J, Carrasco MA, and Maniatis T (2007). The MicroRNA miR-124 promotes neuronal differentiation by triggering brain-specific alternative pre-mRNA splicing. Mol. Cell 27, 435–448 [DOI] [PMC free article] [PubMed] [Google Scholar]
- Markovtsov V, Nikolic JM, Goldman JA, Turck CW, Chou MY, and Black DL (2000). Cooperative assembly of an hnRNP complex induced by a tissue-specific homolog of polypyrimidine tract binding protein. Mol. Cell. Biol 20, 7463–7479 [DOI] [PMC free article] [PubMed] [Google Scholar]
- Mauger O, Lemoine F, and Scheiffele P (2016) Targeted intron retention and excision for rapid gene regulation in response to neuronal activity. Neuron 92, 1266–1278 [DOI] [PubMed] [Google Scholar]
- Mellén M, Ayata P, Dewell S, Kriaucionis S, and Heintz N (2012). MeCP2 binds to 5hmC enriched within active genes and accessible chromatin in the nervous system. Cell 151, 1417–1430 [DOI] [PMC free article] [PubMed] [Google Scholar]
- Moore MJ, Zhang C, Gantman EC, Mele A, Darnell JC, and Darnell RB (2014). Mapping Argonaute and conventional RNA-binding protein interactions with RNA at single-nucleotide resolution using HITS-CLIP and CIMS analysis. Nat Protoc 9, 263–293 [DOI] [PMC free article] [PubMed] [Google Scholar]
- Pendleton KE, Chen B, Liu K, Hunter OV, Xie Y, Tu BP, and Conrad NK (2017). The U6 snRNA m(6)A Methyltransferase METTL16 Regulates SAM Synthetase Intron Retention. Cell 169, 824–835.e14 [DOI] [PMC free article] [PubMed] [Google Scholar]
- Polydorides AD, Okano HJ, Yang YY, Stefani G, and Darnell RB (2000). A brain-enriched polypyrimidine tract-binding protein antagonizes the ability of Nova to regulate neuron-specific alternative splicing. Proc. Natl. Acad. Sci. U.S.a 97, 6350–6355 [DOI] [PMC free article] [PubMed] [Google Scholar]
- Quesnel-Vallières M, Irimia M, Cordes SP, and Blencowe BJ (2015). Essential roles for the splicing regulator nSR100/SRRM4 during nervous system development. Genes Dev. 29, 746–759 [DOI] [PMC free article] [PubMed] [Google Scholar]
- Raj B, and Blencowe BJ (2015). Alternative Splicing in the Mammalian Nervous System: Recent Insights into Mechanisms and Functional Roles. Neuron 87, 14–27 [DOI] [PubMed] [Google Scholar]
- Regan MC, Grant T, McDaniel MJ, Karakas E, Zhang J, Traynelis SF, Grigorieff N, Furukawa H (2018). Structural mechanism of functional modulation by gene splicing in NMDA receptors. Neuron 98, 1–9 [DOI] [PMC free article] [PubMed] [Google Scholar]
- Ruggiu M, Herbst R, Kim N, Jevsek M, Fak JJ, Mann MA, Fischbach G, Burden SJ, and Darnell RB (2009). Rescuing Z+ agrin splicing in Nova null mice restores synapse formation and unmasks a physiologic defect in motor neuron firing. Proc Natl Acad Sci USA 106, 3513–3518 [DOI] [PMC free article] [PubMed] [Google Scholar]
- Saito Y, Miranda-Rottmann S, Ruggiu M, Park CY, Fak JJ, Zhong R, Duncan JS, Fabella BA, Junge HJ, Chen Z, et al. (2016). NOVA2-mediated RNA regulation is required for axonal pathfinding during development. eLife 5, e14371. [DOI] [PMC free article] [PubMed] [Google Scholar]
- Schmucker D, Clemens JC, Shu H, Worby CA, Xiao J, Muda M, Dixon JE, and Zipursky SL (2000). Drosophila Dscam is an axon guidance receptor exhibiting extraordinary molecular diversity. Cell 101, 671–684 [DOI] [PubMed] [Google Scholar]
- Shah A, Qian Y, Weyn-Vanhentenryck SM, and Zhang C (2017). CLIP Tool Kit (CTK): a flexible and robust pipeline to analyze CLIP sequencing data. Bioinformatics 33, 566–567 [DOI] [PMC free article] [PubMed] [Google Scholar]
- Solana J, Irimia M, Ayoub S, Orejuela MR, Zywitza V, Jens M, Tapial J, Ray D, Morris Q, Hughes TR, et al. (2016). Conserved functional antagonism of CELF and MBNL proteins controls stem cell-specific alternative splicing in planarians. eLife 5 [DOI] [PMC free article] [PubMed] [Google Scholar]
- Ule J, Jensen KB, Ruggiu M, Mele A, Ule A, and Darnell RB (2003). CLIP identifies Nova-regulated RNA networks in the brain. Science 302, 1212–1215 [DOI] [PubMed] [Google Scholar]
- Ule J, Jensen K, Mele A, and Darnell RB (2005a). CLIP: a method for identifying protein-RNA interaction sites in living cells. Methods 37, 376–386 [DOI] [PubMed] [Google Scholar]
- Ule J, Ule A, Spencer J, Williams A, Hu J-S, Cline M, Wang H, Clark T, Fraser C, Ruggiu M, et al. (2005b). Nova regulates brain-specific splicing to shape the synapse. Nat. Genet 37, 844–852 [DOI] [PubMed] [Google Scholar]
- Venables JP, Lapasset L, Gadea G, Fort P, Klinck R, Irimia M, Vignal E, Thibault P, Prinos P, Chabot B, et al. (2013). MBNL1 and RBFOX2 cooperate to establish a splicing programme involved in pluripotent stem cell differentiation. Nat Commun 4, 2480. [DOI] [PubMed] [Google Scholar]
- Wang ET, Cody NAL, Jog S, Biancolella M, Wang TT, Treacy DJ, Luo S, Schroth GP, Housman DE, Reddy S, et al. (2012). Transcriptome-wide regulation of pre-mRNA splicing and mRNA localization by muscleblind proteins. Cell 150, 710–724 [DOI] [PMC free article] [PubMed] [Google Scholar]
- Weyn-Vanhentenryck SM, Mele A, Yan Q, Sun S, Farny N, Zhang Z, Xue C, Herre M, Silver PA, Zhang MQ, et al. (2014). HITS-CLIP and integrative modeling define the Rbfox splicing-regulatory network linked to brain development and autism. Cell Rep 6, 1139–1152 [DOI] [PMC free article] [PubMed] [Google Scholar]
- Wu J, Anczuków O, Krainer AR, Zhang MQ, and Zhang C (2013). OLego: fast and sensitive mapping of spliced mRNA-Seq reads using small seeds. Nucleic Acids Res. 41, 5149–5163 [DOI] [PMC free article] [PubMed] [Google Scholar]
- Yan Q, Weyn-Vanhentenryck SM, Wu J, Sloan SA, Zhang Y, Chen K, Wu JQ, Barres BA, and Zhang C (2015). Systematic discovery of regulated and conserved alternative exons in the mammalian brain reveals NMD modulating chromatin regulators. Proc Natl Acad Sci USA 112, 3445–3450 [DOI] [PMC free article] [PubMed] [Google Scholar]
- Yang YY, Yin GL, and Darnell RB (1998). The neuronal RNA-binding protein Nova-2 is implicated as the autoantigen targeted in POMA patients with dementia. Proc. Natl. Acad. Sci. U.S.a 95, 13254–13259 [DOI] [PMC free article] [PubMed] [Google Scholar]
- Yano M, Hayakawa-Yano Y, Mele A, and Darnell RB (2010). Nova2 regulates neuronal migration through an RNA switch in disabled-1 signaling. Neuron 66, 848–858 [DOI] [PMC free article] [PubMed] [Google Scholar]
- Zhang C, Frias MA, Mele A, Ruggiu M, Eom T, Marney CB, Wang H, Licatalosi DD, Fak JJ, and Darnell RB (2010). Integrative modeling defines the Nova splicing-regulatory network and its combinatorial controls. Science 329, 439–443 [DOI] [PMC free article] [PubMed] [Google Scholar]
- Zhang C and Darnell BR (2011) Mapping in vivo protein-RNA interactions at single-nucleotide resolution from HITS-CLIP data. Nat. Biotechnol 29, 607–614 [DOI] [PMC free article] [PubMed] [Google Scholar]
- Zhang X, Chen MH, Wu X, Kodani A, Fan J, Doan R, Ozawa M, Ma J, Yoshida N, Reiter JF, et al. (2016). Cell-Type-Specific Alternative Splicing Governs Cell Fate in the Developing Cerebral Cortex. Cell 166, 1147–1162.e15 [DOI] [PMC free article] [PubMed] [Google Scholar]
- Zhang Y, Chen K, Sloan SA, Bennett ML, Scholze AR, O’Keeffe S, Phatnani HP, Guarnieri P, Caneda C, Ruderisch N, et al. (2014). An RNA-sequencing transcriptome and splicing database of glia, neurons, and vascular cells of the cerebral cortex. J. Neurosci 34, 11929–11947 [DOI] [PMC free article] [PubMed] [Google Scholar]
- Zheng S, and Black DL (2013). Alternative pre-mRNA splicing in neurons: growing up and extending its reach. Trends Genet. 29, 442–448 [DOI] [PMC free article] [PubMed] [Google Scholar]
- Zipursky SL, and Grueber WB (2013). The molecular basis of self-avoidance. Annu. Rev. Neurosci 36, 547–568 [DOI] [PubMed] [Google Scholar]
Associated Data
This section collects any data citations, data availability statements, or supplementary materials included in this article.
Supplementary Materials
Movie S1. Related to Figure 4. Motor coordination defect in Nova2-cKOPcp2-Cre mouse. Movie of motor coordination defect in 13 weeks old Nova2-cKO”Pcp2-Cre mouse.
Table S1. Related to Figure 1-3, and 5. RBPs target AS events and NOVA2 target AS events in selective neuronal cell-types. RBPs target AS events in each RBPs-KO were listed.
Data Availability Statement
The GEO accession number for NOVA2 cTag-CLIP and RNA-seq originated from this study is GSE103316.