Abstract
Background
Current clinical risk factors stratify patients with neuroblastoma (NB) for appropriate treatments, yet patients with similar clinical behaviors evoke variable responses. MYCN amplification is one of the established drivers of NB and, when combined with high-risk displays, worsens outcomes. Growing high-throughput transcriptomics studies suggest long noncoding RNA (lncRNA) dysregulation in cancers, including NB. However, expression-based lncRNA signatures are altered by MYCN amplification, which is associated with high-risk, and patient prognosis remains limited.
Methods
We investigated RNA-seq-based expression profiles of lncRNAs in MYCN status and risk status in a discovery cohort (n = 493) and validated them in three independent cohorts. In the discovery cohort, a prognostic association of lncRNAs was determined by univariate Cox regression and integrated into a signature using the risk score method. A novel risk score threshold selection criterion was developed to stratify patients into risk groups. Outcomes by risk group and clinical subgroup were assessed using Kaplan-Meier survival curves and multivariable Cox regression. The performance of lncRNA signatures was evaluated by receiver operating characteristic curve. All statistical tests were two-sided.
Results
In the discovery cohort, 16 lncRNAs that were differentially expressed (fold change ≥ 2 and adjusted P ≤ 0.01) integrated into a prognostic signature. A high risk score group of lncRNA signature had poor event-free survival (EFS; P < 1E-16). Notably, lncRNA signature was independent of other clinical risk factors when predicting EFS (hazard ratio = 3.21, P = 5.95E–07). The findings were confirmed in independent cohorts (P = 2.86E-02, P = 6.18E-03, P = 9.39E-03, respectively). Finally, the lncRNA signature had higher accuracy for EFS prediction (area under the curve = 0.788, 95% confidence interval = 0.746 to 0.831).
Conclusions
Here, we report the first (to our knowledge) RNA-seq 16-lncRNA prognostic signature for NB that may contribute to precise clinical stratification and EFS prediction.
Neuroblastoma (NB) is the most common childhood cancer of undifferentiated sympathetic neuroblasts, accounting for approximately 15% of deaths in children worldwide (1–3). According to the Surveillance, Epidemiology, and End Results (SEER) Cancer Statistics report, every year, more than 650 cases are diagnosed in North America (4,5), with an incidence rate of about 10.54 cases per million per year in children younger than 15 years (6,7). The clinical hallmark of NB is its tumor heterogeneity, represented by disparate clinical behaviors (1,2). MYCN oncogene amplification is one of the established drivers of NB, indicating worsened outcomes (8,9). It contributes to approximately 25% of NB cases and correlates with the high-risk tumor subtype (9,10).
Currently, the clinical risk factors of NB, including patient age at diagnosis, MYCN status, tumor stage, chromosomal aberrations, and tumor histology are still in use for risk assessment and determination of appropriate treatments (11–13). Nevertheless, risk assessments based on these risk factors have limited success, as patients with similar clinical behaviors evoke variable responses (14). Identifying tumor-specific molecular markers can provide better risk estimation and determination of effective protocols for treating patients at the time of diagnosis. Genomics and experimental studies conducted for protein-coding genes (PCGs) or microRNAs can discriminate between patients with an unfavorable or favorable outcome (14–24). However, the five-year survival rate of event-free survival (EFS) in the high-risk tumor subtype is still approximately 50% (25). With advancements in RNA-sequencing (RNA-seq) technology, there have been numerous efforts to correlate the expression of long noncoding RNA (lncRNA) with tumor prognosis (26–32).
LncRNAs (longer than 200 nucleotides) are major noncoding transcriptomes (33), transcribed by RNA polymerase II, and exhibit both low and tissue-specific expression (34–37). LncRNAs are highly stable and easily detected in various body fluids, including urine (38), plasma (39), and blood (40), urging noninvasive diagnosis. They exhibit significant interindividual expression variations in the same cell type compared with PCGs (41). LncRNAs have also been reported as a tumor suppressor or oncogene in several cancers, including NB (29,42–47). Our group identified that the lncRNA SNHG1 is regulated by N-MYC and independently predicts patient outcomes for EFS in NB (48). However, identifying an expression-based lncRNA signature that is altered by MYCN amplification is associated with high-risk, and patient prognosis for EFS is largely unknown. Here, we analyzed RNA-seq expression profiles of lncRNAs in MYCN status and risk status subtypes in NB. Using the risk score formula, we developed a 16-lncRNA signature that robustly discriminates patients at greater risk for relapse. Our results suggest that the lncRNA signature can serve as a potential prognostic biomarker for EFS in NB.
Methods
NB Patient Data Sets
NB expression data sets and corresponding clinical information were downloaded from the Gene Expression Omnibus (GEO), the Genomic Data Commons (GDC), and the Therapeutically Applicable Research to Generate Effective Treatments (TARGET) database. The following four cohorts were included in our study. For training, the RNA-seq cohort with GEO accession number GSE62564 (49) was used and termed as the discovery cohort. For validation, the RNA-seq cohort from GDC, microarray cohort from TARGET, and another with GEO accession number GSE16476 (50) were used and termed as independent cohorts 1–3, respectively.
lncRNA Profiling in the Discovery Cohort
The log2RPM normalized NB RNA-seq data set consisted of 498 patients, of which five with unknown MYCN status were removed. The clinical characteristics are shown (Supplementary Table 1, available online). To avoid negative log2 expression values, the intensities were converted back to their original raw expression, increased by 1, then log2 transformed. PCG and lncRNA expression was extracted based on their RefSeq ID annotation, which identified 34 255 and 6260 PCGs and lncRNAs transcripts, respectively. LncRNAs were differentially expressed (P ≤ .01 and a fold-change ≥ 2) in MYCN status (MYCN amplified vs MYCN nonamplified), and risk status (high-risk vs low-risk) was identified using the limma R package (51). In the case of multiple transcripts representing the same gene, high standard deviations were taken for further analyses.
Detection of Prognostic lncRNA Signature From the Discovery Cohort
Univariate Cox proportional hazard regression was applied to examine the association between 16 differentially expressed lncRNAs and patient EFS and overall survival (OS). LncRNAs statistically significantly associated (P < 0.001) with patient EFS were integrated into a signature using a risk score formula. The risk score for each patient was calculated by a linear combination of expression and univariate coefficient of lncRNAs as follows:
where Wj is the univariate coefficient for lncRNA j, Expij is the expression value of lncRNA j in patient i, and n is the number of testing lncRNAs. Herein, n is 16.
Stepwise Risk Score Threshold Selection
LncRNA risk scores were arranged in increasing order and divided into quartiles. Next, the patient was classified into a favorable or unfavorable risk score group using the first quartile, median, or third quartile risk score cutoff. We then built Kaplan-Meier plots for quartiles. To select the risk score threshold, we checked which quartile statistically significantly separated patients into two groups and had a survival probability of EFS of less than 50% in the unfavorable risk score group. The risk scores and the threshold for each cohort were calculated separately.
Statistical Analysis for the Discovery Cohort
Kaplan-Meier survival analysis (eg, favorable vs unfavorable risk score groups) with Mantel log-rank test was performed for the difference between survival curves. Multivariable Cox proportional hazard regression was performed to determine the prognostic independence of lncRNA risk scores and clinical risk factors. ROC curve and area under curve (AUC) analyses were used to evaluate the sensitivity and specificity of the lncRNA risk score for EFS prediction. All statistical tests were two-sided. Survival analysis was performed using the survival R package (52). The AUC and confidence interval for the AUC were calculated using the pROC R package (53). Details of data preprocessing and statistical analysis for independent cohorts are in the Supplementary Methods (available online).
Gene Set Enrichment Analysis
Spearman correlation coefficients (SCC) were calculated between the 16 lncRNAs and whole-genome PCGs (19 199 PCGs) from the discovery cohort. To assess the function of each lncRNA, gene set enrichment analysis (GSEA v2.2.3, Broad Institute) (54) was performed using MSigDB (C5.bp.v5.2.symbols.gmt gene set collection, 4653 gene sets available), with a ranked list as lncRNA-correlated PCGs and their corresponding SCCs, maximum gene set size of 5000, minimum gene set size of 15, 1000 permutations, and weighted enrichment statistics. Over-represented gene sets (false discovery rate [FDR] q value = 0.001, overlap coefficient value = 0.5) were filtered and visualized using the Enrichment map-Cytoscape plug-in (55).
Results
Identification of lncRNA Signature From the Discovery Cohort
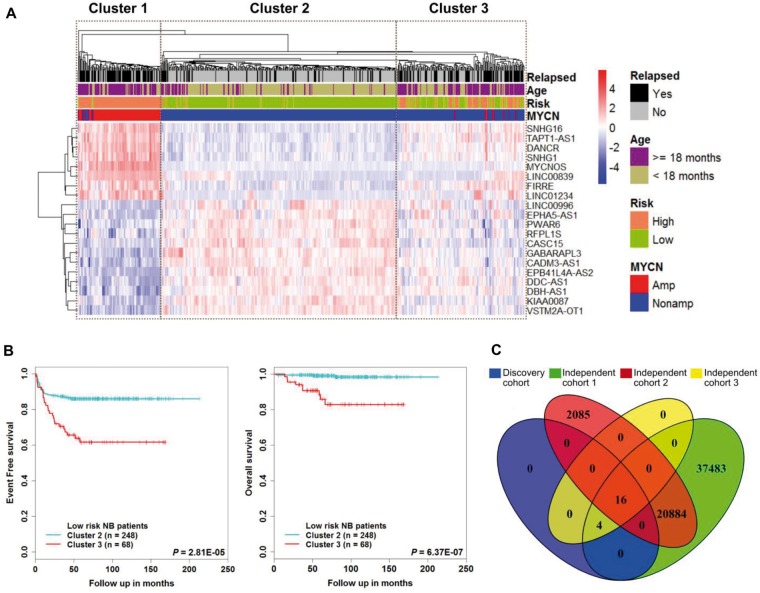
We first performed a differential expression analysis of the discovery cohort—a total of 493 patients—of which 92 were MYCN amplified and 401 were MYCN nonamplified NB tumor samples. We identified 90 lncRNAs to be differentially expressed (fold change ≥ 2 and adjusted P ≤ .01) in the MYCN status condition. We then performed a differential expression analysis of risk status, of which 175 were high-risk and 318 were low-risk tumor samples. With the same filter criteria as described above, we identified 35 lncRNAs that were differentially expressed. We retained only those lncRNAs that were also annotated in Gencode v.24 (35). The 20 lncRNAs were shared between MYCN status, risk status, and Gencode v.24 (Supplementary Figures 1 and 2 and Supplementary Table 2, available online). The unsupervised clustering analysis revealed that there were three clusters identified (Figure 1A). Patients in cluster 1 and cluster 2 belonged to high- and low-risk groups, respectively. However, cluster 3 contains a comparable number of high- and low-risk patients. Kaplan-Meier analysis showed that patients in cluster 1 and cluster 3 had poor EFS and OS (Supplementary Figure 3A, available online). Next, we extracted low-risk patients from cluster 2 and cluster 3 and found that patients in cluster 3 had poorer EFS (P = 2.81E-05) and OS (P = 6.37E-07) than patients in cluster 2 (Figure 1B). Moreover, we also checked the expression of lncRNAs: SNHG1 and CASC15 were reported to be highly expressed in high-risk and low-risk NB tumors, respectively (Supplementary Figure 3B, available online) (48,56). Furthermore, for our downstream analyses, we considered 16 of the 20 lncRNAs because four lncRNAs were not detected in the independent cohorts (Figure 1C).
Figure 1.
Identification of a subgroup in the MYCN nonamplified tumor samples. A) The heat map shows expression values of the long noncoding RNAs (lncRNAs) differentially expressed in MYCN status (MYCN amplified vs MYCN nonamplified) samples and risk status (high-risk vs low-risk) samples. Each column indicates a patient annotated according to their clinical information related to MYCN status, age, risk status, and event-free survival status. Each row represents lncRNAs ordered by average linkage hierarchical clustering. The expression value of each lncRNA was z-normalized and is shown with a gradient color scale. The unsupervised hierarchical clustering identified three clusters, as demonstrated by boxes. B) Kaplan-Meier plot of event-free survival and overall survival of cluster 2 and cluster 3 low-risk neuroblastoma patients. The P values were obtained using a Mantel log-rank test (two-sided). C) Venn diagram shows overlapping lncRNAs of the discovery cohort, independent cohort 1, independent cohort 2, and independent cohort 3. lncRNA = long noncoding RNA; NB = neuroblastoma.
Building the 16-lncRNA Signature Risk Score
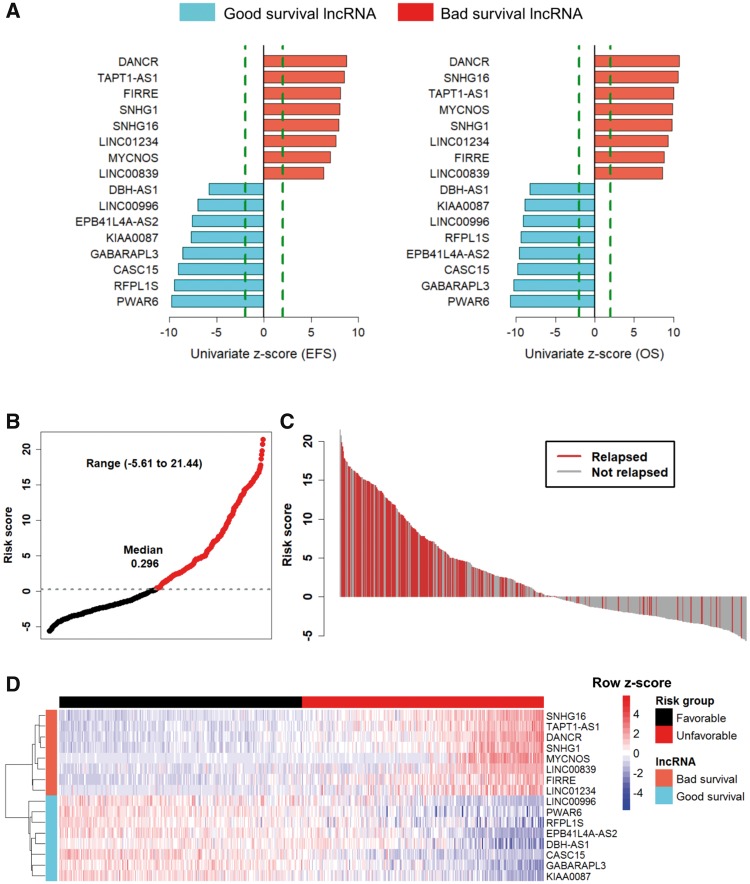
The 16 lncRNAs with univariate Cox analysis were statistically significantly (P < 0.001) associated with EFS and OS (Figure 2A). The eight lncRNAs with a negative coefficient were defined as “good survival lncRNAs,” whose high expression is associated with good survival. The remaining eight with a positive coefficient were defined as “bad survival lncRNAs,” whose high expression is associated with poor survival (Supplementary Table 3, available online). Permutation testing indicated that 16 lncRNAs had a more statistically significant association with EFS prediction than expected by chance (P < 1E-16) (Supplementary Methods and Supplementary Figure 4, available online). A risk score was constructed with the regression coefficient for EFS and was arranged in increasing order, and then divided into quartiles. After creating Kaplan-Meier plots for the quartiles, it was evident that the median risk score threshold statistically significantly separated the patients into two groups, with an EFS lower than 50% in the unfavorable risk score group (Supplementary Figure 5, available online). The 16-lncRNA signature risk scores range from –5.6 to 21.44 (median = 0.296) (Figure 2B). The clinical characteristics of patients based on risk groups from the discovery cohort are shown in Supplementary Table 4 (available online). The waterfall plot shows that most of the patients with a high risk score relapsed (Figure 2C). The heat map (Figure 2D) shows that patients in the unfavorable risk score group tend to express bad survival lncRNAs and patients in the favorable risk score group tend to express good survival lncRNAs.
Figure 2.
Univariate Cox regression and risk score analysis of prognostic long noncoding RNAs (lncRNAs) from the discovery cohort. A) Bar graph shows 16 prognostic lncRNAs ordered by their univariate z-score for event-free survival (EFS) and overall survival (OS). Positive scores are associated with shorter survival, and negative scores are associated with longer survival. Red and blue bars represent bad survival lncRNAs and good survival lncRNAs, respectively. The dashed line (colored in green) represents an absolute univariate z-score value of ±1.96. B) Point plot of risk scores show risk score groups represented by color. Black represents favorable risk score group of patient samples, and red represents unfavorable risk score group of patient samples classified on median risk score of the discovery cohort. C) Waterfall plot of ordered risk scores shows disease relapse status of the patient. Red and gray bars represent patients with disease relapse and those who have not relapsed, respectively. D) Heat map shows the expression profile of the lncRNA signature. Each column indicates a patient in the favorable risk score group (black) and unfavorable risk score group (red). Each row represents lncRNAs associated with shorter survival (red) and longer survival (blue). The lncRNAs were ordered by hierarchical clustering. The expression value of each lncRNA is scaled across rows and shown with a blue-red color scale. EFS = event-free survival; lncRNA = long noncoding RNA; OS = overall survival.
Prognostic Association of 16-lncRNA Signature Risk Score With Patient Survival
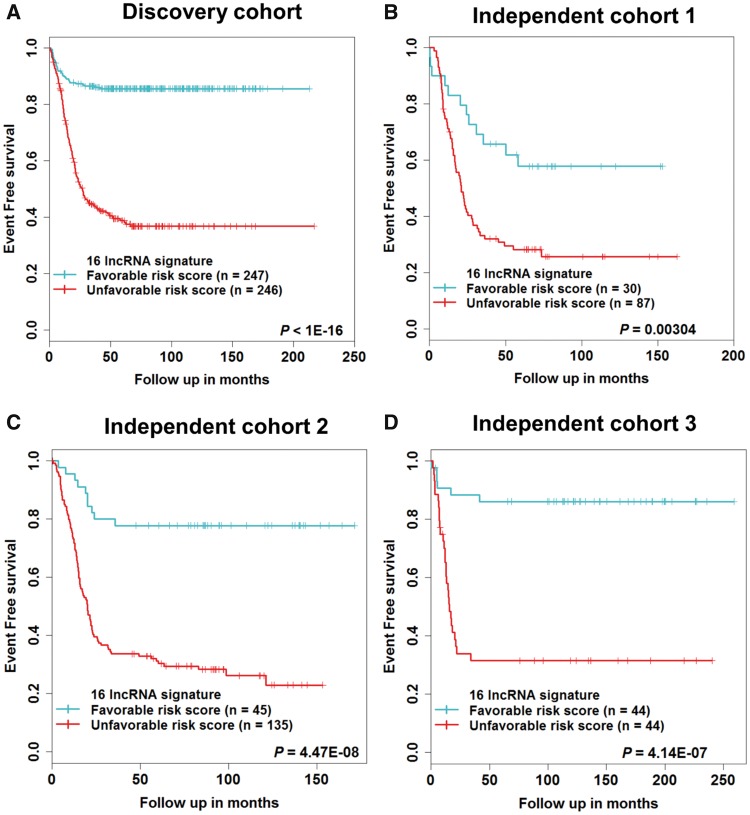
Compared with patients in the favorable risk score group, those with an unfavorable risk score had a poor EFS and OS (Figure 3A;Supplementary Figure 6A, available online). Only 39% of NB patients in the unfavorable risk score group were disease free at five years, compared with 86% of patients in the favorable risk score group. The OS probability at five years was 57% in the unfavorable risk score group, compared with 99% in the favorable risk score group (Supplementary Table 5, available online). The 16-lncRNA signature was tested in three independent cohorts for validation. Using the same risk score formula and stepwise risk score threshold selection criteria (Supplementary Figure 5, available online), the 16-lncRNA signature statistically significantly stratified patients into two risk score groups for EFS and OS (Figures 3, B–D; Supplementary Figure 6, B–D, available online), respectively. The clinical characteristics of patients based on risk groups from the independent cohorts are shown (Supplementary Table 4, available online).
Figure 3.
Survival estimates of event-free survival in neuroblastoma patients. Kaplan-Meier plots of favorable and unfavorable risk score groups based on the (A) median risk score of the discovery cohort, (B) first quartile risk score of the independent cohort 1, (C) first quartile risk score of the independent cohort 2, (D) median risk score of the independent cohort 3. The P values were obtained using a Mantel log-rank test (two-sided). lncRNA = long noncoding RNA.
Survival Prediction by the 16-lncRNA Signature Is Independent of Clinical Risk Factors
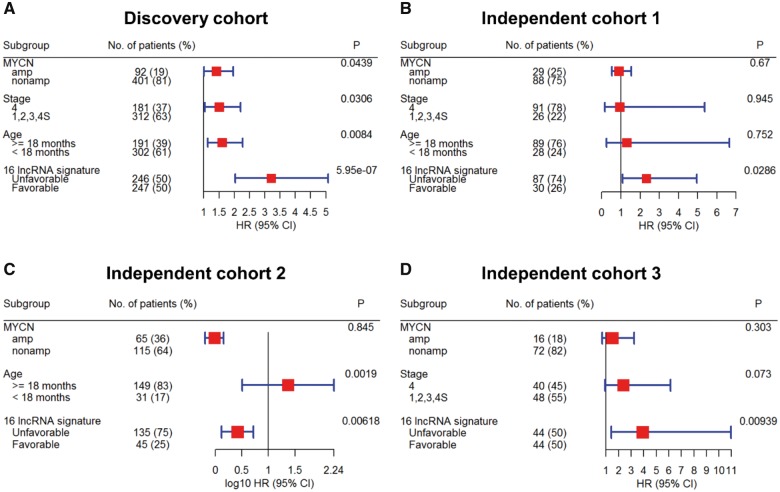
To evaluate the prognostic independence of the 16-lncRNA signature against known clinical risk factors, multivariable Cox analysis showed that in the discovery cohort, lncRNA signature (HR = 3.21, P = 5.95E-07), MYCN status (HR = 1.41, P = 4.39E-02), stage (HR = 1.51, P = 3.06E-02), and age (HR = 1.6, P = 8.4E-03) were predicted EFS independently (Figure 4A). In independent cohort 1, only lncRNA signature (HR = 2.32, P = 2.86E-02) was independently associated with EFS (Figure 4B). In independent cohort 2, lncRNA signature (HR = 2.61, P = 6.18E-03) and age (HR = 23.56, P = 1.9E-03) were independently associated with EFS (Figure 4C). In independent cohort 3, only lncRNA signature (HR = 3.91, P = 9.39E-03) was independently associated with EFS (Figure 4D). Similar results were also obtained for OS (Supplementary Figure 7, available online).
Figure 4.
Multivariable Cox analysis of the 16-long noncoding RNA (lncRNA) signature for event-free survival in neuroblastoma patients of (A) discovery cohort, (B) independent cohort 1, (C) independent cohort 2, and (D) independent cohort 3. Forest plot of the 16-lncRNA signature shows that patients in the unfavorable risk score groups had poor outcomes and an independent predictor of event-free survival after adjusting for the clinical risk factors. The hazard ratio and confidence interval for independent cohort 2 are represented on a log10 scale. All statistical tests were two-sided. CI = confidence interval, HR = hazard ratio; lncRNA = long noncoding RNA.
Survival Prediction by 16-lncRNA Signature Within Clinical Risk Factor Subgroups
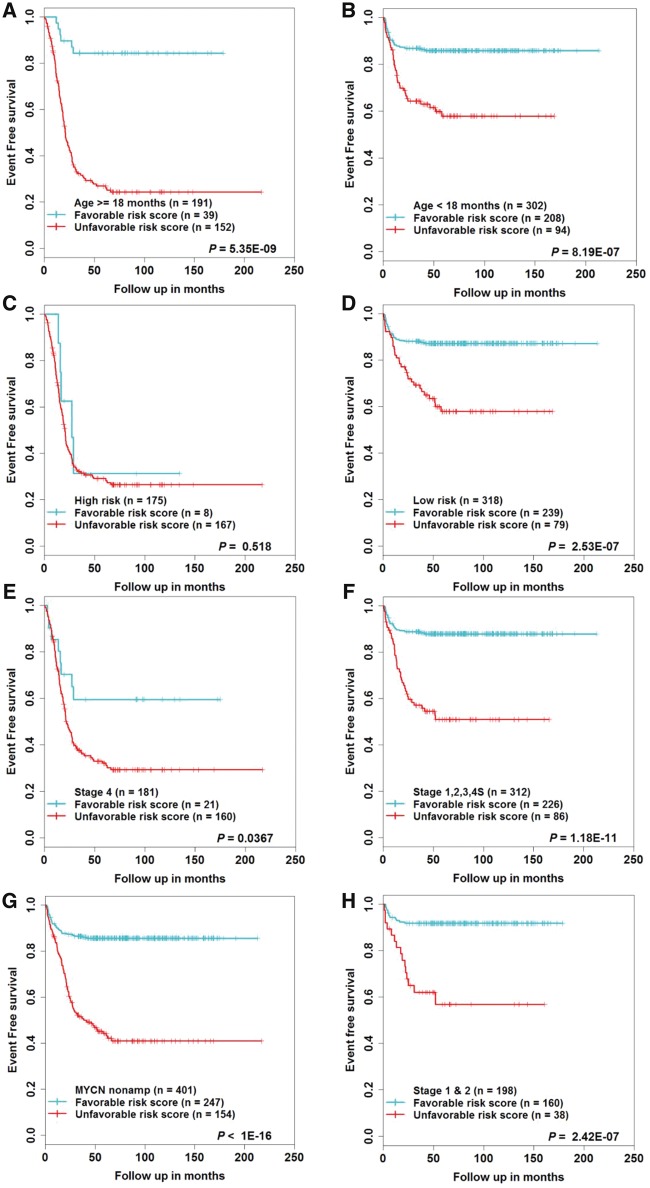
The above analysis revealed that MYCN status, age, and stage were also statistically significantly associated with EFS. Therefore, in order to corroborate whether lncRNA signature can stratify these risk factors into risk score groups, we first performed data stratification according to age, risk status, stage, and MYCN status. Within each subgroup of risk factors, patients were stratified into favorable and unfavorable risk score groups using the median risk score of the discovery cohort. In all subgroups except the high-risk subgroup (n = 175, P = 0.518), the 16-lncRNA signature statistically significantly stratified patients into two risk groups (Figure 5, A–G). The survival comparison for the MYCN amplified subgroup is not shown, as all the patients were stratified under the unfavorable risk score group. Similar results were also obtained for OS (Supplementary Figure 8, A–G, available online). In addition, the 16-lncRNA signature statistically significantly stratified low-stage (stage 1 or stage 2) tumor patients (Figure 5H;Supplementary Figure 8H, available online). The results for independent cohorts are shown (Supplementary Figures 9–11, available online).
Figure 5.
Survival estimates of event-free survival within the clinical risk factors subgroups from the discovery cohort. Kaplan-Meier plots of the favorable and unfavorable risk score groups based on the median risk score threshold value from the discovery cohort. The patients were stratified according to (A and B) age, (C and D) risk status, (E and F) stage, (G) MYCN nonamplified, (H) stage 1 and 2. P values were obtained using a Mantel log-rank test (two-sided). lncRNA = long noncoding RNA.
The 16-lncRNA Signature Predicts Patient Survival With High Sensitivity and Specificity
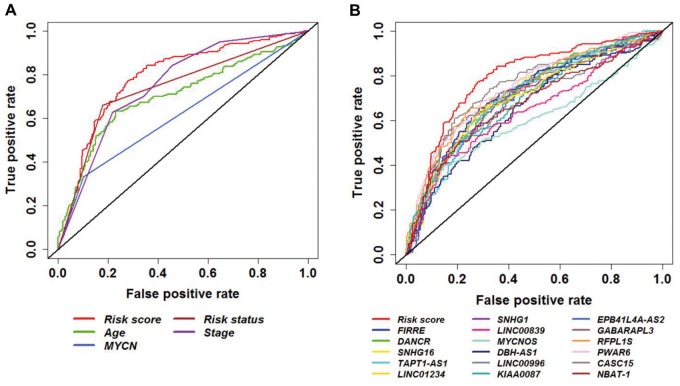
To confirm the prediction accuracy for EFS, we examined the ROC curve of lncRNA signature, age, MYCN status, risk status, and stage. For better performance, lncRNA signature and age were considered continuous variables, and MYCN status, risk status, and stage were considered categorical variables. The results of the discovery and independent cohorts are shown (Figure 6A;Supplementary Figure 12, available online). Moreover, studies have shown that several lncRNAs that were identified in our study are prognostic biomarkers for survival in NB (48,56,57). ROC analysis showed higher prediction accuracy of the 16-lncRNA signature against individual lncRNAs (Figure 6B). Furthermore, we compared the prediction accuracy of the 16-lncRNA signature with other published NB prognostic gene signatures (14,22–24). We extracted their gene list, built the risk score from the discovery cohort, and calculated the AUC of the ROC curve. As expected, the lncRNA signature showed similar performance for EFS compared with other prognostic gene signatures (Supplementary Figure 13, available online). The AUC and 95% confidence intervals of the AUC for the 16-lncRNA signature (AUC = 0.788, 95% CI = 0.746 to 0.831), individual lncRNAs, and clinical risk factors are shown (Supplementary Table 6, available online).
Figure 6.
Receiver operating characteristic (ROC) curve analysis of event-free survival prediction by the 16–long noncoding RNA (lncRNA) signature from the discovery cohort. ROC curve shows high sensitivity and specificity for predicting event-free survival. A) 16-lncRNA signature compared with all clinical risk factors. B) 16-lncRNA signature compared with individual lncRNAs. lncRNA = long noncoding RNA; ROC = receiver operating characteristic.
Pairwise Correlation of the 16-lncRNA Signature in the Discovery Cohort
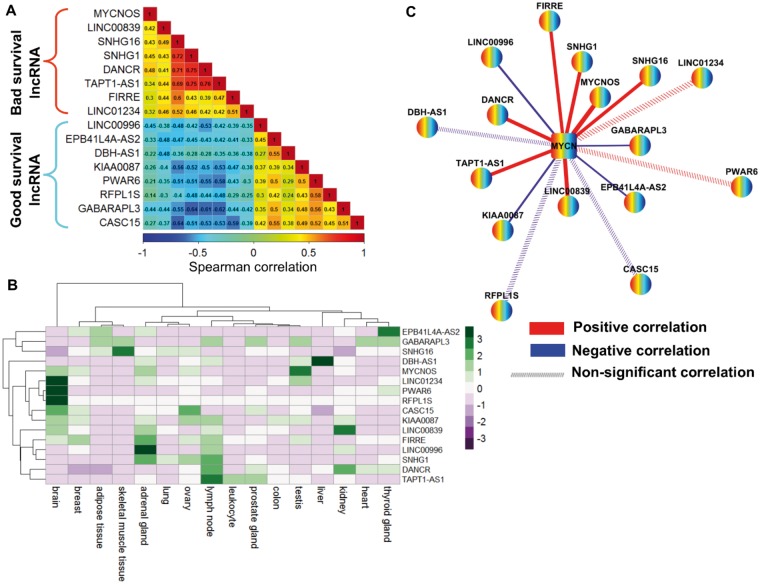
To understand the regulatory roles of the lncRNA signature, we calculated the SCC between the expression values of the 16 lncRNAs from the discovery cohort. We found that bad survival lncRNAs and good survival lncRNAs were highly correlated within their respective groups (Figure 7A). We next investigated the FPKM-normalized RNA-seq expression of the 16 lncRNAs across 16 normal human tissues obtained from the Illumina Human Body Map project and observed that most of the lncRNAs were expressed abundantly in the brain, adrenal glands, and lymph nodes (Figure 7B). Subsequently, to evaluate their relationship with the MYCN gene in the MYCN amplified and MYCN nonamplified conditions, we identified a positive correlation between bad survival lncRNAs and MYCN in both conditions (Figure 7C;Supplementary Figure 14, available online). Moreover, our ChIP-seq data analysis observed a MYCN binding site in the promoter of bad survival lncRNAs (SNHG1 and LINC00839) (58).
Figure 7.
Spearman correlation coefficient (SCC) analysis of the 16–long noncoding RNA (lncRNA) signature from the discovery cohort. A) SCC matrix shows correlations within bad survival lncRNAs and good survival lncRNAs. The color scale bar denotes correlation strength, with 1 indicating a positive correlation (red) and –1 indicating a negative correlation (blue). B) Heat map shows the fragments per kilobase of transcript per million mapped reads (FPKM) normalized expression value of 16 lncRNAs across 16 normal human tissues from the Illumina Body Map project. The expression value of each lncRNA was z-normalized and is shown with a green-purple color scale. C) The co-expression network of 16 lncRNAs and MYCN in MYCN-amplified neuroblastoma. Nodes represent lncRNA and MYCN coding gene, whereas edges represent the SCC of expression profiles between lncRNAs and the MYCN coding gene. Red edges represent positive correlations, and blue edges represent negative correlations. Edge width is proportional to the strength of the correlation. Dashed edges indicate that the correlation between lncRNA and the MYCN coding gene is nonsignificant. FPKM = fragments per kilobase of transcript per million mapped reads; lncRNA = long noncoding RNA; SCC = spearman correlation coefficient.
Biological Functions of the 16-lncRNA Signature in NB
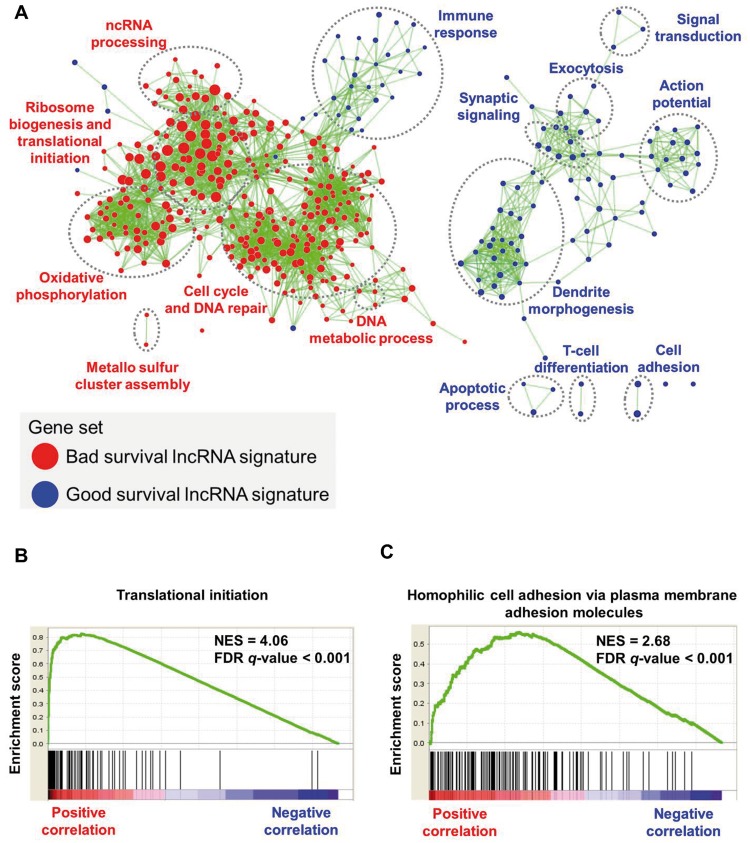
LncRNAs have little or no protein-coding capacity; thus we applied a guilt-by-association strategy to investigate the potential biological functions of the lncRNA signature (59). We found biological functions related to translational initiation, establishment of protein localization to the ER, and ribosome biogenesis enriched for bad survival lncRNAs. In contrast, biological functions related to homophilic cell adhesion via plasma membrane molecules, dendrite morphogenesis, and adaptive immune response were enriched for good survival lncRNAs (Figure 8A). The highest enriched biological function for the bad survival lncRNA, DANCR, and the good survival lncRNA, CASC15, are shown (Figure 8, B and C). The highest enriched biological functions for the rest of the lncRNAs are shown (Supplementary Figure 15, available online).
Figure 8.
Gene set enrichment analysis of the 16–long noncoding RNA (lncRNA) signature in neuroblastoma patients. A) Network shows overrepresented gene sets for the lncRNA signature. Red nodes represent bad survival lncRNA signature gene sets, and blue nodes represent good survival lncRNA signature gene sets. Node size is proportional to the normalized enrichment score. Biologically related gene sets tend to form clusters; these were manually identified and labeled with appropriate gene ontology terms. The network was generated using an enrichment map-cytoscape plug-in. B and C) Enrichment plot shows highest enriched function for the bad survival lncRNA (DANCR) and the good survival lncRNA (CASC15). FDR = false discovery rate; lncRNA = long noncoding RNA; NES = normalized enrichment score.
Discussion
Our study is the first to report (to our knowledge) the RNA-seq prognostic lncRNA signature in NB. Using the expression profiles of a large sample of 493 patients from an RNA-seq cohort, we identified 20 lncRNAs dysregulated in MYCN amplification and high-risk NB tumors. Identifying dysregulated lncRNAs from such a large high-throughput study increases the robustness and statistical power. However, only 16 lncRNAs were found to be in common with independent cohorts. Application of a univariate Cox model on this subset of lncRNAs identified their expression to have a statistically significant association with patient EFS and OS from the discovery cohort. These 16 lncRNAs were integrated into a signature through a risk score formula built from their expression and respective survival contributions. Patients were divided into favorable and unfavorable risk score groups using the median risk score as a threshold from the discovery cohort. Kaplan-Meier analysis with Mantel log-rank test (two-sided) estimated the 16-lncRNA signature prognostic association for EFS and OS. Multivariable Cox analysis determined the independence of the lncRNA signature against the established clinical risk factors.
There were platform and statistically significant clinical differences between the discovery and independent cohorts. Therefore, we calculated risk scores for each of the independent cohorts separately. To make the threshold selection independent of the cohort under investigation, we explored a novel stepwise risk score threshold selection approach for stratification of patients. The 16-lncRNA signature was validated as a statistically significant independent predictor for EFS in all the independent cohorts. Additionally, the 16-lncRNA signature has the ability to discriminate patients into two risk score groups within the clinical risk factors subgroups. The results were also reproduced in the independent cohorts. This important finding suggests the clinical applicability of the 16-lncRNA signature to identify patients who can benefit from appropriate treatments according to their risk of relapse. Data stratification for stage 1 and 2 tumors highlight the potential of the lncRNA signature to predict the risk of relapse for low-stage tumors. However, we were not able to validate this hypothesis in the independent cohorts. For independent cohort 1, only one patient was in stage 2b. This patient’s tumor relapsed, and they eventually died. For independent cohort 2, only 30 patients were in stage 1, and all were censored. Thus, using the first quartile risk score threshold for this cohort, no patients were stratified under the unfavorable risk score group. For independent cohort 3, we did not find a statistically significant difference in the two risk groups for stage 1 and 2 patients. The possible reasons for this were the limited sample size and the fact that most of the patients were censored.
Along with genomic amplification of the MYCN oncogene, genetic aberration, including chromosomal segmental aberration or tumor DNA ploidy status, also contributes to advanced disease stage and aggressive phenotype (1,2). We show that expression of several of the 16 lncRNAs is differentially expressed in chromosomal segmental aberration (Supplementary Figures 16–18, available online) and has a prognostic impact in predicting the outcome of patients in tumor DNA ploidy subgroups (Supplementary Figures 19 and 20 and Supplementary Tables 7–8, available online).
Studies reported that several of the 16 lncRNAs identified in our study were likely to have roles in NB, as well as in other cancers. The lncRNA MYCNOS interacts with CTCF at the promoter and enhances MYCN expression (60). The lncRNA DANCR is associated with tumorigenesis and prognosis in hepatocellular carcinoma (HCC) (61). The lncRNA SNHG16, mapped to chromosome 17q, is an independent predictor for patient survival in NB (57). The lncRNA FIRRE, mapped to chromosome X, is involved in the dosage compensation process (62). The lncRNA LINC01234 is associated with patient survival in breast cancer (63). The lncRNA DBH-AS1 is induced by hepatitis B virus x protein and is involved in hepatitis B virus–mediated HCC (64). The lncRNA EPB41L4A-AS2 is downregulated and associated with poor patient survival in breast cancer (65).
There are also limitations to our study. First, the NB cohorts included in our study were profiled from different platforms and have significant clinical differences. Therefore, the findings have to be validated separately. Second, independent cohort 1 and independent cohort 2 represent overly sensitive cohorts confounded by patient age and tumor stage. Third, in independent cohort 2, stage was not included as a covariate in multivariable analysis as no relapse was observed in patients in stage 1 or 3. In independent cohort 3, age was not included as a covariate in multivariable analysis because clinical information about patient age was not available for this cohort. Despite these drawbacks, independent confirmation and similarity between findings from the discovery and independent cohorts provide a high level of confidence in the overall analysis.
In conclusion, we developed a signature consisting of 16 lncRNAs whose expression is associated with high risk and is regulated by MYCN amplification in NB. In addition, the lncRNA signature can be incorporated into different clinical platforms, including RNA-seq and microarray. Our previous study also validated the expression of some of the identified lncRNAs using real-time quantitative polymerase chain reaction (48). The expressions of the lncRNA signature have better ability for prediction of clinical response compared with the risk, based on pathological and genetic markers. The lncRNA signature is independent in predicting NB patient disease relapse. Thus, our results suggest that the 16-lncRNA prognostic signature may have clinical application in NB.
Funding
This work was supported by the Ministry of Science and Technology (MOST 103-2320-B-010-031-MY3, MOST 104-2628-E-010-001-MY3, MOST 105-2320-B-002-057-MY3, and MOST 105-2634-E-002-002) and the National Health Research Institutes (NHRI-EX106-10530PI).
Notes
Affiliations of authors: Institute of Bioinformatics and Systems Biology (DS, SYH) and Department of Biological Science and Technology (SYH), National Chiao Tung University, Hsinchu, Taiwan; Bioinformatics Program, Taiwan International Graduate Program, Institute of Information Science, Academia Sinica, Taipei, Taiwan (DS, SYH, HCH); Institute of Biomedical Informatics, Center for Systems and Synthetic Biology, National Yang-Ming University, Taipei, Taiwan (DS, HCH); Department of Life Science, Institute of Molecular and Cellular Biology, Graduate Institute of Biomedical Electronics and Bioinformatics, National Taiwan University, Taipei, Taiwan (HFJ).
The study funders had no role in the design of the study; the collection, analysis, or interpretation of the data; the writing of the manuscript; or the decision to submit the manuscript for publication.
DS and HCH conceived and designed the study. DS performed bioinformatics analyses. SYH helped with data analysis. DS and HCH interpreted the results and wrote the manuscript. HFJ and HCH supervised the study. All authors read and approved the final manuscript.
The authors declare no competing financial interests.
The authors wish to thank Chen-Ching Lin and Chia-Lang Hsu for helpful discussions.
Supplementary Material
References
- 1. Brodeur GM. Neuroblastoma: Biological insights into a clinical enigma. Nat Rev Cancer. 2003;33:203–216. [DOI] [PubMed] [Google Scholar]
- 2. Maris JM, Hogarty MD, Bagatell R et al. , . Neuroblastoma. Lancet. 2007;3699579:2106–2120. [DOI] [PubMed] [Google Scholar]
- 3. Maris JM. Recent advances in neuroblastoma. N Engl J Med. 2010;36223:2202–2211. [DOI] [PMC free article] [PubMed] [Google Scholar]
- 4. Speleman F, Park JR, Henderson TO.. Neuroblastoma: A tough nut to crack. Am Soc Clin Oncol Educ Book. 2016;35:e548–e557. [DOI] [PubMed] [Google Scholar]
- 5. Howlader N, Noone AM, Krapcho M et al. , . SEER Cancer Statistics Review, 1975–2013. Bethesda, MD: National Cancer Institute; 2016. https://seer.cancer.gov/csr/1975_2013/. Accessed September 28, 2017. [Google Scholar]
- 6. London WB, Castleberry RP, Matthay KK et al. , . Evidence for an age cutoff greater than 365 days for neuroblastoma risk group stratification in the Children's Oncology Group. J Clin Oncol. 2005;2327:6459–6465. [DOI] [PubMed] [Google Scholar]
- 7. Gurney JG, Ross JA, Wall DA et al. , . Infant cancer in the U.S.: Histology-specific incidence and trends, 1973 to 1992. J Pediatr Hematol Oncol. 1997;195:428–432. [DOI] [PubMed] [Google Scholar]
- 8. Seeger RC, Brodeur GM, Sather H et al. , . Association of multiple copies of the N-myc oncogene with rapid progression of neuroblastomas. N Engl J Med. 1985;31318:1111–1116. [DOI] [PubMed] [Google Scholar]
- 9. Huang M, Weiss WA.. Neuroblastoma and MYCN. Cold Spring Harb Perspect Med. 2013;310:a014415. [DOI] [PMC free article] [PubMed] [Google Scholar]
- 10. Brodeur GM, Seeger RC, Schwab M et al. , . Amplification of N-myc in untreated human neuroblastomas correlates with advanced disease stage. Science. 1984;2244653:1121–1124. [DOI] [PubMed] [Google Scholar]
- 11. Brodeur GM, Pritchard J, Berthold F et al. , . Revisions of the international criteria for neuroblastoma diagnosis, staging, and response to treatment. J Clin Oncol. 1993;118:1466–1477. [DOI] [PubMed] [Google Scholar]
- 12. Maris JM, Matthay KK.. Molecular biology of neuroblastoma. J Clin Oncol. 1999;177:2264–2279. [DOI] [PubMed] [Google Scholar]
- 13. Brodeur GM, Maris JM.. Neuroblastoma In: Pizzo P, Poplack D, eds. Principles and Practice of Pediatric Oncology. Philadelphia: Lippincott Williams & Wilkins; 2002:895–937. [Google Scholar]
- 14. Vermeulen J, De Preter K, Naranjo A et al. , . Predicting outcomes for children with neuroblastoma using a multigene-expression signature: A retrospective SIOPEN/COG/GPOH study. Lancet Oncol. 2009;107:663–671. [DOI] [PMC free article] [PubMed] [Google Scholar]
- 15. Asgharzadeh S, Pique-Regi R, Sposto R et al. , . Prognostic significance of gene expression profiles of metastatic neuroblastomas lacking MYCN gene amplification. J Natl Cancer Inst. 2006;9817:1193–1203. [DOI] [PubMed] [Google Scholar]
- 16. Wei JS, Johansson P, Chen QR et al. , . microRNA profiling identifies cancer-specific and prognostic signatures in pediatric malignancies. Clin Cancer Res. 2009;1517:5560–5568. [DOI] [PMC free article] [PubMed] [Google Scholar]
- 17. De Preter K, Vermeulen J, Brors B et al. , . Accurate outcome prediction in neuroblastoma across independent data sets using a multigene signature. Clin Cancer Res. 2010;165:1532–1541. [DOI] [PubMed] [Google Scholar]
- 18. Schulte JH, Schowe B, Mestdagh P et al. , . Accurate prediction of neuroblastoma outcome based on miRNA expression profiles. Int J Cancer. 2010;12710:2374–2385. [DOI] [PubMed] [Google Scholar]
- 19. De Preter K, Mestdagh P, Vermeulen J et al. , . miRNA expression profiling enables risk stratification in archived and fresh neuroblastoma tumor samples. Clin Cancer Res. 2011;1724:7684–7692. [DOI] [PMC free article] [PubMed] [Google Scholar]
- 20. Abel F, Dalevi D, Nethander M et al. , . A 6-gene signature identifies four molecular subgroups of neuroblastoma. Cancer Cell Int. 2011;11:9. [DOI] [PMC free article] [PubMed] [Google Scholar]
- 21. Valentijn LJ, Koster J, Haneveld F et al. , . Functional MYCN signature predicts outcome of neuroblastoma irrespective of MYCN amplification. Proc Natl Acad Sci U S A. 2012;10947:19190–19195. [DOI] [PMC free article] [PubMed] [Google Scholar]
- 22. Formicola D, Petrosino G, Lasorsa VA et al. , . An 18 gene expression-based score classifier predicts the clinical outcome in stage 4 neuroblastoma. J Transl Med. 2016;14. [DOI] [PMC free article] [PubMed] [Google Scholar]
- 23. Asgharzadeh S, Salo JA, Ji L et al. , . Clinical significance of tumor-associated inflammatory cells in metastatic neuroblastoma. J Clin Oncol. 2012;3028:3525–3532. [DOI] [PMC free article] [PubMed] [Google Scholar]
- 24. Fardin P, Barla A, Mosci S et al. , . A biology-driven approach identifies the hypoxia gene signature as a predictor of the outcome of neuroblastoma patients. Mol Cancer. 2010;9:185. [DOI] [PMC free article] [PubMed] [Google Scholar]
- 25. Shao J, Lu Z, Huang W et al. , . A single center clinical analysis of children with neuroblastoma. Oncol Lett. 2015;104:2311–2318. [DOI] [PMC free article] [PubMed] [Google Scholar]
- 26. Svoboda M, Slyskova J, Schneiderova M et al. , . HOTAIR long non-coding RNA is a negative prognostic factor not only in primary tumors, but also in the blood of colorectal cancer patients. Carcinogenesis. 2014;357:1510–1515. [DOI] [PubMed] [Google Scholar]
- 27. Xu ZY, Yu QM, Du YA et al. , . Knockdown of long non-coding RNA HOTAIR suppresses tumor invasion and reverses epithelial-mesenchymal transition in gastric cancer. Int J Biol Sci. 2013; 96:587–597. [DOI] [PMC free article] [PubMed] [Google Scholar]
- 28. Li H, An J, Wu M et al. , . LncRNA HOTAIR promotes human liver cancer stem cell malignant growth through downregulation of SETD2. Oncotarget. 2015;629:27847–27864. [DOI] [PMC free article] [PubMed] [Google Scholar]
- 29. Gupta RA, Shah N, Wang KC et al. , . Long non-coding RNA HOTAIR reprograms chromatin state to promote cancer metastasis. Nature. 2010;4647291:1071–1076. [DOI] [PMC free article] [PubMed] [Google Scholar]
- 30. Kim K, Jutooru I, Chadalapaka G et al. , . HOTAIR is a negative prognostic factor and exhibits pro-oncogenic activity in pancreatic cancer. Oncogene. 2013;3213:1616–1625. [DOI] [PMC free article] [PubMed] [Google Scholar]
- 31. Kim HJ, Lee DW, Yim GW et al. , . Long non-coding RNA HOTAIR is associated with human cervical cancer progression. Int J Oncol. 2015;462:521–530. [DOI] [PMC free article] [PubMed] [Google Scholar]
- 32. Cai B, Wu Z, Liao K et al. , . Long noncoding RNA HOTAIR can serve as a common molecular marker for lymph node metastasis: A meta-analysis. Tumour Biol. 2014;359:8445–8450. [DOI] [PubMed] [Google Scholar]
- 33. Iyer MK, Niknafs YS, Malik R et al. , . The landscape of long noncoding RNAs in the human transcriptome. Nat Genet. 2015;473:199–208. [DOI] [PMC free article] [PubMed] [Google Scholar]
- 34. Cabili MN, Trapnell C, Goff L et al. , . Integrative annotation of human large intergenic noncoding RNAs reveals global properties and specific subclasses. Genes Dev. 2011;2518:1915–1927. [DOI] [PMC free article] [PubMed] [Google Scholar]
- 35. Derrien T, Johnson R, Bussotti G et al. , . The GENCODE v7 catalog of human long noncoding RNAs: Analysis of their gene structure, evolution, and expression. Genome Res. 2012;229:1775–1789. [DOI] [PMC free article] [PubMed] [Google Scholar]
- 36. Guttman M, Amit I, Garber M et al. , . Chromatin signature reveals over a thousand highly conserved large non-coding RNAs in mammals. Nature. 2009;4587235:223–227. [DOI] [PMC free article] [PubMed] [Google Scholar]
- 37. Bussemakers MJ, van Bokhoven A, Verhaegh GW et al. , . DD3: A new prostate-specific gene, highly overexpressed in prostate cancer. Cancer Res. 1999;5923:5975–5979. [PubMed] [Google Scholar]
- 38. Hessels D, Klein Gunnewiek JM, van Oort I et al. , . DD3(PCA3)-based molecular urine analysis for the diagnosis of prostate cancer. Eur Urol. 2003;441:8–15; discussion 15–16. [DOI] [PubMed] [Google Scholar]
- 39. Arita T, Ichikawa D, Konishi H et al. , . Circulating long non-coding RNAs in plasma of patients with gastric cancer. Anticancer Res. 2013;338:3185–3193. [PubMed] [Google Scholar]
- 40. Panzitt K, Tschernatsch MM, Guelly C et al. , . Characterization of HULC, a novel gene with striking up-regulation in hepatocellular carcinoma, as noncoding RNA. Gastroenterology. 2007;1321:330–342. [DOI] [PubMed] [Google Scholar]
- 41. Kornienko AE, Dotter CP, Guenzl PM et al. , . Long non-coding RNAs display higher natural expression variation than protein-coding genes in healthy humans. Genome Biol. 2016;17. [DOI] [PMC free article] [PubMed] [Google Scholar]
- 42. Kotake Y, Nakagawa T, Kitagawa K et al. , . Long non-coding RNA ANRIL is required for the PRC2 recruitment to and silencing of p15(INK4B) tumor suppressor gene. Oncogene. 2011;3016:1956–1962. [DOI] [PMC free article] [PubMed] [Google Scholar]
- 43. Gutschner T, Hammerle M, Eissmann M et al. , . The noncoding RNA MALAT1 is a critical regulator of the metastasis phenotype of lung cancer cells. Cancer Res. 2013;733:1180–1189. [DOI] [PMC free article] [PubMed] [Google Scholar]
- 44. Taniue K, Kurimoto A, Sugimasa H et al. , . Long noncoding RNA UPAT promotes colon tumorigenesis by inhibiting degradation of UHRF1. Proc Natl Acad Sci U S A. 2016;1135:1273–1278. [DOI] [PMC free article] [PubMed] [Google Scholar]
- 45. Pandey GK, Kanduri C.. Long noncoding RNAs and neuroblastoma. Oncotarget. 2015;621:18265–18275. [DOI] [PMC free article] [PubMed] [Google Scholar]
- 46. Pandey GK, Mitra S, Subhash S et al. , . The risk-associated long noncoding RNA NBAT-1 controls neuroblastoma progression by regulating cell proliferation and neuronal differentiation. Cancer Cell. 2014;265:722–737. [DOI] [PubMed] [Google Scholar]
- 47. Liu PY, Erriquez D, Marshall GM et al. , . Effects of a novel long noncoding RNA, lncUSMycN, on N-Myc expression and neuroblastoma progression. J Natl Cancer Inst. 2014;1067:dju113. [DOI] [PubMed] [Google Scholar]
- 48. Sahu D, Hsu CL, Lin CC et al. , . Co-expression analysis identifies long noncoding RNA SNHG1 as a novel predictor for event-free survival in neuroblastoma. Oncotarget. 2016;736:58022–58037. [DOI] [PMC free article] [PubMed] [Google Scholar]
- 49. Su Z, Fang H, Hong H et al. , . An investigation of biomarkers derived from legacy microarray data for their utility in the RNA-seq era. Genome Biol. 2014;1512:523. [DOI] [PMC free article] [PubMed] [Google Scholar]
- 50. Molenaar JJ, Domingo-Fernandez R, Ebus ME et al. , . LIN28B induces neuroblastoma and enhances MYCN levels via let-7 suppression. Nat Genet. 2012;4411:1199–1206. [DOI] [PubMed] [Google Scholar]
- 51. Ritchie ME, Phipson B, Wu D et al. , . limma powers differential expression analyses for RNA-sequencing and microarray studies. Nucleic Acids Res. 2015;437:e47. [DOI] [PMC free article] [PubMed] [Google Scholar]
- 52. Therneau T. A Package for Survival Analysis in S [computer program]. Version 2.38. 2015. https://CRAN.R-project.org/package=survival. Accessed June 16, 2015.
- 53. Robin X, Turck N, Hainard A et al. , . pROC: An open-source package for R and S+ to analyze and compare ROC curves. BMC Bioinformatics. 2011;12:77. [DOI] [PMC free article] [PubMed] [Google Scholar]
- 54. Subramanian A, Tamayo P, Mootha VK et al. , . Gene set enrichment analysis: A knowledge-based approach for interpreting genome-wide expression profiles. Proc Natl Acad Sci U S A. 2005;10243:15545–15550. [DOI] [PMC free article] [PubMed] [Google Scholar]
- 55. Isserlin R, Merico D, Voisin V, et al. . Enrichment Map – a Cytoscape app to visualize and explore OMICs pathway enrichment results. F1000Res. 2014;3. [DOI] [PMC free article] [PubMed] [Google Scholar]
- 56. Russell MR, Penikis A, Oldridge DA et al. , . CASC15-S is a tumor suppressor lncRNA at the 6p22 neuroblastoma susceptibility locus. Cancer Res. 2015;7515:3155–3166. [DOI] [PMC free article] [PubMed] [Google Scholar]
- 57. Yu M, Ohira M, Li Y et al. , . High expression of ncRAN, a novel non-coding RNA mapped to chromosome 17q25.1, is associated with poor prognosis in neuroblastoma. Int J Oncol. 2009;344:931–938. [DOI] [PubMed] [Google Scholar]
- 58. Hsu CL, Chang HY, Chang JY et al. , . Unveiling MYCN regulatory networks in neuroblastoma via integrative analysis of heterogeneous genomics data. Oncotarget. 2016;724:36293–36310. [DOI] [PMC free article] [PubMed] [Google Scholar]
- 59. Rinn JL, Chang HY.. Genome regulation by long noncoding RNAs. Annu Rev Biochem. 2012;81:145–166. [DOI] [PMC free article] [PubMed] [Google Scholar]
- 60. Zhao X, Li D, Pu J et al. , . CTCF cooperates with noncoding RNA MYCNOS to promote neuroblastoma progression through facilitating MYCN expression. Oncogene. 2016;3527:3565–3576. [DOI] [PubMed] [Google Scholar]
- 61. Yuan SX, Wang J, Yang F et al. , . Long noncoding RNA DANCR increases stemness features of hepatocellular carcinoma by derepression of CTNNB1. Hepatology. 2016;632:499–511. [DOI] [PubMed] [Google Scholar]
- 62. Yang F, Deng X, Ma W et al. , . The lncRNA Firre anchors the inactive X chromosome to the nucleolus by binding CTCF and maintains H3K27me3 methylation. Genome Biol. 2015;16:52. [DOI] [PMC free article] [PubMed] [Google Scholar]
- 63. Guo W, Wang Q, Zhan Y et al. , . Transcriptome sequencing uncovers a three-long noncoding RNA signature in predicting breast cancer survival. Sci Rep. 2016;6:27931. [DOI] [PMC free article] [PubMed] [Google Scholar]
- 64. Huang J, Ren T, Cao S et al. , . HBx-related long non-coding RNA DBH-AS1 promotes cell proliferation and survival by activating MAPK signaling in hepatocellular carcinoma. Oncotarget. 2015;632:33791–33804. [DOI] [PMC free article] [PubMed] [Google Scholar]
- 65. Xu S, Wang P, You Z et al. , . The long non-coding RNA EPB41L4A-AS2 inhibits tumor proliferation and is associated with favorable prognoses in breast cancer and other solid tumors. Oncotarget. 2016;715:20704–20717. [DOI] [PMC free article] [PubMed] [Google Scholar]
Associated Data
This section collects any data citations, data availability statements, or supplementary materials included in this article.


