. 2019 Jun 24;8:e46349. doi: 10.7554/eLife.46349

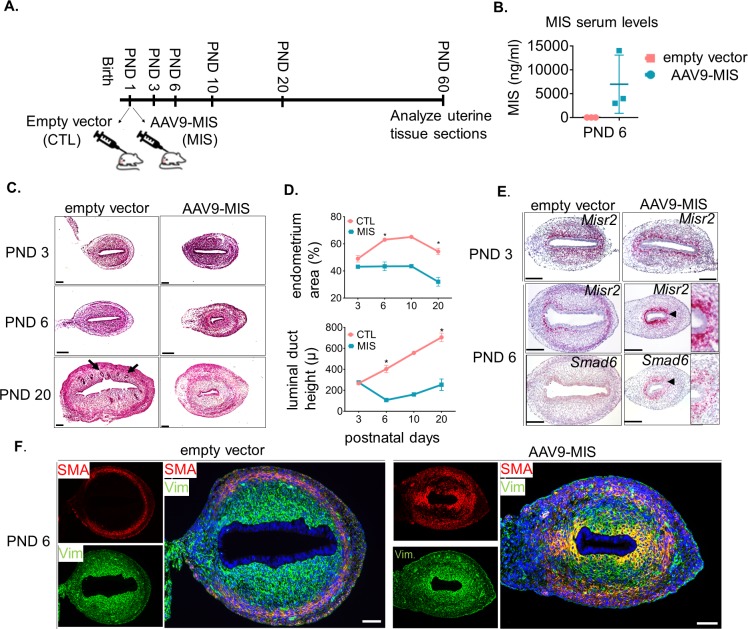
Figure 2. Misr2+ subluminal mesenchymal cells are susceptible to inhibition by MIS.

(A) Rat pups were treated with AAV9-MIS (MIS) or empty vector control (CTL) on postnatal day1 (PND 1) and euthanized at different developmental time points (B–F). Rats were used as the initial model organism since their litter sizes are bigger than mice. (B) MIS serum levels from control and AAV9-MIS treated rats on day 6 (n = 3 for both). (C) H& E sections from CTL and AAV9- MIS treated uteri on PND 3, 6, and 20. Endometrial glands are demarcated by black arrows on day 20. Scale bars = 100 µm. (D) Percentage of the endometrial stroma area (%), and luminal duct height of the CTL and MIS-treated uteri (Figure 2—source data 1). (E) Misr2 and Smad6 expression pattern by RNAish. Scale bars = 100 µm. (F) Smooth muscle α-actin (SMA) in red, and Vimentin (Vim) in green on CTL and AAV9-MIS treated uterine sections (PND 6, scale bars = 100 µm).

Figure 2—source data 1. Data, number of replicates and p values of significance between the control and AAV9-MIS treated uterine samples for histomorphological analysis.
Related to Figure 2B–E.
DOI: 10.7554/eLife.46349.008

Figure 2.

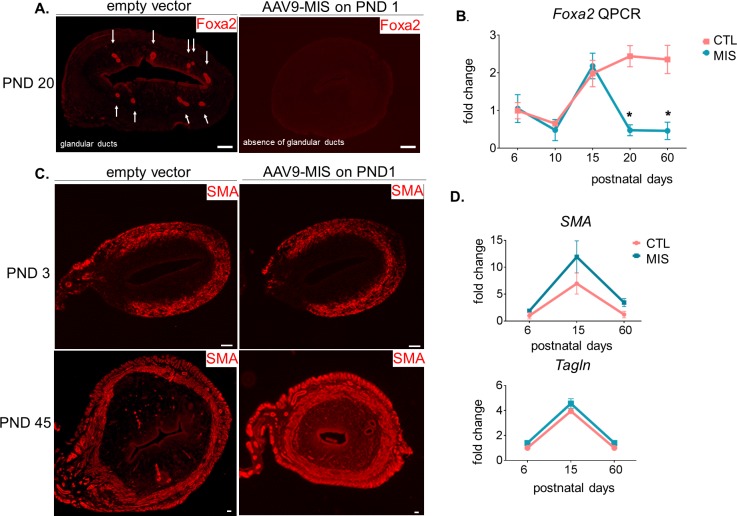
Figure 2—figure supplement 1. MIS treatment inhibits endometrial gland formation but not myometrial development.

Figure 2—figure supplement 1.

(A) Foxa2 immunofluorescence (red) in CTL and MIS-treated rat uteri sections at postnatal day 20. Note that the glandular ducts were missing in the treated uteri. Scale bars = 50 µm. (B) Foxa2 QPCR analysis of control and treated rats at various time points (n > 2, unpaired Student t-test, mean ± SEM, * (p<0.05)). (C) Smooth muscle α actin (SMA) immunofluorescence (red) on CTL and MIS-treated uteri at PND 3 and 45. Scale bars = 50 µm (D) SMA and Transgelin (Tagln) expression levels by qPCR on PND 6, 15, and 60.