Abstract
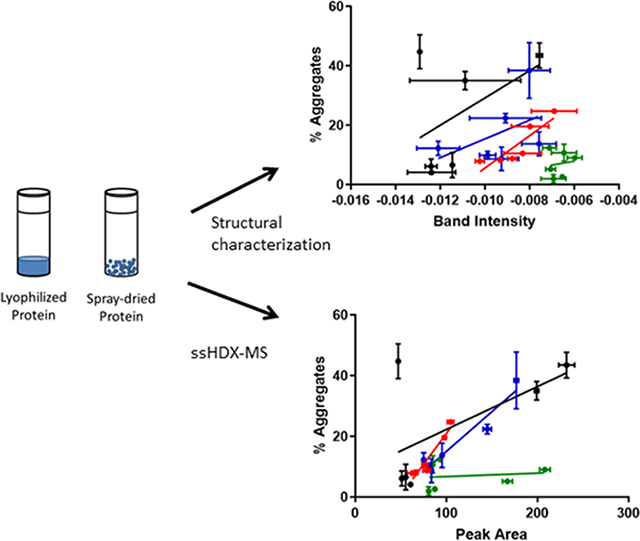
Powders containing one of four model proteins (myoglobin, bovine serum albumin, lysozyme, β-lactoglobulin) were formulated with either sucrose, trehalose, or mannitol and dried using lyophilization or spray-drying. The powders were characterized using solid-state Fourier transform infrared spectroscopy (ssFTIR), solid-state fluorescence spectroscopy, differential scanning calorimetry (DSC) and solid-state hydrogen/deuterium exchange mass spectrometry (ssHDX-MS). ssFTIR and fluorescence spectroscopy identified minor structural differences among powders with different excipients and drying methods for some proteins. Using ssHDX-MS, differences in protein structure were observed among protein formulations containing sucrose or trehalose and mannitol, and/or with varying processing conditions, including proteins like β-lactoglobulin, for which standard characterization techniques showed no differences. Proteins processed by spray-drying typically showed greater heterogeneity by ssHDX-MS than those lyophilized; these differences were not detected by ssFTIR or solid-state fluorescence spectroscopy. The ssHDX-MS metrics were better correlated with protein physical instability measured by size-exclusion chromatography in 90-day stability studies (40°C, 33% RH) than with the results of DSC, ssFTIR, or fluorescence spectroscopy. Thus, ssHDX-MS detected subtle changes in conformation and/or matrix interactions for these proteins that were correlated with storage stability, suggesting that the method can be used to design robust solid-state pharmaceutical protein products more rapidly.
Keywords: lyophilization, spray-drying, protein structure, biopharmaceutical processing, formulation, solid-state hydrogen/deuterium exchange with mass spectrometric analysis (ssHDX-MS)
Graphical Abstract
1. Introduction
The instability of a pharmaceutical protein in solution may necessitate the development of a product in the solid form, which often shows enhanced stability. Factors influencing the stability of solid protein formulations include excipient type and amount, protein concentration, protein:excipient ratio and drying method.(Cicerone et al., 2015) For pharmaceutical proteins, the mainstay drying technique is lyophilization. During lyophilization, a solution is frozen and water is removed under vacuum in various stages.(Carpenter et al., 2002) Following the freezing stage, frozen water is removed by sublimation during primary drying. Secondary drying follows, during which additional water bound to the protein is removed to produce the final product. Stresses encountered during lyophilization include cold denaturation, exposure to ice-water interfaces and freeze-concentration.(Chang et al., 2005) Traditionally, pharmaceutical lyophilization is a time-consuming batch process with low energy efficiency.(Langford et al., 2018)
Spray-drying has attracted increasing interests for manufacturing biopharmaceutical solids because it can be developed into a continuous process with high throughput, and has the capability to achieve satisfactory powder flowability by manipulating particle properties.(Maa and J Prestrelski, 2000) Examples of spray-dried biological products include Exubera, an inhalable insulin product, and Raplixa, a blend of thrombin and fibrinogen powders produced by aseptic spray-drying.(Lee, 2002; White et al., 2005) In spray-drying, a solution is atomized into small droplets which are briefly exposed to a drying gas to produce particles that are collected by a cyclone.(Ameri and Maa, 2006) Moisture is removed by evaporation, thus resulting in dried particles.(Lin et al., 2015) Stresses that may affect the structure and stability of the proteins during spray-drying are the relatively high temperature and exposure to the air-liquid interface, among others.(Abdul-Fattah et al., 2007a)
Through lyophilization and spray-drying, a solid powder containing a biologic product can be formed. Due to the processes and the properties of the proteins, the resulting powders are usually amorphous rather than crystalline.(Sinha et al., 2008) With either method, the removal of moisture can disrupt the higher-order structure of the proteins, leading to exposure of hydrophobic residues that may promote aggregation or increase the risk of chemical degradation.(Manning et al., 2010) Excipients that stabilize proteins against manufacturing stresses are critical in maintaining protein structural integrity and increasing shelf-life stability. While the effect of excipient has been studied extensively (Costantino et al., 1998; Koshari et al., 2017; Yoshioka et al., 1999), relatively little attention has been paid to the effect of processing conditions on protein structure and stability, or to the interactions of formulation and process variables (Abdul-Fattah et al., 2007b; Moussa et al., 2018).
Common methods for characterizing protein structure such as solid-state Fourier-transform infrared spectroscopy (ssFTIR), circular dichroism (CD) spectroscopy, and fluorescence spectroscopy are capable of identifying global changes in secondary and tertiary structures. (Koshari et al., 2017; Schüle et al., 2007; Souillac et al., 2002) These methods are often unable to detect subtle structural differences of some proteins, either secondary or tertiary, which may impact shelf stability in the long term. Determining protein structure and local environment with greater structural resolution could provide greater insight into the amorphous solid environment experienced by the protein, and guide the rational development of stable formulations. Solid-state hydrogen/deuterium exchange with mass spectrometry (ssHDX-MS) has been demonstrated to be such a method, showing good correlations between deuterium exchange and physical stability on storage.(Moorthy et al., 2014; Moorthy et al., 2018) In this technique, a sample is placed into a dessicator containing deuterium oxide (D2O) at a controlled humidity. In this chamber, exposed hydrogen atoms can be exchanged with deuterium, although due to back exchange only hydrogen atoms on the amide backbone can be monitored by mass spectrometric methods.(Majumdar et al., 2015) This provides information on the intra- and intermolecular hydrogen bonding interactions in the formulation matrix that can affect physical stability.
Previously, ssHDX-MS analysis of the effects of processing conditions on monoclonal antibody (mAb) formulations showed different sub-populations of the mAb in spray-dried samples with different deuterium incorporation, suggesting differing protein conformations and/or matrix interactions.(Moussa et al., 2018) However, only one type of protein (mAb) was examined in that work and the aggregation stability was not determined. In the work reported here, four model proteins of myoglobin (16.7 kDa), lysozyme (14.3 kDa), bovine serum albumin (BSA, 66.5 kDa), and β-lactoglobulin (18.4 kDa) were formulated with different excipients and processed by either lyophilization or spray-drying. These proteins were selected due to differences in structure and size to examine a broad range of protein characteristics.(Moriyama et al., 2008; Sinha et al., 2008) Excipients and formulation selections were based on previous studies with a mAb.(Moussa et al., 2018) The samples were characterized using conventional techniques of ssFTIR, fluorescence spectroscopy, X-ray powder diffraction, and differential scanning calorimetry (DSC), and ssHDX-MS. Stability studies (i.e. protein instability determined by loss of monomeric peak on size exclusion chromatography (SEC)) were performed to identify the effects of processing conditions. The results indicated that conventional techniques did not identify differences between processing methods. By using ssHDX-MS, however, differences in the population of protein species were measured in dried samples produced from different formulations and drying methods, which showed correlation with storage stability for some of the proteins studied.
2. Materials and Methods
2.1. Materials
Lysozyme from chicken egg white, bovine serum albumin, myoglobin from equine skeletal muscle, and β-lactoglobulin from bovine milk were purchased from Sigma Aldrich (St. Louis, MO). Protein solutions were dialyzed at 4°C in a 2.5 mM phosphate buffer solution using Slide-A-Lyzer™ dialysis cassettes (Thermo Scientific, Rockford, IL). Solution pH was adjusted to 6.8 using phosphoric acid where necessary. Dialyzed solutions were then diluted to final concentrations of protein and excipient, as indicated in Table S1, for a total solid content of 20 mg/mL. Solutions were then either spray-dried or filled into 2R borosilicate glass vials (0.2 mL per vial) for lyophilization.
2.2. Spray-drying
Formulations were spray-dried using a Mini Spray Dryer B-290 (Büchi, New Castle, DE). An inlet and outlet temperature of 100°C and 50–55°C, respectively, with a liquid feed rate of 2 mL/min and an air volumetric flow rate of 600 L/h were used. The collected powders were then distributed into 2R vials (~4mg per vial) and further dried in a lyophilizer for 24 h at 30°C and 100 mTorr to reduce moisture content to values similar to those of lyophilized samples (~2%). The purpose of this additional drying step was to ensure that any potential effects on protein structure and stability are not the consequence of moisture content differences in the dried powders.
2.3. Lyophilization
Lyophilization was performed with a Revo® laboratory-scale lyophilizer (MillRock Technology, Kingston, NY). Vials were loaded at a shelf temperature of 25°C, with placebo sucrose solutions (0.2 mL per vial at a concentration of 20 mg/mL) surrounding the samples. The solutions were equilibrated for 5 min, then ramped to 5°C and held isothermally for 15 min. The shelf temperature was then ramped to −5°C and held for 15 min. To induce freezing, the temperature was ramped to −40°C and held isothermally for 60 min. Primary drying was then initiated by ramping the temperature to −35°C and then holding isothermally for 24 h with a chamber pressure of 70 mTorr. For secondary drying, the chamber pressure was maintained, while the temperature was ramped to 25°C and held for 12 hr.
2.4. X-ray Powder Diffraction
The crystallinity of lyophilized and spray-dried powders was assessed using a Rigaku SmartLab X-ray diffractometer (Rigaku, The Woodlands, TX) equipped with a Cu Kα X-ray source and Bragg-Brentano geometry. Powders were removed from vials and pulverized onto a glass slide, then loaded onto the slide-holder. Diffraction intensity was measured as a function of 2θ between 5 and 40 degrees. A step size of 0.02° and a scan rate of 35°/min were used.
2.5. Solid-State Fourier Transform Infrared Spectroscopy
ssFTIR measurements were conducted in attenuated total reflectance mode using a Nicolet Nexus spectrometer (Thermo Scientific, Waltham, MA) equipped with a Smart iTR accessory. Powders were loaded and compressed against the diamond by a metal anvil. The spectra were collected in the absorbance mode in the range of 800 to 4000 cm−1, with 120 scans and 4 cm−1 resolution. Using OPUS 6.5 analysis software (Bruker, Billerica, MA), the results were processed using baseline correction, smoothing, normalization, and second derivatization.
2.6. Solid-State Fluorescence Spectroscopy
Intrinsic fluorescence of the solid samples was measured in front surface mode using a Cary-Eclipse spectrofluorometer (Agilent, Santa Clara, CA). The powders (20 mg each) were pulverized, loaded into a sample holder, and pressed against a fused silica plate so that the surface was fully covered with the powder. Spectra were collected with a photomultiplier tube of 600, with an incident angle of 25 degrees and a slit width of 5 nm. Excitation occurred at 280 nm, with emission spectra collected between 300–400 nm. The intensities of the spectra as collected were normalized using Prism Software (GraphPad, La Jolla, CA).
2.7. Differential Scanning Calorimetry (DSC)
Under nitrogen, 2–4 mg of powder were loaded into hermetic aluminum pans and sealed. Samples were loaded into a Discovery Series DSC 25 differential scanning calorimeter (TA Instruments, New Castle, DE). The sample was analyzed by heating it, starting at −5°C with a ramp rate of 1°C/min to an ending temperature of 180°C. Using the TRIOS software (v4.3.0, TA Instruments, New Castle, DE), the Tg or Tm was determined.
2.8. Stability Studies by Size Exclusion Chromatography (SEC)
The stability of the samples was determined by measuring the level of protein aggregates using SEC. Samples were sealed in a desiccator at 40°C over a saturated solution of magnesium chloride, which generated an environment of 33% relative humidity (RH). At each time point (15, 30, 60, and 90 days), three vials were removed and diluted to protein concentrations of 1 mg/mL. Solutions were centrifuged at 12,000 rpm and 4°C for 10 min to remove insoluble aggregates, and the supernatant was then removed and placed in HPLC vials for analysis. Samples were analyzed on a high performance liquid chromatography system (HPLC, 1200 series, Agilent Technologies, Santa Clara, CA) using isocratic flow of 50 mM sodium phosphate, 100 mM sodium chloride solution (pH 6.8) over 15 min at a flow rate of 1 mL/min. The column used was a TSKgel® G3000SWXL HPLC Column from Sigma Aldrich (St. Louis, MO). Instability was determined as a percentage of loss of the area under the curve for the monomeric peak of a sample before storage under accelerated conditions, with the exception of BSA, where initial aggregate peaks were also included in determining monomer content.
2.9. Solid-State Hydrogen Deuterium Exchange with Mass Spectrometric Analysis (ssHDX-MS)
Vials containing the powder samples were placed in a sealed desiccator at 25°C containing a D2O solution at 11% RH, which was maintained using a saturated solution of lithium chloride. For each formulation, three vials were removed at various time points (4, 12, 24, 48, and 120 h) following exposure to D2O vapor. Following removal of each sample, exchange was quenched by rapidly cooling the sample on dry ice. Samples were then stored in a −80°C freezer until analysis. Fully deuterated samples were prepared by dissolving the protein in a solution containing 3 M guanidine hydrochloride, and then placed into a vial containing a 9:1 dilution of D2O. This solution was then stored at 60°C for 24 hours before being quenched in a 4:1 solution of quench buffer and immediately analyzed.
To determine the extent of deuterium incorporation, samples were reconstituted in 2 mL of a chilled 0.1% formic acid solution (pH 2.5) and 10 μL were injected into a protein microtrap (Michrom Bioresources, Inc., Auburn, CA). Using a high performance liquid chromatography system (1200 series, Agilent Technologies, Santa Clara, CA), the samples were desalted for 1.7 min with 90% water, 10% acetonitrile with 0.1% formic acid, then eluted over 7 min with a gradient of 10% water, 90% acetonitrile with 0.1% formic acid. The columns were housed in a custom-built refrigeration unit (Keppel et al., 2011) and maintained at ~0°C to minimize back exchange. The mass spectra of the samples were determined using a 6520 qTOF mass spectrometer (Agilent Technologies, Santa Clara, CA) in the mass range 200–2000 m/z. Deconvolution of the undeuterated and deuterated samples was used to obtain the masses of the protein, using the MassHunter Workstation Software (version B.04, Agilent Technologies, Santa Clara, CA) to calculate the maximum entropy function. This algorithm converts the mass envelopes of the detected charge states into mass values which correspond to the different species present.
The kinetics of deuterium incorporation were fitted to the mono-exponential model:
| (1) |
where D(t) is the number of deuterons taken up at time t, Dmax is the maximum number of deuterons incorporated, and k is the observed rate constant of deuterium incorporation.
2.10. Statistical Analysis
The effects of process and excipient on exchange kinetics were compared statistically using the Prism software. For multiple comparisons, a one-way ANOVA followed by Tukey’s Test was used.
3. Results
3.1. Effect of Formulation and Drying Process on Moisture Content and Excipient Crystallinity
All formulations were dried to a moisture content ≤ 3% (Table S1). For most formulations, the moisture content of the spray-dried samples was slightly less than those that were lyophilized. This can be attributed to the additional drying step at 30°C for the spray-dried samples, which was used to make the moisture content comparable to their lyophilized counterparts.
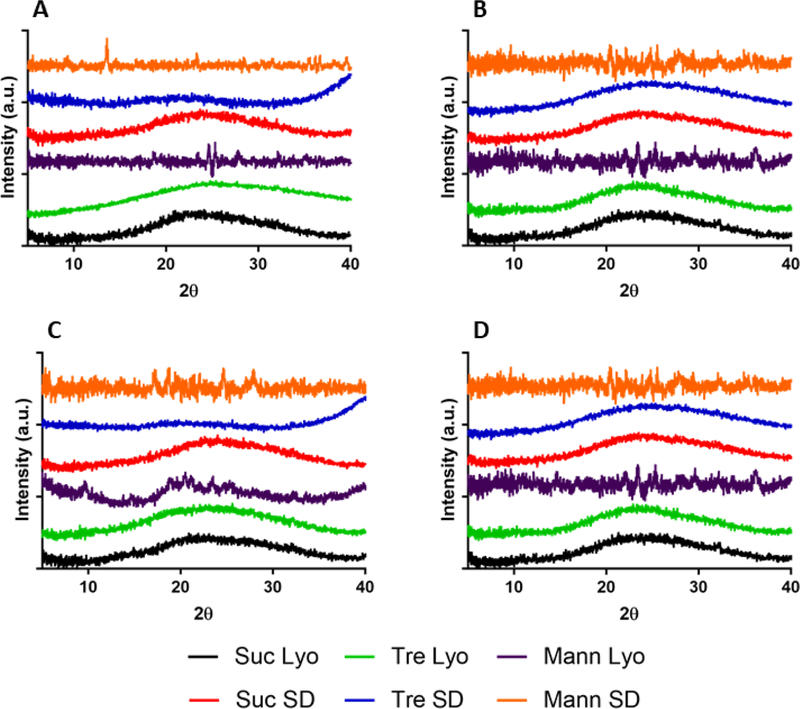
XRPD measurements for formulations containing sucrose or trehalose were consistent with completely amorphous solids for all processing conditions (Fig. S1). Samples containing mannitol showed minor peaks on XRPD, indicating the presence of crystalline mannitol. This crystallinity is probably related to the high mannitol content; mannitol greater than 30% (w/w) of the total solid content typically undergoes crystallization.(Maa et al., 1997)
3.2. DSC Analysis
Tg values were determined for sucrose- and trehalose-containing formulations, while Tm was determined for mannitol-containing formulations due to crystallinity. Samples containing sucrose had a lower Tg than other formulations (Table S2), consistent with previous reports.(Simperler et al., 2006) Samples containing trehalose showed process-dependent differences in Tg, with spray-dried samples having a higher Tg than those that were lyophilized. These results may be due to the additional drying step and the lower residual moisture content of the spray-dried samples (Table S1). For samples containing mannitol the Tm was found to be ~159–163°C, which is consistent with crystalline mannitol.(Burger et al., 2000)
3.3. Secondary Structural Analysis by ssFTIR
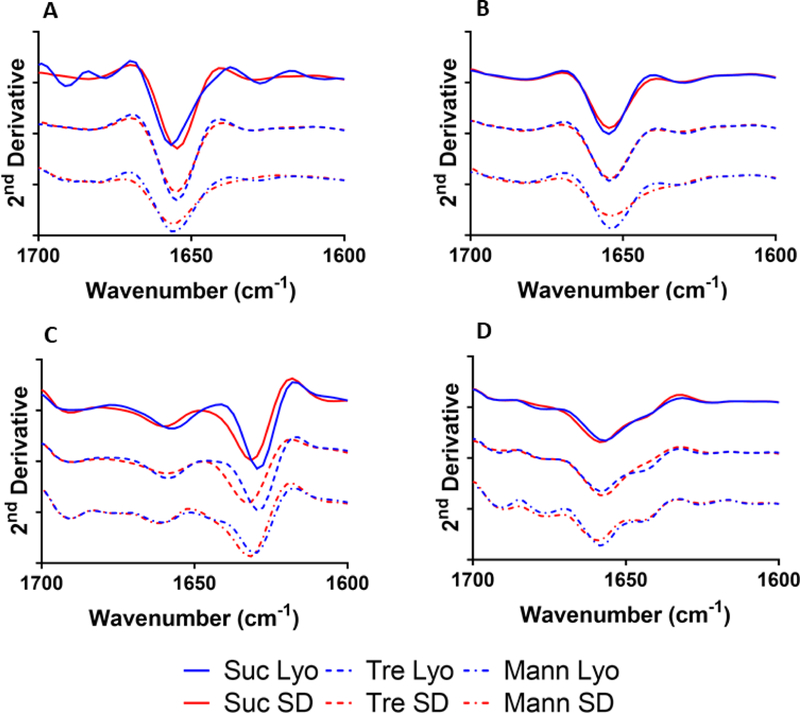
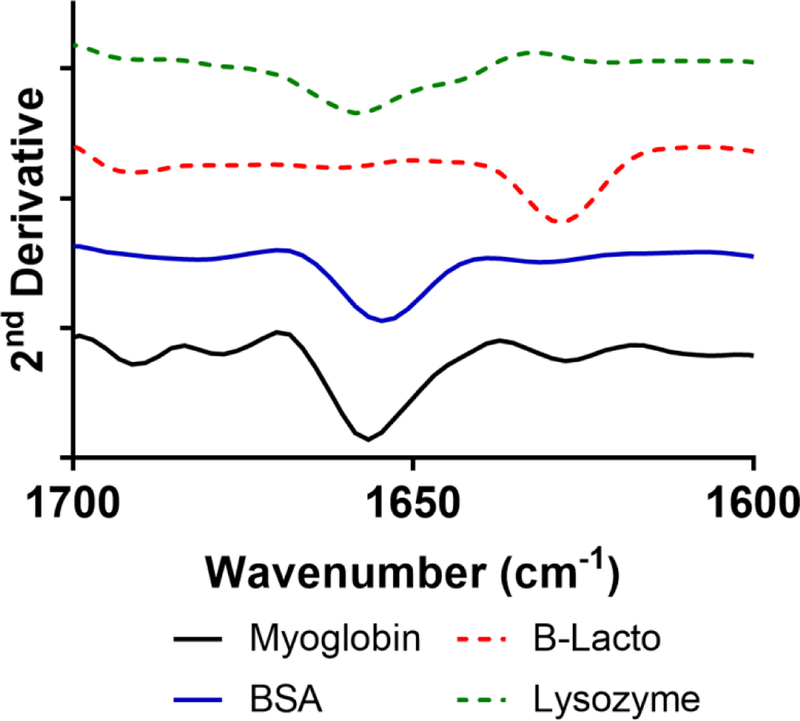
Amide I region of ssFTIR spectra was collected for each formulation and used to compare protein secondary structure (Figure 1). The FTIR bands for myoglobin were in general agreement with the spectra reported previously (Sinha et al., 2008) and similar to that prior to processing (Fig. S3), with a band at ~1656 cm−1 indicating α-helical structure (Fig. 1A). For myoglobin formulations containing trehalose, the bands were similar, with only a slight decrease in intensity for the spray-dried formulation (Fig. 1A). In myoglobin samples containing mannitol, a decrease in band intensity and increased broadening were observed relative to lyophilized samples. In sucrose-containing myoglobin formulations, lyophilization showed slight structural perturbation, with a band shift to 1658 cm−1, which still is consistent with α-helix structure.
Figure 1:
Solid-state FTIR spectra of formulated myoglobin (A), BSA (B), β-lactoglobulin (C), or lysozyme (D).
For the spray-dried formulations of BSA (Fig. 1B), FTIR bands were observed at ~1656 cm−1, which corresponds to α-helix structure, as reported previously for BSA (Fu et al., 1999). A decrease in band intensity was observed for spray-dried vs. lyophilized formulations, with the exception of the trehalose formulation, for which band intensities were similar. BSA spray-dried with mannitol showed a slight increase in the breadth of the band (Fig. 1B), which suggests perturbation of the α-helix.
For β-lactoglobulin (Fig. 1C), FTIR bands were observed at ~ 1638 cm−1 (β-sheet content), ~1660 cm−1 (turns), and ~1690 cm−1 (β-sheet content). In all spray-dried formulations of β-lactoglobulin, a band shift to ~1640 cm−1 was observed, along with significant broadening, suggesting an increase in structural heterogeneity of the β-sheet. Band intensity at ~1640 cm−1 was less in the trehalose- and mannitol-containing formulations for both processing conditions.
For lysozyme (Fig. 1D), FTIR bands were observed at ~1625 cm−1 (β-sheet), 1646 cm−1 (random coil), ~1658 cm−1 (α-helix), 1675 cm−1(turns/loops), and 1690 cm−1(turns). No significant differences in peak pattern or intensity were observed among the different formulations and processing conditions.
3.4. Tertiary Structural Analysis by Intrinsic Fluorescence
Intrinsic fluorescence has been used previously to measure the exposure of tryptophan to its environment(Sharma and Kalonia), which corresponds to changes in tertiary structure. A fully exposed tryptophan residue in the solid state has a fluorescence maximum at ~334 nm. Changes in folding correspond to shifts in the peak. Peak intensity is not considered significant in the solid state because concentration dependence is unlikely to occur.(Sharma and Kalonia)
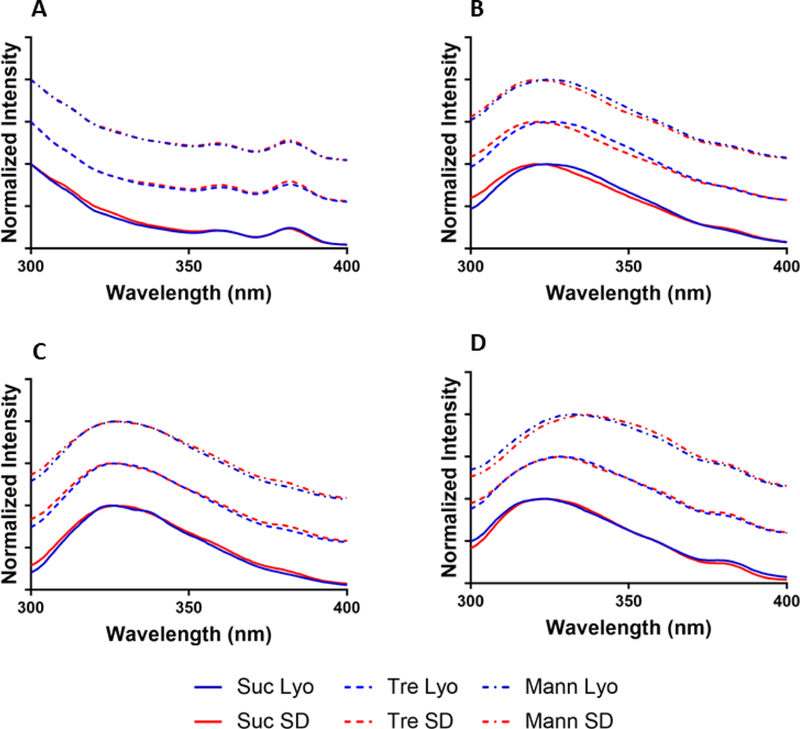
For all myoglobin formulations, the protein concentration was too low for accurate measurements by the instrument (Fig. 2A). For BSA (Fig. 2B), the fluorescence peak of all lyophilized samples occurred at 324 nm, while for spray-dried samples there was a blue shift to 320 nm. As the moisture content of the spray-dried samples is slightly less than the lyophilized samples, this may be attributable to hydration differences rather than differences in folding. For β-lactoglobulin (Fig. 2C), no significant peak shifts were observed due to formulation or processing conditions.
Figure 2:
Solid-state fluorescence spectroscopy of myoglobin (A), BSA (B), β-lactoglobulin (C), or lysozyme (D).
Lysozyme formulations (Fig. 2D) all showed significant differences in peak position that depended on formulation and processing conditions. Both mannitol-containing formulations displayed red shifts (332 nm for lyophilized, 336 nm for spray-dried) relative to other excipients. Sucrose-containing formulations had a peak at 324 nm for lyophilized samples, and at 327 nm for spray-dried. No difference in processing conditions was observed for any protein formulated with trehalose (Fig. 2).
3.5. Protein Conformation and Matrix Interactions Using ssHDX-MS
Protein conformation and matrix interactions between protein and excipients in the solid state were monitored by deuterium incorporation as a function of time. Several factors can affect the rate of exchange, including inter- and intramolecular interactions in the dried matrix, relative humidity, temperature, and the mass transport of D2O vapor into the sample.(Iyer et al.; Sophocleous et al., 2012) In this study, the temperature and relative humidity were kept constant.
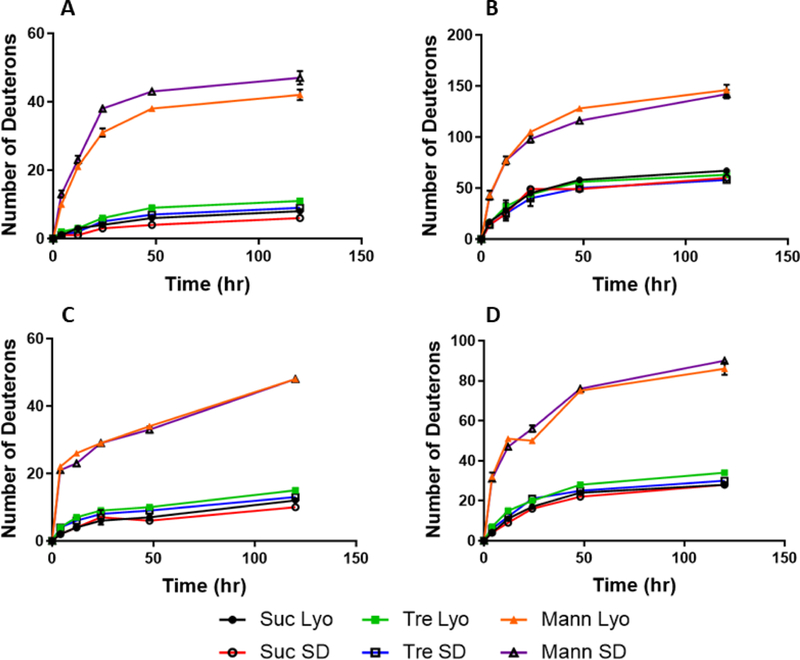
In a previous study, we showed for a monoclonal antibody that mass transport was complete within 48 h, and that the density of the powder did not affect mass transport.(Moussa et al., 2018) Similarly, as shown for each protein in Figure 3, mass transport does not affect the extent of deuterium incorporation, although for the smaller proteins mass transport is completed before the first time point (4 h). This further confirms that density does not significantly affect the rate of deuterium exchange.
Figure 3:
Kinetics of hydrogen/deuterium exchange in the solid state for myoglobin (A), BSA (B), β-lactoglobulin (C), and lysozyme (D).
The extent of deuteration was used to compare the differences among formulations and drying processes for each protein. In the myoglobin formulations (Fig. 3A), 5 days of deuterium exchange showed no significant differences between spray-drying and lyophilization for the sucrose and trehalose-containing formulations. Spray-dried myoglobin samples containing mannitol showed slightly greater deuterium uptake than the lyophilized samples. For all other proteins studied, no differences in deuterium uptake as a function of time were observed for formulations produced by different methods. Mannitol-containing formulations had higher deuterium incorporation than those containing sucrose or trehalose, which were comparable. This suggests the differences in deuterium incorporation are primarily dependent on intermolecular interactions between the protein and mannitol or trehalose within the solid, as found in previous studies.(Moorthy et al., 2014)
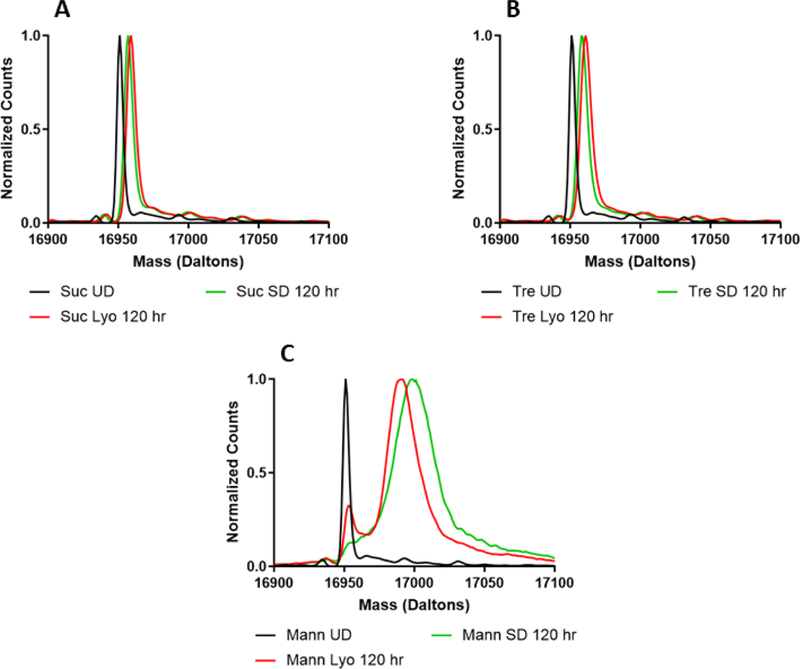
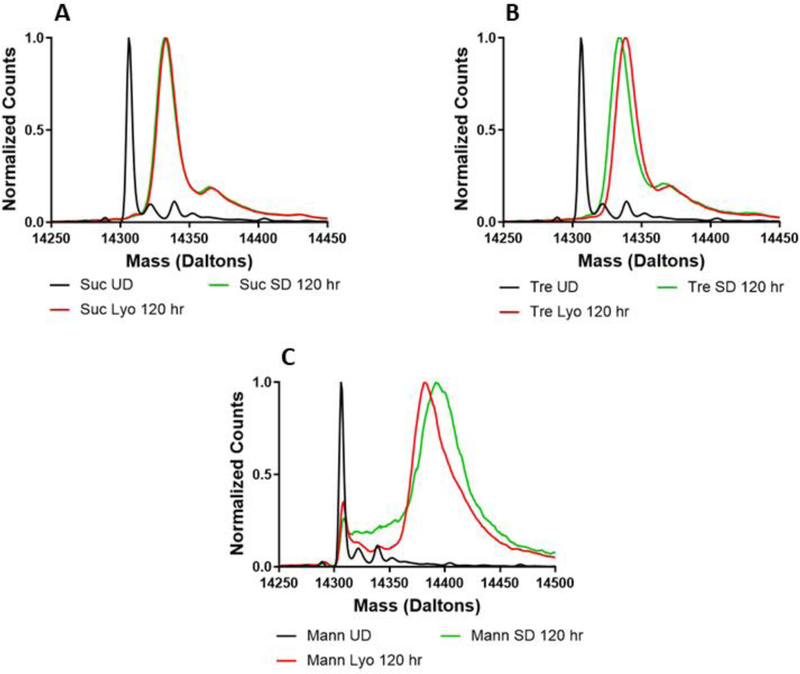
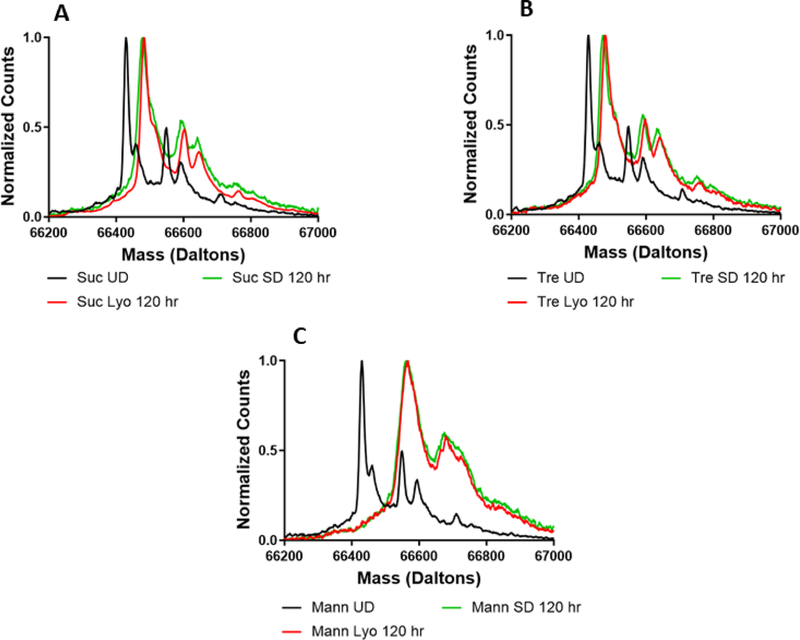
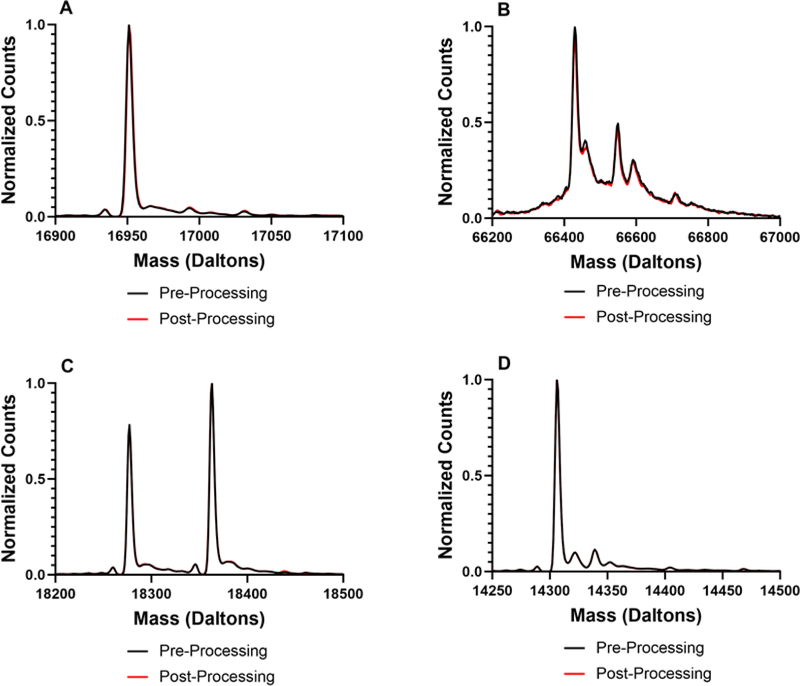
In addition to determining total deuterium incorporation by ssHDX-MS, the deuterated mass spectra were also examined to identify any differences in the shape and width of the mass envelopes. Differences were observed based on both formulation and processing conditions. For all proteins studied, no differences were observed pre-processing and prior to deuterium exchange (Fig. S4). For myoglobin, sucrose and trehalose (Fig. 4A and B), formulations showed no differences in their spectra after 5 days of deuteration, and the spectra were slightly broadened relative to that of the undeuterated protein, as expected.(Moussa et al., 2018) In contrast, substantial peak broadening was observed in the spectra of mannitol-containing lyophilized and spray-dried formulations, as compared to the undeuterated protein (Fig. 4C). This peak broadening may be attributed to greater heterogeneity of protein conformations and/or matrix interactions in the solid formulation, which results in a broader range of deuteration states. As mass spectrometry cannot distinguish between intermolecular and intramolecular interactions, population heterogeneity is used to refer all possible differences in inter- and intramolecular hydrogen bonding as identified by ssHDX-MS. The presence of two peaks in the lyophilized mannitol powder is consistent with two distinct populations, one of which is more protected from deuterium exchange (Fig. 4C). In contrast, the spray-dried formulation has a broad shoulder on the left side of its peak, suggesting a distribution of protein populations that are not well-resolved. Similar observations were made for all formulations containing lysozyme (Fig. 5). The deconvoluted mass envelope for undeuterated BSA indicates the presence of isoforms (Fig. 6). During deuterium exchange, peak broadening results in some degree of merging of these species, making it difficult to distinguish the effects of excipients and processing conditions. In sucrose- and trehalose-containing formulations (Fig. 6A and B), similar peak broadening was observed for both lyophilized and spray-dried samples. Mannitol-containing (Fig. 6C) samples showed greater peak broadening than the sucrose and trehalose formulations.
Figure 4:
Deconvoluted mass spectra of formulations prepared by lyophilization or spray-drying with myoglobin and sucrose (A), trehalose (B), or mannitol (C).
Figure 5:
Deconvoluted mass spectra of formulations prepared by lyophilization or spray-drying with lysozyme and sucrose (A), trehalose (B), or mannitol (C).
Figure 6:
Deconvoluted mass spectra of formulations prepared by lyophilization or spray-drying with BSA and sucrose (A), trehalose (B), or mannitol (C).
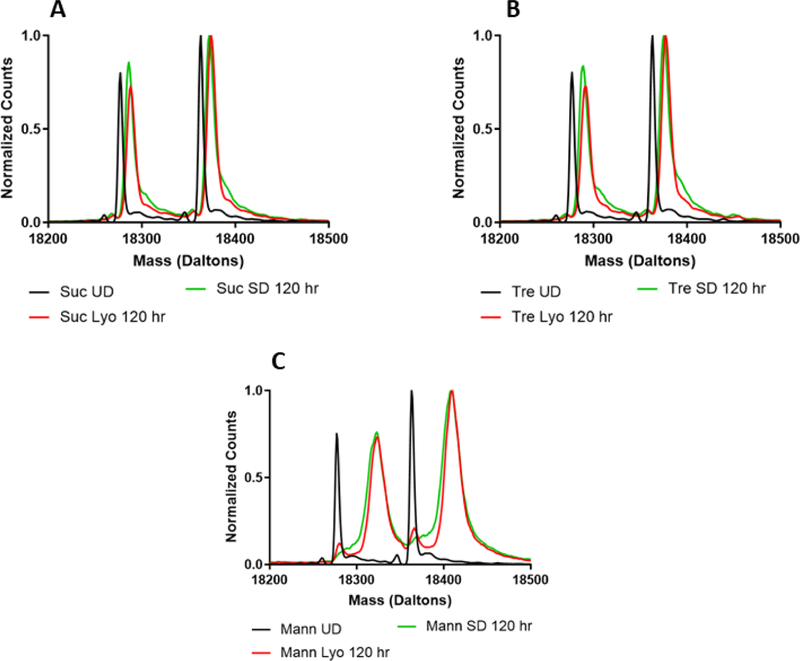
In β-lactoglobulin, the deconvoluted mass envelopes were consistent with two predominant species and some additional isoforms (Fig. 7). An average of the deuterium uptake for each of each of the dominant species was used to calculate deuterium uptake (Fig. 3C). Upon deuteration, solid samples containing either sucrose or trehalose (Fig. 7A and B) produced similar mass envelopes, with the exception of a shoulder to the right of each main peak for samples produced by spray-drying. This suggests the presence of a second population that differs from the main peak in protein conformation and/or matrix interactions for the spray-dried samples. For β-lactoglobulin samples containing mannitol (Fig. 7C), two distinct peaks were observed in lyophilized formulations, again consistent with different populations, although part of this peak splitting may be due to deuteration of the lower molecular weight isoforms. In contrast, the spray-dried formulation has a broad shoulder on the left, suggesting a higher concentration of less deuterated protein in the spray-dried formulation than in the lyophilized formulation.
Figure 7:
Deconvoluted mass spectra of formulations prepared by lyophilization or spray-drying with β-lactoglobulin and sucrose (A), trehalose (B), or mannitol (C).
3.6. Stability Studies
90-day stability studies were conducted at 40°C and 33% RH to determine the effects of excipients and formulation on protein stability. For most of the studies (Fig. 8), the percentage of aggregates was greatest in formulations containing mannitol, with the exception of myoglobin spray-dried with sucrose and all formulations of lysozyme. In the lysozyme formulations, spray-dried samples had greater aggregate content than the lyophilized samples. With BSA, the formulations all contained aggregates prior to formulation as BSA normally form dimers at physiological pH. The samples containing sucrose and trehalose remained consistent in the aggregate content throughout the study.
Figure 8:
Stability studies of formulations containing myoglobin (A), BSA (B), β-lactoglobulin (C), or lysozyme (D).
4. Discussion
While the effects of excipients on the stability of lyophilized proteins have been well-studied, relatively few published reports have investigated the effects of different drying methods for various formulations. ssHDX-MS has been shown to be useful in investigating the effects of formulation on protein structure and matrix interactions in solid powders. In the present study, ssHDX-MS has been used together with orthogonal methods to characterize dried powders of four different model proteins produced using different excipients and drying methods.
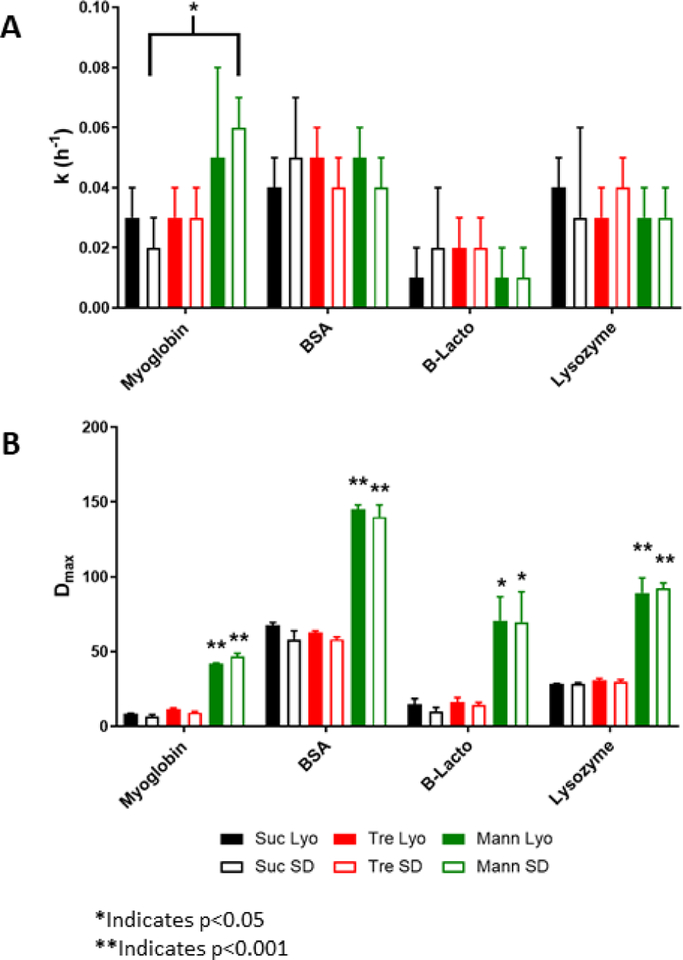
The kinetics of deuterium incorporation in ssHDX-MS were fitted to the mono-exponential model (Fig. 9). For the proteins studied, with the exception of myoglobin, there were no significant differences in the rate constants (k) of deuterium incorporation with changes in formulation or drying method (Fig. 9A). This suggests that the rate of deuteration is not affected by the density of the sample, regardless of formulation or processing condition. For myoglobin, there was a statistically significant difference in the rate of deuteration for spray-dried formulations with sucrose or mannitol (Fig. 9A). This difference is likely due to the crystallization of mannitol, resulting in more rapid deuteration. With regard to the maximum extent of deuterium exchange (Dmax, Fig. 9B), there were significant differences between formulations containing mannitol and those with sucrose or trehalose for all proteins analyzed. This may also be due to mannitol crystallinity.
Figure 9:
Deuterium exchange kinetics for protein formulations fitted to the mono-exponential model in Equation 1.
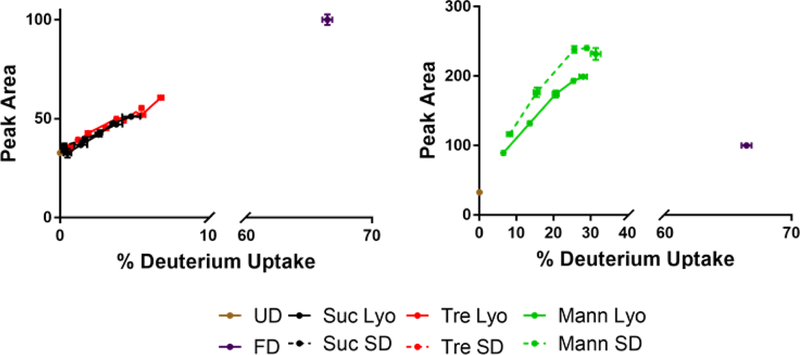
With myoglobin, none of the standard methods of analysis were able to detect structural differences. However, drying method related differences were detected using ssHDX-MS when examining the peak areas of the normalized deconvoluted mass spectra as a function of the percentage of deuterium exchanged (Fig. 10). In ssHDX-MS, mannitol samples showed two distinct populations that were not identified by conventional methods. Some broadening of the spectra and corresponding increases in peak area are expected over the deuteration time course, since the ensemble of protein molecules displays a distribution of deuteration kinetic behavior. The distinct populations observed for myoglobin cannot be attributed to this phenomenon, which instead may suggest the presence of aggregates or isolated populations trapped within a crystalline mannitol matrix, either of which will limit exposure to D2O. Interestingly, there were no differences in deuteration for myoglobin processed with sucrose or trehalose, which differs from previous studies of a monoclonal antibody, where differences in deuterium incorporation for these two excipients were observed.(Moussa et al., 2018)
Figure 10:
Peak areas of the deconvoluted mass envelope as a function of deuterium incorporation for myoglobin. Peak areas are measured as a percentage of the area of the fully deuterated (FD) sample.
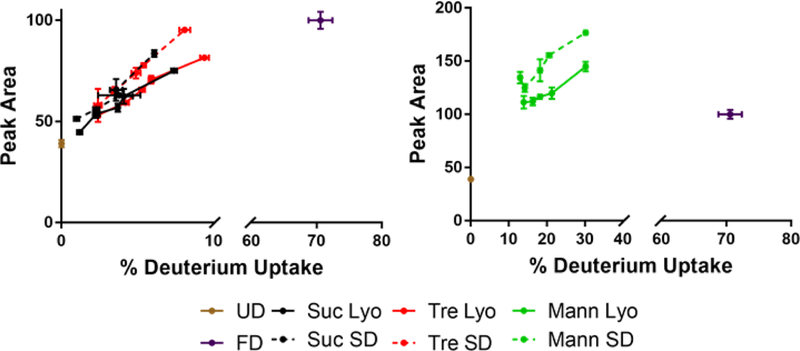
There was little difference in ssFTIR spectra with either changes in excipient or processing conditions, with the exception of β-lactoglobulin (Fig. 1). The shifting and broadening of the ssFTIR peaks for spray-dried β-lactoglobulin suggest an increase in the heterogeneity of protein structural states in the solid sample (Fig. 1C). In ssHDX-MS studies of β-lactoglobulin samples, there were no significant differences in the extent of deuterium uptake over time with different drying methods (Fig. 3C). However, the deconvoluted mass spectra showed shoulders on the right for sucrose and trehalose formulations (Fig. 6A,B) and on the left for mannitol samples (Fig. 6C) that were spray-dried, consistent with greater heterogeneity in these samples (Fig. 6). In addition, the peak areas of the deconvoluted mass envelopes for spray-dried formulations were consistently greater than corresponding lyophilized samples throughout the deuteration time course (Fig. 11), further suggesting population heterogeneity.
Figure 11:
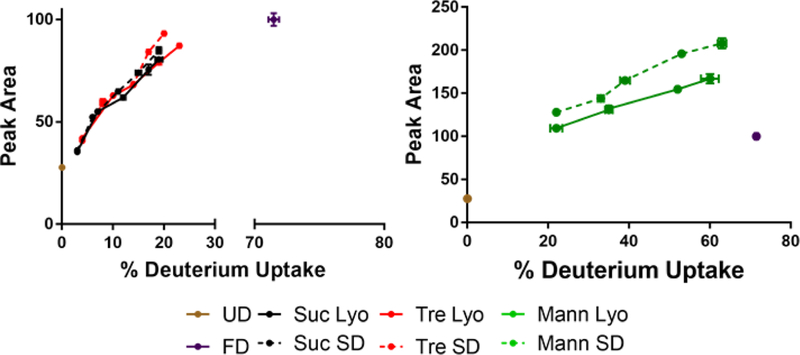
Peak areas of the deconvoluted mass envelope as a function of deuterium incorporation for BSA.
Solid-state fluorescence spectra showed process related differences for BSA and β-lactoglobulin (Fig. 2B,C). For BSA, these changes in the exposure of the hydrophobic tryptophan may be due to the lower moisture content of the spray-dried samples after the additional drying step. In ssHDX-MS analysis of these samples, spray-dried samples showed higher peak areas of the deconvoluted mass envelopes than lyophilized samples (Fig. 11). This suggests that either interactions between the protein and the matrix are weaker and more variable in the spray-dried samples and/or that there is a broader distribution of protein structures. Similar inferences cannot be made for BSA samples due to merging of peaks.
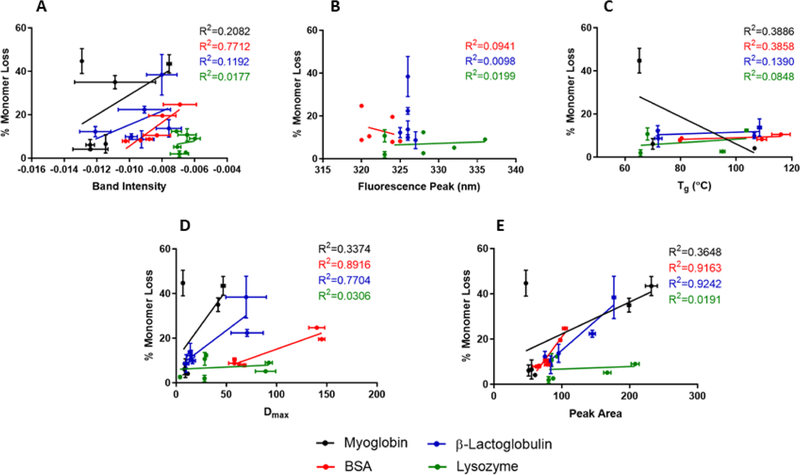
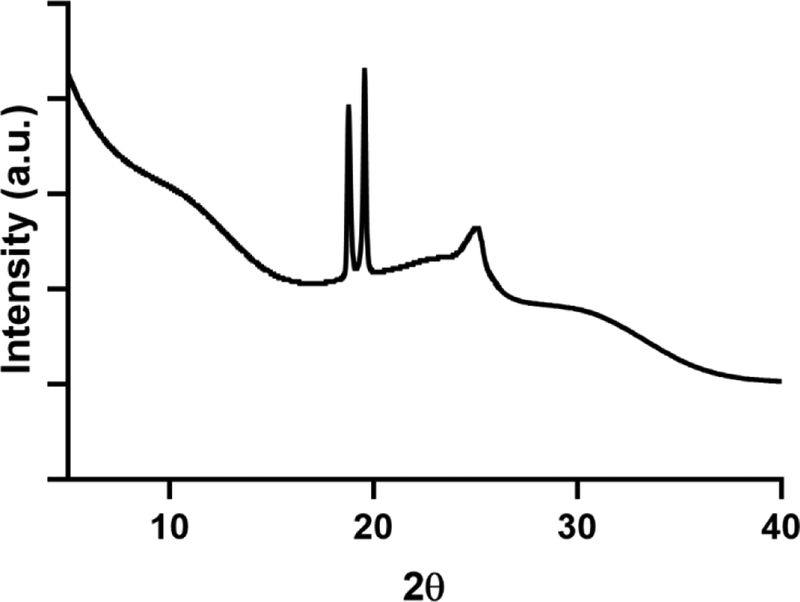
Conventional methods for analyzing proteins in solid powders were not strongly correlated to stability on storage (Fig. 14), a finding consistent with a previous study by our group.(Moorthy et al., 2014) ssHDX-MS metrics were more strongly correlated with stability. In previous reports, higher deuterium uptake has been correlated with decreased storage stability,(Moorthy et al., 2014; Moorthy et al., 2018) suggesting that weaker intermolecular interactions between protein and excipient or changes in intramolecular interactions in the protein lead to both greater deuterium incorporation and poorer stability. For the proteins studied here, mannitol formulations showed greater deuterium uptake, presumably due to phase separation caused by the crystallization of the excipient (Fig. 3). This phase separation reduces the number of possible interactions between protein and excipient, exposing more sites for deuterium exchange to occur. Mannitol samples also had the highest aggregate content on storage, with the exception of spray-dried lyophilized myoglobin with sucrose (Fig. 8), which is likely due to the crystallization of sucrose during storage (Fig. S2). Similar results were obtained when correlating stability with either the deconvoluted peak area or the maximum deuterium incorporation (Fig. 14D, E). This suggests that while peak area may be a better indicator of the populations present in the sample, it is not necessarily a better predictor of physical stability on storage.
Figure 14:
Correlation of stability to ssFTIR (A), solid-state fluorescence spectroscopy (B), Tg (C), Dmax (D), and peak area of deuterated samples (E).
In the proteins and formulations studied here, population heterogeneity was generally greater in spray-dried samples than in lyophilized samples, as indicated by ssHDX-MS peak area (Figs. 4–7, 10–13). This may be related to exposure of protein, preferentially distributed to the air-liquid interface of the droplets, to high shear during atomization. A previous report of structural heterogeneity of a spray-dried monoclonal antibody is in agreement with this finding.(Koshari et al., 2017) Our previous studies have also shown heterogeneity in the surface composition of spray-dried particles.(Bhujbal et al., 2018; Mangal et al., 2018) Proteins have higher molecular weight and lower rates of diffusion than the small-molecule excipients,(Vehring et al., 2007) which may limit redistribution of the protein away from the interface during drying. Further studies characterizing heterogeneity in dried particles and its effects on protein structure and stability are warranted.
Figure 13:
Peak areas of the deconvoluted mass envelope as a function of deuterium incorporation for lysozyme.
5. Conclusions
The effects of processing conditions and excipients on protein structure and physical stability were studied by ssHDX-MS and conventional characterization methods of ssFTIR, solid-state fluorescence spectroscopy, and DSC. While the conventional approaches detected some differences between processes and formulations, there was no strong correlation with physical stability. With ssHDX-MS, a greater correlation to physical stability was found, with greater level of instability generally corresponding to higher Dmax and peak area. In addition, ssHDX-MS was capable of identifying the population heterogeneity within a protein formulation, with increased heterogeneity occurring in spray-dried formulations as compared to the corresponding lyophilized samples. The results demonstrate that ssHDX-MS can be used as a tool not just for predicting physical stability, but also in the identifying differences in processing conditions which could lead to the development of more robust protein formulations.
Figure 12:
Peak areas of the deconvoluted mass envelope as a function of deuterium incorporation for β-lactoglobulin.
Acknowledgements
This study was partially supported by the National Institute of Allergy and Infectious Diseases of the National Institutes of Health under Award Number R01AI132681. The content is solely the responsibility of the authors and does not necessarily represent the official views of the National Institutes of Health.
Appendix A. Supporting Information
Table S1:
Formulation composition and moisture content shown as: mean (standard deviation)
| Protein | Excipient | Protein:Excipient Ratio (w/w)* | Moisture Content Lyo (%) |
Moisture Content SD (%) |
|---|---|---|---|---|
| Myoglobin | Sucrose | 1:9 | 1.7 (0.2) | 1.0 (0.5) |
| Trehalose | 1.3 (0.1) | 1.0 (0.3) | ||
| Mannitol | 1.1 (0.2) | 0.8 (0.1) | ||
| β-lactoglobulin | Sucrose | 1:9 | 1.5 (0.7) | 1.6 (0.1) |
| Trehalose | 1.6 (0.3) | 1.4 (0.5) | ||
| Mannitol | 1.5 (0.4) | 0.8 (0.2) | ||
| Bovine Serum Albumin | Sucrose | 3:2 | 1.7 (0.3) | 1.2 (0.5) |
| Trehalose | 1.5 (0.7) | 1.6 (0.1) | ||
| Mannitol | 1.5 (0.1) | 1.1 (0.5) | ||
| Lysozyme | Sucrose | 1:10 | 2.4 (0.5) | 1.4 (0.6) |
| Trehalose | 2.8 (0.7) | 2.1 (0.8) | ||
| Mannitol | 1.9 (0.3) | 1.2 (0.2) |
Different protein:excipient ratios correlate to the same molar ratio. Total solid content is 20 mg/mL.
Table S2:
Tg analysis for formulations produced by spray-drying for lyophilization (mean ± SD).
| Sample | Tg or Tm Lyo (°C)* | Tg or Tm SD (°C)* |
|---|---|---|
| Lysozyme/Suc | 65.6 ± 0.3 | 68.1 ± 0.1 |
| Lysozyme/Tre | 95.1 ± 0.9 | 103.7 ± 0.6 |
| Lysozyme/Mann | 160.6 ± 0.1 | 163.4 ± 0.1 |
| BSA/Suc | 79.8 ± 0.4 | 80.4 ± 0.1 |
| BSA/Tre | 109.2 ± 1.7 | 116.1 ± 3.3 |
| BSA/Mann | 159.5 ± 0.4 | 161.8 ± 0.2 |
| Myoglobin/Suc | 70.0 ± 0.1 | 65.2 ± 0.5 |
| Myoglobin/Tre | 106.6 ± 0.1 | 105.9 ± 0.7 |
| Myoglobin/Mann | 160.1 ± 0.1 | 160.9 ±0.4 |
| β-Lactoglobulin/Suc | 71.8 ± 0.3 | 72.0 ± 1.3 |
| β-Lactoglobulin/Tre | 106.5 ± 0.2 | 108.4 ± 0.7 |
| β-Lactoglobulin/Mann | 160.4 ± 0.4 | 163.1 ± 0.1 |
Tg for sucrose- and trehalose-containing formulations. Tm for mannitol-containing formulations.
Figure S1:
X-ray powder diffraction powders of myoglobin (A), BSA (B), β-lactoglobulin (C), or lysozyme (D). Samples were formulated with either sucrose (Suc), trehalose (Tre) or mannitol (Mann) and processed by either lyophilization (Lyo) or spray-drying (SD).
Figure S2:
X-ray powder diffraction powders of myoglobin spray-dried with sucrose after 90 days of storage.
Figure S3:
Solid-state FTIR spectra of proteins prior to formulation and processing.
Figre S4:
Deconvoluted mass spectra of proteins pre- and post-processing for myoglobin (A), BSA (B), β-lactoglobulin (C), and lysozyme (D).
References
- Abdul-Fattah AM, Kalonia DS, Pikal MJ, 2007a. The Challenge of Drying Method Selection for Protein Pharmaceuticals: Product Quality Implications. Journal of Pharmaceutical Sciences 96, 1886–1916. [DOI] [PubMed] [Google Scholar]
- Abdul-Fattah AM, Truong-Le V, Yee L, Nguyen L, Kalonia DS, Cicerone MT, Pikal MJ, 2007b. Drying-induced variations in physico-chemical properties of amorphous pharmaceuticals and their impact on stability (I): Stability of a monoclonal antibody. Journal of Pharmaceutical Sciences 96, 1983–2008. [DOI] [PubMed] [Google Scholar]
- Ameri M, Maa Y-F, 2006. Spray Drying of Biopharmaceuticals: Stability and Process Considerations. Drying Technology 24, 763–768. [Google Scholar]
- Bhujbal SV, Zemlyanov DY, Cavallaro A, Mangal S, Taylor LS, Zhou QT, 2018. Qualitative and Quantitative Characterization of Composition Heterogeneity on the Surface of Spray Dried Amorphous Solid Dispersion Particles by an Advanced Surface Analysis Platform with High Surface Sensitivity and Superior Spatial Resolution. Molecular Pharmaceutics. [DOI] [PMC free article] [PubMed] [Google Scholar]
- Burger A, Henck J-O, Hetz S, Rollinger JM, Weissnicht AA, Stöttner H, 2000. Energy/Temperature Diagram and Compression Behavior of the Polymorphs of d-Mannitol. Journal of Pharmaceutical Sciences 89, 457–468. [DOI] [PubMed] [Google Scholar]
- Carpenter JF, Chang BS, Garzon-Rodriguez W, Randolph TW, 2002. Rational design of stable lyophilized protein formulations: theory and practice. Pharm. Biotechnol. 13, 109. [DOI] [PubMed] [Google Scholar]
- Chang L, Shepherd D, Sun J, Ouellette D, Grant KL, Tang X, Pikal MJ, 2005. Mechanism of protein stabilization by sugars during freeze-drying and storage: Native structure preservation, specific interaction, and/or immobilization in a glassy matrix? Journal of Pharmaceutical Sciences 94, 1427–1444. [DOI] [PubMed] [Google Scholar]
- Cicerone MT, Pikal MJ, Qian KK, 2015. Stabilization of proteins in solid form. Advanced Drug Delivery Reviews 93, 14–24. [DOI] [PMC free article] [PubMed] [Google Scholar]
- Costantino HR, Carrasquillo KG, Cordero RA, Mumenthaler M, Hsu CC, Griebenow K, 1998. Effect of excipients on the stability and structure of lyophilized recombinant human growth hormone. J. Pharm. Sci. 87, 1412. [DOI] [PubMed] [Google Scholar]
- Fu K, Griebenow K, Hsieh L, Klibanov AM, Robert L, 1999. FTIR characterization of the secondary structure of proteins encapsulated within PLGA microspheres1An article of related interest has been published by Yang et al. in J. Pharm. Sci., 88(2), Feb. 1999, accepted Nov. 1998.1. Journal of Controlled Release 58, 357–366. [DOI] [PubMed] [Google Scholar]
- Iyer LK, Sacha GA, Moorthy BS, Nail SL, Topp EM, Process and Formulation Effects on Protein Structure in Lyophilized Solids Using Mass Spectrometric Methods. Journal of Pharmaceutical Sciences 105, 1684–1692. [DOI] [PMC free article] [PubMed] [Google Scholar]
- Keppel TR, Jacques ME, Young RW, Ratzlaff KL, Weis DD, 2011. An efficient and inexpensive refrigerated LC system for H/D exchange mass spectrometry. J. Am. Soc. Mass Spectrom. 22, 1472. [DOI] [PubMed] [Google Scholar]
- Koshari SHS, Ross JL, Nayak PK, Zarraga IE, Rajagopal K, Wagner NJ, Lenhoff AM, 2017. Characterization of Protein–Excipient Microheterogeneity in Biopharmaceutical Solid-State Formulations by Confocal Fluorescence Microscopy. Molecular Pharmaceutics 14, 546–553. [DOI] [PubMed] [Google Scholar]
- Langford A, Bhatnagar B, Walters R, Tchessalov S, Ohtake S, 2018. Drying technologies for biopharmaceutical applications: Recent developments and future direction. Drying Technology 36, 677–684. [Google Scholar]
- Lee G, 2002. Spray-Drying of Proteins, in: Carpenter JF, Manning MC (Eds.), Rational Design of Stable Protein Formulations: Theory and Practice. Springer US, Boston, MA, 135–158. [Google Scholar]
- Lin Y-W, Wong J, Qu L, Chan H-K, Zhou QT, 2015. Powder production and particle engineering for dry powder inhaler formulations. Current pharmaceutical design 21, 3902–3916. [DOI] [PubMed] [Google Scholar]
- Maa Y-F, Costantino HR, Nguyen P-A, Hsu CC, 1997. The Effect of Operating and Formulation Variables on the Morphology of Spray-Dried Protein Particles. Pharmaceutical Development and Technology 2, 213–223. [DOI] [PubMed] [Google Scholar]
- Maa Y-F, J Prestrelski S, 2000. Biopharmaceutical Powders: Particle Formation and Formulation Considerations. [DOI] [PubMed] [Google Scholar]
- Majumdar R, Middaugh CR, Weis DD, Volkin DB, 2015. Hydrogen-Deuterium Exchange Mass Spectrometry as an Emerging Analytical Tool for Stabilization and Formulation Development of Therapeutic Monoclonal Antibodies. Journal of Pharmaceutical Sciences 104, 327–345. [DOI] [PubMed] [Google Scholar]
- Mangal S, Xu R, Park H, Zemlyanov D, Shetty N, Lin Y-W, Morton D, Chan H-K, Li J, Zhou QT, 2018. Understanding the Impacts of Surface Compositions on the In-Vitro Dissolution and Aerosolization of Co-Spray-Dried Composite Powder Formulations for Inhalation. Pharmaceutical Research 36, 6. [DOI] [PMC free article] [PubMed] [Google Scholar]
- Manning MC, Chou DK, Murphy BM, Payne RW, Katayama DS, 2010. Stability of Protein Pharmaceuticals: An Update. Pharmaceutical Research 27, 544–575. [DOI] [PubMed] [Google Scholar]
- Moorthy BS, Schultz SG, Kim SG, Topp EM, 2014. Predicting Protein Aggregation during Storage in Lyophilized Solids Using Solid State Amide Hydrogen/Deuterium Exchange with Mass Spectrometric Analysis (ssHDX-MS). Molecular Pharmaceutics 11, 1869–1879. [DOI] [PMC free article] [PubMed] [Google Scholar]
- Moorthy BS, Zarraga IE, Kumar L, Walters BT, Goldbach P, Topp EM, Allmendinger A, 2018. Solid-State Hydrogen–Deuterium Exchange Mass Spectrometry: Correlation of Deuterium Uptake and Long-Term Stability of Lyophilized Monoclonal Antibody Formulations. Molecular Pharmaceutics 15, 1–11. [DOI] [PubMed] [Google Scholar]
- Moriyama Y, Watanabe E, Kobayashi K, Harano H, Inui E, Takeda K, 2008. Secondary Structural Change of Bovine Serum Albumin in Thermal Denaturation up to 130 °C and Protective Effect of Sodium Dodecyl Sulfate on the Change. The Journal of Physical Chemistry B 112, 16585–16589. [DOI] [PubMed] [Google Scholar]
- Moussa EM, Wilson NE, Zhou QT, Singh SK, Nema S, Topp EM, 2018. Effects of Drying Process on an IgG1 Monoclonal Antibody Using Solid-State Hydrogen Deuterium Exchange with Mass Spectrometric Analysis (ssHDX-MS). Pharmaceutical Research 35, 12. [DOI] [PubMed] [Google Scholar]
- Schüle S, Frieß W, Bechtold-Peters K, Garidel P, 2007. Conformational analysis of protein secondary structure during spray-drying of antibody/mannitol formulations. European Journal of Pharmaceutics and Biopharmaceutics 65, 1–9. [DOI] [PubMed] [Google Scholar]
- Sharma VK, Kalonia DS, Steady-State Tryptophan Fluorescence Spectroscopy Study to Probe Tertiary Structure of Proteins in Solid Powders. Journal of Pharmaceutical Sciences 92, 890–899. [DOI] [PubMed] [Google Scholar]
- Simperler A, Kornherr A, Chopra R, Bonnet PA, Jones W, Motherwell WDS, Zifferer G, 2006. Glass Transition Temperature of Glucose, Sucrose, and Trehalose: An Experimental and in Silico Study. The Journal of Physical Chemistry B 110, 19678–19684. [DOI] [PubMed] [Google Scholar]
- Sinha S, Li Y, Williams TD, Topp EM, 2008. Protein Conformation in Amorphous Solids by FTIR and by Hydrogen/Deuterium Exchange with Mass Spectrometry. Biophysical Journal 95, 5951–5961. [DOI] [PMC free article] [PubMed] [Google Scholar]
- Sophocleous AM, Zhang J, Topp EM, 2012. Localized Hydration in Lyophilized Myoglobin by Hydrogen-Deuterium Exchange Mass Spectrometry. 1. Exchange Mapping. Molecular Pharmaceutics 9, 718–726. [DOI] [PMC free article] [PubMed] [Google Scholar]
- Souillac PO, Middaugh CR, Rytting JH, 2002. Investigation of protein/carbohydrate interactions in the dried state. 2. Diffuse reflectance FTIR studies. International Journal of Pharmaceutics 235, 207–218. [DOI] [PubMed] [Google Scholar]
- Vehring R, Foss WR, Lechuga-Ballesteros D, 2007. Particle formation in spray drying. Journal of Aerosol Science 38, 728–746. [Google Scholar]
- White S, Bennett DB, Cheu S, Conley PW, Guzek DB, Gray S, Howard J, Malcolmson R, Parker JM, Roberts P, Sadrzadeh N, Schumacher JD, Seshadri S, Sluggett GW, Stevenson CL, Harper NJ, 2005. EXUBERA®: Pharmaceutical Development of a Novel Product for Pulmonary Delivery of Insulin. Diabetes Technology & Therapeutics 7, 896–906. [DOI] [PubMed] [Google Scholar]
- Yoshioka S, Aso Y, Kojima S, 1999. The Effect of Excipients on the Molecular Mobility of Lyophilized Formulations, as Measured by Glass Transition Temperature and NMR Relaxation-Based Critical Mobility Temperature. Pharmaceutical Research 16, 135–140. [DOI] [PubMed] [Google Scholar]


