Abstract
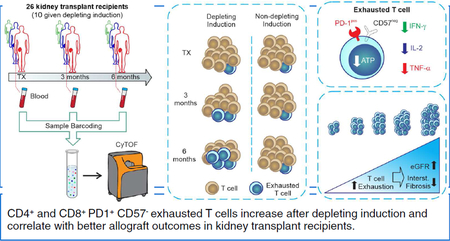
Continuous antigen stimulation during chronic infection or malignancy can promote functional T cell silencing, a phenomenon called T cell exhaustion. The prevalence and impact of T cell exhaustion following organ transplantation, another immune stimulus with persistently high antigen load, are unknown. Here, we characterized serially collected peripheral blood mononuclear cells from 26 kidney transplant recipients using time-of flight mass cytometry (CyTOF) to define distinct subsets of circulating exhausted T cells and their relationship to induction therapy and allograft function. We observed an increase in specific subsets of CD4+ and CD8+ exhausted T cells from pre-transplant to 6-months post-transplant, with greater increases in participants given anti-thymocyte globulin induction than in participants who received no induction or non-depleting induction. The percentages of exhausted T cells at 6 months correlated inversely with ATP production (a surrogate of T cell function) and with allograft interstitial fibrosis. Guided by the CyTOF data, we delineated a PD-1+CD57- phenotype for CD4+ and CD8+ exhausted T cells, and confirmed that these cells have limited capacity for cytokine secretion and ATP production. In an independent cohort of 50 kidney transplant recipients, we confirmed the predicted increase of PD-1+CD57- exhausted T cells after lymphocyte-depleting induction therapy and its direct correlation with better allograft function. Our findings suggest that monitoring T cell exhaustion can be useful for post-transplant risk assessment and support the need to develop and test strategies aimed at augmenting T cell exhaustion following kidney transplantation.
Keywords: Depleting induction, renal, kidney, CyTOF, T cell exhaustion, thymoglobulin
Graphical Abstract
INTRODUCTION
T cell exhaustion is a hyporesponsive state initially described in association with chronic viral infection in CD8+ T cells.1, 2 In this setting, virus‐specific CD8+ T cells expand and acquire effector functions, but progressively develop a reduced ability to secrete tumor necrosis factor α (TNF-α) and interferon γ (IFN-γ) followed by decreased proliferative capacity and diminished interleukin-2 (IL‐2) production.3
While the mechanisms leading to T cell exhaustion are not fully elucidated, chronic exposure to foreign or self-antigens is a key prerequisite and current concepts implicate upregulation of co-inhibitory molecules including PD-1 as crucial.3 Since its original description in murine models of chronic viral infection,1, 4 T cell exhaustion has been reported in a variety of other murine systems and in humans with chronic bacterial and parasitic infections, malignancies, and situations associated with persistent severe inflammation.3, 5–7 T cell exhaustion is now considered a differentiation state that prevents immunopathology in situations of persistent high antigen load and inflammation, but can also be exploited by pathogens and tumors to dampen or silence potentially protective immunity.3
In organ transplantation, the recipient’s immune system is chronically exposed to a high foreign antigen load that is initially presented in the context of inflammation, thereby mimicking other conditions in which T cell exhaustion occurs.8, 9 While Starzl et al.10 postulated as early as 1998 that T cell exhaustion might contribute to long-term graft acceptance, there is no direct evidence that it develops after transplant, and the impact of T cell exhaustion on transplant outcomes is not known.
The lack of universal phenotypic markers of T cell exhaustion and the fact that the relevant exhaustion phenotypes differ across settings (e.g., cancer or viral infections) represent challenges in the field.5 Identification of reliable phenotypic markers for exhausted T cells (TEXH) in kidney transplant recipients and ascertainment of any associations between TEXH and outcomes could inform fundamental understanding and define a putative biomarker for transplant risk assessment.
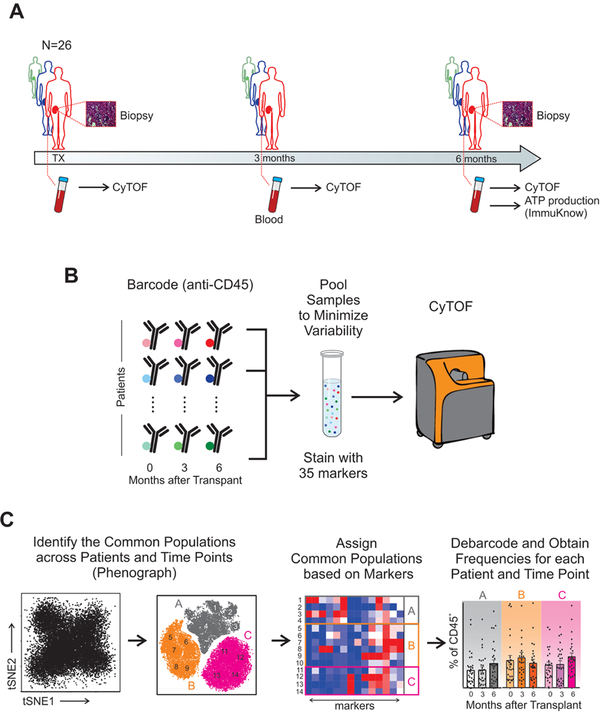
In an effort to address these issues we used time-of-flight mass cytometry (CyTOF) to analyze peripheral blood lymphocytes collected prospectively from the observational study Clinical Trials in Organ Transplantation (CTOT)-01, for which two-year clinical outcomes are known (Figure 1). CyTOF can deconvolute at least 40 distinct antibody markers to comprehensively characterize an immune phenotype. Using unbiased clustering, we 1) assessed changes of CD4+ and CD8+ TEXH in kidney transplant recipients, 2) determined the strength of the relationships among T cell exhaustion and clinical outcomes, and 3) elucidated the effects of depleting versus non-depleting induction therapy on frequencies of TEXH. We then employed standard flow cytometry using a distinct, CyTOF-guided, set of surface antigens to validate relationships among TEXH in peripheral blood and graft function/histology with an independent cohort of kidney transplant recipients from the ongoing CTOT-19 trial.
Figure 1. Serial high-dimensional immune profiling of kidney transplant recipients.
(A) Study design and (B-C) schematic of immune characterization of kidney transplant recipients and its evolution over time. Blood collected at time of transplant, 3-months, and 6-months post-transplant was processed, barcoded for patient and time, pooled, and stained with 35 antibodies conjugated to metal isotopes. Mass cytometry (CyTOF) single-cell data was clustered using Phenograph to identify common populations across subjects and time points (see Methods) allowing us to study the evolution in time of different compartments in transplant patients.
RESULTS
Changes in major immune compartments identified by CyTOF in kidney transplant recipients
We performed CyTOF analyses (Figure 1) on stored PBMC from 26 kidney transplant recipients from the observational CTOT-01 study:11 Ten received lymphocyte-depleting induction with anti-thymocyte globulin (ATG, depleting induction group) and 16 received either no induction (n=2) or non-depleting induction with basiliximab (n=14) (non-depleting induction group) as per center practice (Table 1). Three patients per group developed acute cellular rejection within 6 months after transplant. Maintenance immunosuppression was similar across patients and none of them developed opportunistic infections during the follow-up period.
Table 1.
Baseline characteristics of study participants.
| Total (n=26) |
Depleting Induction (n=10) |
Non-depleting Induction (n=16) | P-Value | |
|---|---|---|---|---|
| Donors | ||||
| Age (yrs) | 42.0 ± 11.3 | 47.8 ± 11.3 | 38.4 ±9.9 | 0.04 |
| Sex n (%) | 1.00 | |||
| Female | 14 (54) | 5 (50) | 9 (56) | |
| Male | 12 (46) | 5 (50) | 7 (44) | |
| Living n (%) | 58 | 30 | 75 | 0.04 |
| Race n (%) | 0.01 | |||
| White | 17 (65) | 6 (60) | 11 (69) | |
| Black or AA | 5 (19) | 3 (30) | 2 (13) | |
| Asian | 2 (8) | 0 (0) | 2 (13) | |
| Other | 2 (8) | 1 (10) | 1 (7) | |
| Recipients | ||||
| Age (yrs) | 47.5 ± 16.1 | 49.9 ± 12.9 | 46.0 ± 18.1 | 0.53 |
| Sex n (%) | 1.00 | |||
| Female | 10 (48) | 4 (40) | 6 (37) | |
| Male | 16 (62) | 6 (60) | 10 (63) | |
| Race n (%) | 0.69 | |||
| White | 13 (50) | 2 (20) | 11 (69) | |
| Black or AA | 12 (46) | 8 (80) | 4 (25) | |
| Asian | 1 (4) | 0 (0) | 1 (7) | |
| Primary Renal Disease n (%) | 0.22 | |||
| Glomerular | 7 (27) | 2 (20) | 5 (31) | |
| Vascular | 8 (31) | 5 (50) | 3 (19) | |
| Diabetes | 7 (27) | 3 (30) | 4 (25) | |
| ADPKD | 3 (11) | 0 (0) | 3 (19) | |
| Other and unknown | 1 (4) | 0 (0) | 1 (7) | |
| Cold ischemia time (min) | 868.8 ± 354.1 | 824.8 ±354.1 | 864.3 ± 339.9 | 0.51 |
| Peak PRA >20% n (%) | 3 (15) | 1 (10) | 2 (19) | 1.00 |
| HLA matches n (%) | 0.009 | |||
| 0–2 | 12 (46) | 7 (70) | 5 (31) | |
| 3–4 | 9 (35) | 0 (0) | 9 (56) | |
| 5–6 | 2 (8) | 1 (10) | 1 (7) | |
| Unknown | 3 (12) | 2 (20) | 1 (7) |
Continuous variables represented as mean ± SD. Categorical variables as numbers (percentage). PRA: Panel Reactivity Antibody, AA: African American, ADPKD: Autosomal dominant polycystic kidney disease.
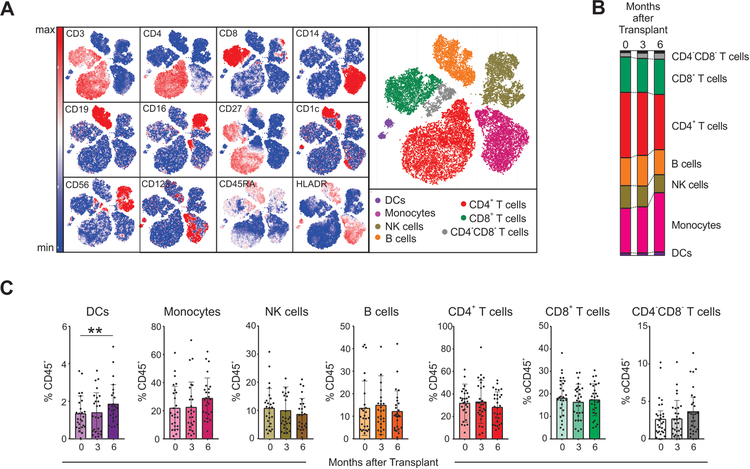
We analyzed the kinetic evolution of the frequencies of major immune compartments in peripheral blood, using unbiased clustering (Phenograph,12 based on Louvain clustering algorithms, see Methods) with 13 markers and viSNE13 to visualize high-dimensional data in two dimensions while preserving single-cell resolution (Figure 2A). At the time of transplant (baseline), the percentage of dendritic cells (DCs), monocytes, natural killer (NK) cells, B cells, CD4+ T cells, CD8+ T cells and CD4−CD8− T cells were comparable to those described by others using CyTOF in healthy subjects12, 14, 15 (Figure 2B–C). When the 26 subjects were analyzed together, we found no significant differences in any of the major cell compartments at 3- or 6-months after transplant versus baseline, except for modestly increased frequencies of DCs at 6-months (Figure 2B–C).
Figure 2. Frequencies of major immune compartments.
(A) viSNE analysis of peripheral blood mononuclear cells (PBMC) from a representative patient including 3 time points (baseline, 3 months, and 6 months after transplant) colored by their relative expression of CyTOF markers to designate major immune clusters (populations defined on the right). (B-C) Percentages of major immune compartments once demultiplexed and based on the summation of Phenograph clusters at baseline, 3 months, and 6 months post-transplant (see Methods, n=26 subjects). *p<0.05, **p<0.01 by paired t-test. Bar plots depict mean ± SD.
When we stratified subjects according to the induction therapy, we observed no significant differences in the percentages of DCs, NK cells, B cells and CD8+ T cells, at baseline, 3- and 6-months after transplant (Supplementary Figure 1). In contrast, we observed increased percentages of monocytes between baseline and 6-months in subjects who received lymphocyte depletion, an increase that was mainly driven by changes in the classical CD14+CD16− monocyte subset (Supplementary Figure 2).
CyTOF analysis identifies multiple subsets of exhausted CD4+ T cells in kidney transplant recipients
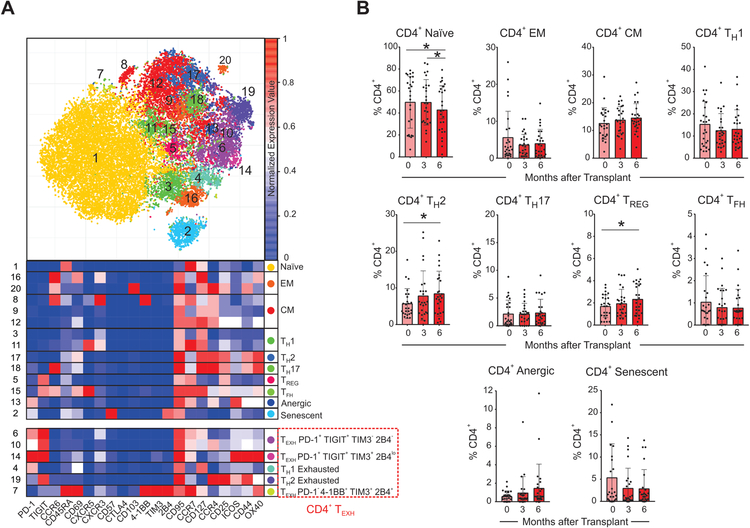
We next analyzed the kinetic changes in CD4+ T cell subsets after transplant by performing a second level of unbiased clustering on the CD4+ T cells using 21 additional markers (Figure 3). We delineated and analyzed the kinetics of CD4+ naïve, effector memory (EM), central memory (CM), T-helper 1 (TH1), 2 (TH2) 17 (TH17), follicular helper (TFH), and regulatory cells (TREG), as well as those with an anergic (CD57−PD-1+4–1BB−TIM3−2B4−TIGIT−),16, 17 or senescent (CD57+CD44−ICOS−OX40−)18, 19 phenotype (see Supplementary Table 2 for a details on marker expression for each non-exhausted subset). These analyses showed that modest (albeit significant) increases in percentages of subsets expressing TH2 and TREG phenotypes at 3- and 6-months after transplant versus baseline (Figure 3B).
Figure 3. Changes in CD4+ T cell subsets after transplant.
(A) Representative viSNE analysis of CD3+ CD4+ immune cells (top) colored and labeled by Phenograph cluster and the corresponding heatmap assignment (bottom) for all subjects and time points combined (see Methods). (B) Percentages of CD4+ T cell subsets once demultiplexed and based on the summation of Phenograph clusters at baseline, 3 months, and 6 months after transplant *p<0.05 by paired t-test (see Methods, n=26 subjects). Bar plots depict mean ± SD.
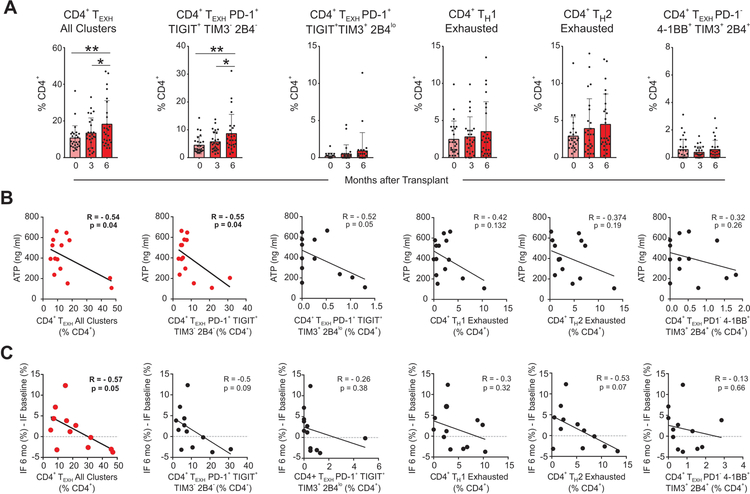
When we analyzed TEXH markers on CD4+ T cells we observed that those expressing at least one of the markers previously described in the literature: PD-1, TIGIT, 4–1BB, TIM3, 2B4,16, 20–23 significantly increased at 6-months after transplant compared to baseline (Figure 4A). The unbiased cluster analysis also revealed significant heterogeneity within the CD4+ TEXH, manifested by five distinct clusters (Figure 3–4). Of these clusters, the CD4+PD-1+TIGIT+TIM3−2B4− population is the major contributor to the increase in CD4+ TEXH post-transplant (Figure 4A). None of the baseline demographic or clinical characteristics of CTOT-01 patients included in Table 1 were associated with TEXH percentages at baseline or at later time points.
Figure 4. CD4+ TEXH cells increase post-transplant, inversely correlate with ATP production, and associate with graft fibrosis.
(A) Analysis of the percentages of all 5 CD4+ TEXH subsets together, and separately (as defined in Figure 3) post-transplant (n=26, *p<0.05, **p<0.01 by paired t-test), (B) their correlation at 6 months with ATP production in CD4+ T cells measured by the ImmuKnow assay and (C) with changes in the percentage of interstitial fibrosis between 6 months and baseline (all subjects for which measurements were available including patients receiving lymphocyte depleting and non-depleting induction, n=12, Pearson correlation). Bar plots depict mean ± SD.
Percentages of CD4+ TEXH inversely correlate with CD4+ T cell ATP production
One hallmark of TEXH is their low metabolic activity and accompanying decrease in intracellular adenosine triphosphate (ATP) demand.24 The Immuknow® assay is a commercially available immune monitoring assay that quantifies intracellular ATP synthesis in stimulated CD4+ T cells.25 As part of the CTOT-01 protocol, peripheral blood samples obtained 6 months after transplant were analyzed for ATP using this assay. We tested for associations among these measurements and the percentages of circulating CD4+ TEXH as measured by CyTOF at the same time point. Concentrations of ATP in our cohort were comparable to those previously described in kidney transplant recipients.26–28 Our analyses showed a significant inverse relationship between ATP synthesis and total CD4+ TEXH (R: −0.542; p=0.04) driven by the percentage of the CD4+PD-1+TIGIT+TIM3−2B4− exhausted subset (R: −0.55; p=0.04; Figure 4B), together providing a functional correlate for the CyTOF phenotypes. None of the other CD4+ subsets correlated with ATP synthesis (not shown).
Percentages of CD4+ TEXH associate with reduced graft fibrosis
In autoimmune conditions, increased circulating TEXH are associated with milder disease severity and reduced incidence of flares.29 To test whether TEXH is associated with better allograft function, we correlated percentages of CD4+ TEXH at 6-months post-transplant with changes in interstitial fibrosis quantified by morphometric analysis in surveillance graft biopsies between implantation and 6-months post-transplant. These analyses showed an inverse relationship between the percentages of CD4+ TEXH at 6-months and progressive interstitial fibrosis (R: −0.57; p=0.05, Figure 4C), independent from the kind of depleting vs non-depleting induction therapy. CD4+ TEXH at 6-months trended towards a positive correlation with eGFR at the same time point, but this relationship did not reach statistical significance (not shown). Together, these associative findings support the hypothesis that increased CD4+ TEXH contributes to improved allograft function.
We also tested the relationship between TEXH frequencies and the following readouts obtained through the CTOT01 trial: mRNA expression of chemokines and cytokines in the urine (CCR5, CCL5, IL-8, IP10, CXCR3, CCR1, RANTES, CXCL9, MCP1) and blood (Granzyme B, and Perforin), as well as urine levels of IP10 and CXCL9 proteins. We found no significant associations between the percentage of circulating TEXH and any of these inflammatory markers, except for urinary CXCL9 mRNA. CD4+ TEXH (PD1+TIGIT+TIM3+2B4lo) frequencies negatively correlated with urine CXCL9 mRNA levels (R: −0.739; P: 0.0145), consistent with the hypothesis that exhaustion associates with reduced intragraft inflammation.
Percentages of CD8+ TEXH inversely correlate with graft fibrosis
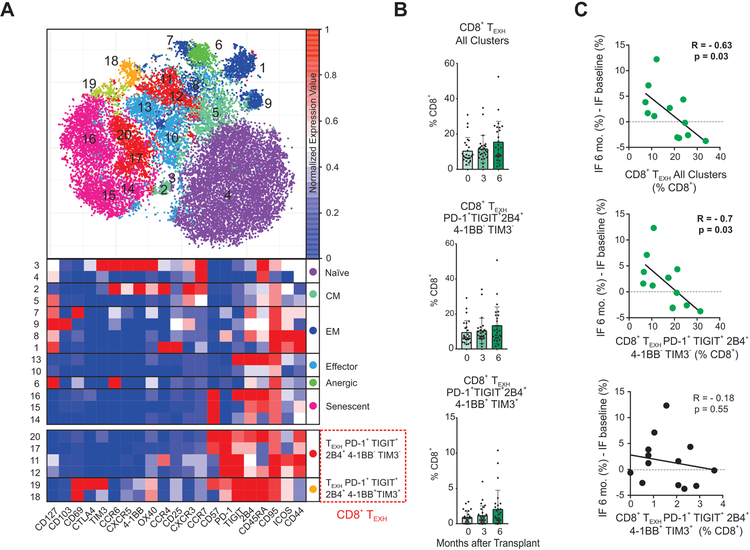
We next analyzed the CD8+ T cell compartment utilizing an analogous unbiased clustering strategy. We deconvoluted the frequencies of naïve, central memory (CM), effector memory (EM), effector (Eff), anergic, senescent, and CD8+ TEXH (defined as expressing at least one of the 5 exhaustion markers, Figure 5A and Supplementary Table 2). None of these significantly increased over baseline (data not shown).
Figure 5. Changes in CD8+ subsets after transplant and association of CD8+ TEXH with graft fibrosis.
(A) Representative viSNE analysis of CD3+ CD8+ immune cells (top) colored and labeled by Phenograph cluster and the corresponding heatmap assignment (bottom) for all subjects and time points combined (see Methods). (B) Analysis of the percentages of the two CD8+ TEXH subsets together, and separately post-transplant (n=26, *p<0.05, **p<0.01 by paired t-test), (C) and their correlation with changes in the percentage of interstitial fibrosis between 6 months and baseline (all subjects for which measurements were available including patients receiving lymphocyte depleting and non-depleting induction, n=12, Pearson correlation). Bar plots depict mean ± SD.
In contrast to the heterogeneity of CD4+ TEXH (Figure 3), CD8+ TEXH consisted of only two subsets that differed in markers 4–1BB (CD137, an activation-induced costimulatory molecule)30 and TIM3,31 yielding a CD8+PD-1+TIGIT+2B4+41BB−TIM3− subset and a CD8+PD-1+TIGIT+2B4+4–1BB−TIM3− subset. We did not observe significant increases in the CD8+ TEXH compartments during the 6-month post-transplant period in the CTOT-01 cohort (Figure 5B). However, when we tested for a relationship between the percentage of CD8+ TEXH at 6-months post-transplant and interstitial fibrosis in 6-month surveillance graft biopsies, we observed a significant inverse correlation for total CD8+ TEXH (R:−0.63; p=0.03) and for the CD8+PD-1+2B4+4–1BB−TIM3− subset (R:−0.7; p=0.03; Figure 5C), independent of depleting vs. non-depleting induction therapy.
Lymphocyte depletion is associated with increased CD4+ TEXH and CD8+ TEXH
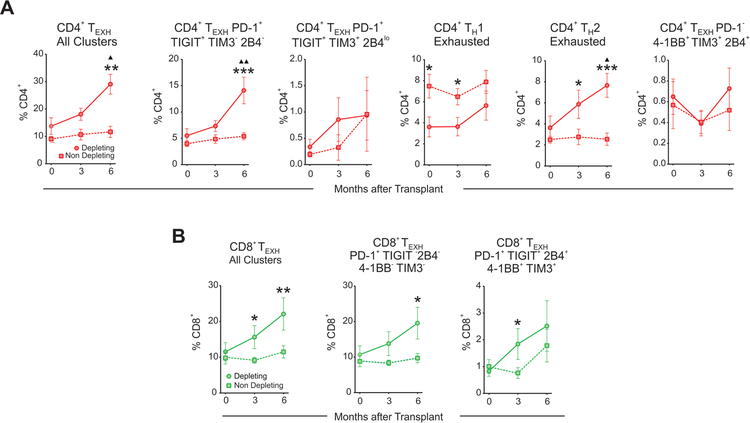
T cell depletion has been hypothesized to influence TEXH.10 To test this hypothesis in our transplant cohort, we compared the kinetics of TEXH frequencies between the subjects given ATG induction (n=10) and those given non-depleting induction (n=16). These analyses revealed that ATG administration was associated with increased percentages of total CD4+ TEXH (all subsets included), and in particular the CD4+ TH2 exhausted and CD4+ TEXH PD-1+TIGIT+TIM3−2B4− subsets (Figure 6A). Similarly, subjects given ATG induction showed increased percentages of total CD8+ TEXH, and in particular increased percentages of the CD8+ TEXH 4–1BB−TIM3− (Figure 6B). ATG induction therapy also associated with lower circulating CD4+ T cells at 3- and 6-months post-transplant, verifying T cell depletion in the treated cohort (Supplementary Figure 3A).
Figure 6. Lymphocyte depletion is associated with increased CD4+ TEXH and CD8+ TEXH.
Graphs depicting the evolution over time of the percentages post-transplant of all CD4+ TEXH (A) or CD8+ TEXH (B) subsets together and separately in subjects that received depleting (n=10 subjects) and non-depleting (n=16 subjects) induction therapy. Comparisons between depleting and non-depleting groups at the same time point by unpaired t-test (*p<0.05, **p<0.01, ***p<0.001) and with baseline for each group by paired t-test (▲p<0.05, ▲▲p<0.01). Data points are depicted as mean ± SEM.
The percentages of CD4+ T cells measured by CyTOF correlated with those obtained by flow cytometry on the same samples and were similar to those of the entire cohort of CTOT-01 subjects receiving depleting induction (Supplementary Figure 3B–C).11 Amongst the remaining major immune compartments, we found that monocytes significantly increased over time in subjects who received ATG (Supplementary Figure 2). We also observed increases in TREG over time in all subjects regardless of the type of induction (Supplementary Figure 4). Analyses showed no differences in naïve, EM, CM, anergic, or senescent CD8+ T cell percentages between the depleting and non-depleting groups at any timepoint (Supplementary Figure 5). Together, the findings suggest that ATG induction increases CD4+ and CD8+ TEXH post-transplant, while preserving TREG.32
Flow cytometrically-defined CD4+ TEXH and CD8+ TEXH are functionally exhausted
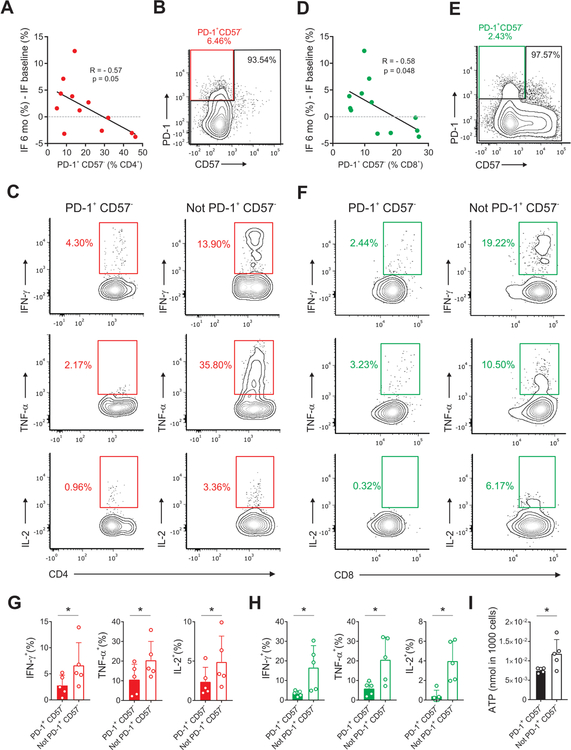
To simplify the detection of TEXH cells for broader application, we reanalyzed the CyTOF data with the goal of identifying a reliable and inclusive set of measurable surface markers that correlate with graft outcomes and could be detected by standard flow cytometry. We iteratively evaluated all possible combinations of the five exhaustion markers, the senescence marker18, 19 CD57 and the anergic marker17 CTLA4, in CD4+ and CD8+ T cells. These analyses uncovered that PD-1 and CD57 represent the minimum number of markers that could reproduce the correlations between the percentages of CD4+ TEXH (CD4+PD-1+CD57−) and CD8+ TEXH (CD8+PD-1+CD57−) and transplant outcomes (Figure 7A and 7D).
Figure 7. CD4+ TEXH and CD8+ TEXH present functional features of exhaustion.
Correlation between the percentage of CD4+PD-1+CD57− (A) and CD8+ PD-1+CD57− cells (D) as measured by CyTOF (determined by the clusters depicted in Figure 3A and Figure 5A) with changes in the percentage of interstitial fibrosis between 6 months and baseline (all subjects for which measurements were available including patients receiving depleting and non-depleting induction, n=12, Pearson correlation). Representative gating strategies, scatter plots, and summary bar graphs of cytokine production in CD4+ PD-1+CD57− (B,C,G) and CD8+ PD-1+ CD57− (E,F,H) compared with their PD-1− counterparts by paired t-test. (I) Comparison of ATP levels in CD4+ PD-1+CD57− and CD4+ not PD-1+ CD57− by paired t-test (n=5 subjects, * p ≤ 0.05). Bar plots depict mean ± SD.
To confirm that the phenotypically characterized TEXH exhibit functional features of exhaustion, we measured intracellular cytokines in CD4+ and CD8+ TEXH obtained from peripheral blood of CTOT-01 subjects 6-months post-transplant. These studies showed that the PD-1+CD57− CD4+ T cells and PD-1+CD57− CD8+ T cells contained markedly reduced IL-2, IFN-γ, and TNF-α production (Figure 7B–H) compared to their PD-1− counterparts, consistent with exhaustion.3, 9 We next flow-sorted CD4+PD-1+CD57− and CD4+PD-1− cells and analyzed ATP production within each subset. The assays showed significantly less ATP production in CD4+PD-1+CD57− vs. CD4+PD-1− T cells (Figure 7I), providing further evidence that the PD-1+CD57− T cells are functionally exhausted.
Flow cytometric analysis of an independent cohort indicates that percentages of CD4+ TEXH and CD8+ TEXH correlate with transplant outcomes
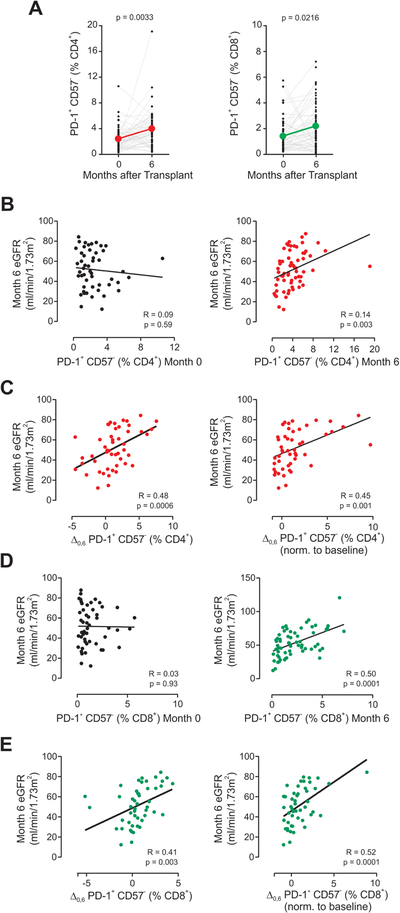
To further test the relationship between TEXH and graft outcomes in kidney transplant recipients, we performed a mechanistic sub-study of the ongoing CTOT-19 trial (NCT02495077; see Methods). We analyzed pre-transplant and 6-month post-transplant peripheral blood samples from 50 enrollees, blinded to the study arm, correlating the percentages of CD4+PD-1+CD57− and CD8+PD-1+CD57− T cells with 6-month post-transplant estimated glomerular filtration rate (eGFR). We observed significantly higher percentages of both CD4+ and CD8+ TEXH at 6-months post-transplant compared to pre-transplant, noting that all subjects received ATG induction (Figure 8A). Remarkably, the analyses also showed that the percentages of CD4+ and CD8+ TEXH at 6-months post-transplant directly correlated with the 6-month eGFR (Figure 8B–E). We found no association between CD4+ and CD8+ TEXH and recipient age or number of HLA mismatches between donor and recipient.
Figure 8. CD4+ TEXH and CD8+ TEXH correlate with transplant outcomes.
(A) Change in percentages of CD4+PD-1+CD57− (left) and CD8+ PD-1+CD57− cells (right) measured by flow cytometry in the ATG-induced cohort CTOT-19 (n=50, paired t-test). Correlation of eGFR at 6 months after transplant with (B) the percentage of CD4+PD-1+CD57− at baseline (left) and 6 months post-transplant (right), (C) the absolute increase in percentage (left) and the normalized increase (right) of CD4+PD-1+CD57− cells between 0 and 6 months, (D) the percentage of CD8+PD-1+CD57− at baseline (left) and 6 months post-transplant (right), and (E) the absolute increase in percentage (left) and the normalized increase (right) of CD8+PD-1+CD57− cells between 0 and 6 months (Pearson correlation, n=50).
DISCUSSION
Through a comprehensive CyTOF analyses of 35 immune markers, we identified circulating CD4+ and CD8+ T cells with exhausted phenotypes that significantly increase after kidney transplantation and are limited in their abilities to produce cytokines or synthesize ATP. Their percentages at 6-months inversely correlate with progressive interstitial fibrosis between 0- and 6-month post-transplant.
T cell exhaustion has been extensively studied in the context of tumor immunity.6 Most T cells in the tumor microenvironment are exhausted, leading to cancer immune evasion. Chronic exposure to tumor antigens, incomplete T cell activation associated with expression of inhibitory receptors by tumor cells, soluble mediators, and the presence of TREG are thought to represent the main mechanisms responsible for the induction of exhaustion in individuals with tumors.
Many of these elements are also present in the transplant setting.8, 9 Alloreactive T cells are exposed to a large and persistent alloantigen load, while chronic immunosuppression prevents their full activation. The importance of antigen load in the induction of T cell exhaustion is supported by experimental and clinical studies showing that simultaneous transplantation of two grafts results in long‐term graft acceptance, whereas single grafts are rejected acutely.33 Direct evidence of lymphocyte exhaustion playing a protective role in transplantation in mice was recently provided using the bm12 single MHC class II–mismatched heart transplant model of chronic rejection. Inhibition of selectin‐dependent leukocyte recruitment in fucosyltransferase VII knock out recipients increased CD4+ T cell exhaustion and prevented rejection.34, 35
To the best of our knowledge, the present study is the first to provide evidence that T cell exhaustion occurs in humans after kidney transplantation. Previous studies on T cell exhaustion in humans with cancer36 or chronic infections37, 38 were able to identify antigen specific TEXH through the use of tumor or virus-specific tetramers, but the lack of HLA-specific tetramers that can effectively track alloreactive T cells in transplanted individuals prevented us to identify donor-specific TEXH in transplant patients. However, in our study, TEXH were the only cell subset significantly associated with graft outcomes, strongly supporting the hypothesis that TEXH expanding after transplant are, at least partially, donor specific.
Other observations indirectly support the role of TEXH in transplant outcomes. The declined incidence of acute rejection observed after the first 6–12 months post-transplant coincides with the increase in percentage of TEXH, together with the reduced need for chronic immunosuppressive therapy.9 Administration of anti-PD-1 antibody for tumor therapy in a stable kidney transplant recipient was associated with acute allograft rejection, possibly as the result of reinvigoration of donor-reactive TEXH.39
Our finding that depleting induction therapy is associated with increased TEXH cells is consistent with the upregulation of PD-1 after lymphocyte depletion in stem cell transplant recipients.40 The fact that subjects with higher TEXH in our study had better graft outcomes, supports the idea that promotion of T cell exhaustion is one mechanism by which ATG reduces the incidence of acute rejections in kidney transplant recipients.41 On the other hand, increased TEXH after ATG may also explain the increased incidence of opportunistic infections41 and tumors42 associated with this treatment.
Our phenotypic analyses are corroborated by functional data demonstrating that identified CD4+ and CD8+ TEXH display the hallmarks of exhaustion. Importantly, the percentages of CD4+ TEXH inversely correlate with ATP synthesis in total CD4+ T cells. This finding may, at least partially, explain previous data showing a relationship between high ImmuKnow® measurements (and therefore low TEXH) and increased risk of acute rejection.26, 43
The identification, based on the comprehensive CyTOF dataset analysis, of the minimum set of markers (PD-1+, CD57−) able to identify TEXH is important because it allows to easily identify them by flow cytometry, paving the way for future studies aimed at understanding the mechanisms that regulate their formation, persistence, and function in transplant recipients.
We performed our CyTOF analyses on samples from the Clinical trial in Organ Transplantation (CTOT)-01, an NIH-funded multicenter, observational study aimed at identifying biomarkers of graft outcomes in a representative cohort of American kidney transplant recipients.11 Therefore, our finding that TEXH significantly increase after transplant in subjects induced with ATG and correlate with kidney transplant outcomes seems generalizable to real-life populations of standard-risk kidney transplant recipients. While the validation set using samples from CTOT-19 supports the conclusion that TEXH is associated with better outcomes, the fact that CTOT-19 is ongoing prevents us from determining the impact of TNFα blockade on the development of TEXH (a goal to be addressed once the study is complete).
Limitations of our work include the relatively small sample size and the fact that we cannot test alloantigen specificity of TEXH cells. However, the numbers of subjects included in the CyTOF analyses are in line with those used in similar successful CyTOF studies.44–46 While the associations between TEXH percentages and graft outcomes support the idea that these cells include donor-specific ones, future studies will formally test donor-specificity of TEXH emerging after transplant.
Cryopreservation of CTOT-01 samples may have had some impact on cell population recovery and marker expression. However, CyTOF analysis with cryopreserved cells allows barcoding and simultaneous batched analysis of all associated timepoints, thereby minimizing potential technical variation and facilitating accurate detection of small changes in marker expression over time. Importantly, analyses on CTOT-19 samples were performed on freshly isolated cells and confirmed CyTOF findings on frozen cells.
In conclusion, our data support the concept that development of TEXH associate with better post-transplant outcomes and suggest that one mechanism through which ATG improves outcomes is through augmentation of TEXH. In addition to identifying a potential risk stratifying peripheral blood biomarker in transplant recipients, our work supports the need for developing strategies that promote TEXH to improve outcomes following kidney transplantation.
METHODS
Subjects and sample collection
We performed CyTOF analyses on frozen peripheral blood mononuclear cells (PBMC) serially collected before transplant, and 3- and 6-months post-transplant from 26 subjects who participated in the prospective, multicenter observational CTOT-01 trial conducted from 2006 to 2013.47 Among the data collected as part of this study are clinical/epidemiological characteristics of donor and recipient, and recipient CD4+ T cell ATP production as assessed by the Immuknow® assay (Cylex, Inc., Columbia, MD, USA).25
We performed flow cytometry analyses on PBMC collected pre-transplant and at 6-month post-transplant from 50 subjects enrolled in the ongoing multicenter CTOT-19 trial (NCT02495077). In CTOT-19, recipients of deceased donor kidneys with Kidney Donor Profile Index (KDPI) scores 20–90% were treated with ATG induction and randomized to receive a single intraoperative infusion of anti-TNFα mAb (infliximab/Remicade) or saline. Maintenance consisted of tacrolimus, MMF and prednisone. Subject study arm remained blinded for the TEXH analysis. GFR was estimated by MDRD formula.48
The CTOT-01 and CTOT-19 studies were approved by institutional review boards at the participating centers.
CyTOF Sample Preparation
To limit batch effect, we barcoded samples collected from the same subjects at three different time points (0, 3 and 6 months post-transplant) with anti-CD45 antibodies conjugated to unique metal isotopes before pooling the samples together. CyTOF sample preparation was conducted as previously reported by others.46 Antibodies were either purchased pre-conjugated from Fluidigm (formerly DVS Sciences) or purchased purified and conjugated in-house using MaxPar X8 Polymer Kits (Fluidigm) according to the manufacturer’s instructions. 78 Samples (26 subjects, 3 time points) were processed in three separate batches barcoded using 3 barcoding antibodies and pooled together (Figure 1). All PBMC were stained with a panel of 35 antibodies (34 for clustering, 1 for viability), that included 5 antibodies previously associated with TEXH (Supplementary Table 1).
CyTOF Data Acquisition
CyTOF data was acquired at Icahn School of Medicine at Mount Sinai as previously reported by others.46 Samples were acquired on a CyTOF2 (Fluidigm) equipped with a SuperSampler fluidics system (Victorian Airships) at a concentration of 1 million cells/ml in deionized water containing a 1/20 dilution of EQ 4 Element Beads (Fluidigm) and at an event rate of <500 events/second. After acquisition, the data were normalized using bead-based normalization in the CyTOF software. Barcodes were demultiplexed using the Fluidigm debarcoding software. The data were gated to exclude residual normalization beads, debris, dead cells and doublets, leaving live CD45+ events for subsequent clustering and high-dimensional analyses.
CyTOF Data Analysis
We first clustered cells using the Phenograph algorithm49 and we then curated the 20 metaclusters obtained. The frequencies for each common population were obtained by summation of the frequencies in each metacluster and subsequently debarcoded to obtain frequencies for each time point and patient. In order to minimize variability in measurement, our analysis strategy was structured as follows:
Application of Phenograph to computationally-pooled samples: we pooled in silico all labeled cells from all time points together for each patient to analyze the major immune compartments (10,000 cells per time point for a total of 30,000 cells per patient), we applied Phenograph, and then demultiplexed them. This allowed to map the same subsets in all the samples.
Equal contribution of the samples: to avoid bias in Phenograph for the subsets present in the samples with a greater number of CD4+ or CD8+ we maintained an equal contribution in the number of cells from every sample determined by the sample with the lowest number of CD4+ or CD8+ T cells.
Reiteration: to increase power of the analyses for the cell subsets with low number of events, we reiterated the entirety of the sampling process and Phenograph clustering up to 10 times to achieve robustness in the results.
Through our strategy, we effectively analyzed 100,000 cells per sample, including at least 3,850 total CD4+ T cells and CD8+ T cells, and at least 193–385 CD4+ or CD8+ TEXH cells per sample. Despite the level of stringency imposed by the repeated sampling and clustering process (up to 10 times), we observed little dispersion in the results indicating that our findings were robust.
We did not observe significant differences in the average and standard deviation of the signal for each marker nor in the frequencies of the major immune compartments across batches.
CD4+ ATP production and Interstitial Fibrosis Measurements
In CTOT-01 subjects, ATP production in total CD4+ T cells was initially quantified by ImmuKnow®.26, 28 In a subset of CTOT-01 subjects, we flow-sorted CD4+PD-1+CD57− and CD4+PD-1− T cells and quantified ATP production by a luciferase driven bioluminescence assay with the ATP Bioluminescence Assay Kit HS II (Roche).
Allograft surveillance biopsies were obtained in CTOT-01 at implantation and at 6 months after transplant, were read by a central pathology core laboratory (Banff 2010 criteria),50 and graft fibrosis was quantified by morphometric analysis of Sirius red stained slides. Results were reported via a central electronic database.
Flow cytometry
We performed surface staining of freshly isolated PBMC from CTOT-19 study as published.51 Anti-human antibodies included: FITC-anti-CD4 (clone: RPA-T4; BD Biosciences), APC-anti-CD3 (clone UCHT1 BD Bioscience), BV510-anti-CD8 (clone RPA-T8; BD Biosciences), BV421-anti-CD8 (clone RPA-T8; BD Biosciences), APCCy7-anti-PD-1 (clone EH12.2H7; Biolegend), PercP-Cy5.5-anti-CD57 (clone HNK-1: Biolegend). To measure intracellular cytokines, PBMC were stimulated for 4 hours at 37°C with phorbol myristate acetate (PMA; 100 ng/ml, Sigma-Aldrich) and ionomycin (100 ng/ml, Calbiochem, Millipore) in the presence of GolgiStop (BD Biosciences). Fixation and permeabilization were performed using Cell Fixation & Cell Permeabilization Kit (Thermofisher), followed by staining with the appropriate antibodies, including PacBlue-Anti-TNF-α (clone Mab11; Biolegend), PE-Cy7-anti-IL-2 (clone MQI-17H12; BD Biosciences), PE-Cy7-anti-IFN-γ (clone B27; BD Biosciences).
Data were acquired (> 1×10⁶ events) on a three–laser Canto II flow cytometer (BD Biosciences) and analyzed using FlowJo® software. Flow sorting was performed with Cell Sorter SH800Z (SONY).
Statistics
Statistical significance was determined by GraphPad Prism or R. Statistical tests used are reported in the figure legends. Comparisons between depleting and non-depleting groups at the same time point were performed by unpaired t-tests. Comparisons between baseline and three months were made using paired t-tests. Correlations were determined by Pearson correlation. Differences are considered significant at p≤0.05.
Supplementary Material
Supplementary Figure S1 Changes in dendritic, NK, B , and CD8+ T cell subsets post-transplant based on induction Graphs depicting the evolution over time of the percentages of NK, B , and CD8+ T cell subsets post-transplant in patients that received depleting (n=10 patients) and non-depleting (n=16) induction therapy. Bar plots depict mean ± SEM. No comparisons were significant. Data points are depicted as mean ± SEM.
Supplementary Figure S2. Monocytes increase post-transplant. (A) Heatmap corresponding to the unbiased clustering (Phenograph) of the monocyte compartment (Figure 2) using CD14+, CD16+ and HLADR as markers. (B) Percentages of monocyte subsets based on the summation of Phenograph clusters (see Methods, n=26 patients). **p<0.01 by paired t-test. Bar plots depict mean ± SD. (C) Graphs depicting the evolution over time of the percentages of monocyte subsets in patients that received depleting (n=10 patients) and non-depleting (n=16 patients) induction therapy Comparisons between depleting and non-depleting groups at the same time point by unpaired t-test (* p<0.05) and with baseline for each group by paired t-test (▲p<0.05). Data points are depicted as mean ± SEM.
Supplementary Figure S3. Comparison of CD4+ T cell percentages between CyTOF and Flow Cytometry. (A) Percentages of CD4+ T cells in patients receiving depleting or nondepleting induction therapy. Data points are depicted as mean ± SEM (B) Correlation between CD4+ T cell percentages obtained by CyTOF and those obtained by flow cytometry for the same samples (Pearson correlation, n=69). (C) CD4+ T cells measured by flow cytometry in the entire cohort of CTOT-01 patients (grey dots; n=173 samples) receiving depleting induction compared with the average of CD4+ T cells obtained by CyTOF in the subjects included in the present study. **p<0.01, ***p<0.001 by unpaired t-test. Red bars show mean values of flow cytometry measurements of all CT0T01 participants; error bars depict SD.
Supplementary Figure S4. Changes in CD4+ T cell subsets post-transplant based on induction. Graphs depicting the evolution over time of the percentages of CD4+ T cell subsets post-transplant in patients that received depleting (n=10 patients) and non-depleting (n=16) induction therapy. Bar plots depict mean ± SEM. Comparisons between depleting and non-depleting groups at the same time point by unpaired t-test (*p<0.05, ** p<0.01, *** p<0.001) and with baseline for each group by paired t-test (▲p<0.05). Data points are depicted as mean ± SEM.
Supplementary Figure 5. Changes in CD8+ T cell subsets post-transplant based on induction Graphs depicting the evolution over time of the percentages of CD8+ T cell subsets post-transplant in patients that received depleting (n=10 patients) and non-depleting (n=16) induction therapy. Data points are depicted as mean ± SEM. No comparisons were significant.
Supplementary Table 1. CyTOF Markers
Supplementary Table 2. Characteristic markers for CD4+ and CD8+ T cell clusters
ACKNOWLEDGEMENTS
This work was supported by National Institutes of Health (NIAID) U01 AI63594 awarded to PSH and an ancillary mechanistic grant associated with U01 AI63594 awarded to PC. BEB was supported by the National Institute of Allergy And Infectious Diseases of the National Institutes of Health under Award Number UM1AI109565. MF was supported by U19 AI106754. The content is solely the responsibility of the authors and does not necessarily represent the official views of the National Institutes of Health.
The authors sincerely thank the CTOT-01 investigators and staff11 and the CTOT-19 site investigators and staff for their efforts, the latter including D Brennan (Johns Hopkins, Baltimore MD), J Bromberg (U Maryland, Baltimore MD), S Bunnapradist (U of California at Los Angeles, Los Angeles CA), Sindhu Chandra and Flavio Vincenti (U. California at San Francisco, San Francisco, CA), D Foley (U Wisconsin, Madison WI), R Formica (Yale University, New Haven CT), I Gibson, P Nickerson, D. Rush (U Manitoba, Winnipeg Manitoba, Canada), D Hricik (University Hospitals Cleveland Medical Center, Cleveland OH), R Mannon (U Alabama at Birmingham, Birmingham AL), J Kim and K Tinckam (U Toronto, Toronto Canada), M. Menon, B Murphy and S Florman (Mount Sinai Hospital, NY, NY), K Newell (Emory U. Atlanta GA), E Poggio (Cleveland Clinic, Cleveland OH), M Samaniego and R Sung (U Michigan, Ann Arbor MI).
Footnotes
Publisher's Disclaimer: This is a PDF file of an unedited manuscript that has been accepted for publication. As a service to our customers we are providing this early version of the manuscript. The manuscript will undergo copyediting, typesetting, and review of the resulting proof before it is published in its final citable form. Please note that during the production process errors may be discovered which could affect the content, and all legal disclaimers that apply to the journal pertain.
DISCLOSURE
All the authors declared no competing interests.
Supplementary information is available at Kidney International’s website.
REFERENCES
- 1.Zajac AJ, Blattman JN, Murali-Krishna K, et al. Viral immune evasion due to persistence of activated T cells without effector function. J Exp Med 1998; 188: 2205–2213. [DOI] [PMC free article] [PubMed] [Google Scholar]
- 2.Zinkernagel RM. Immunology taught by viruses. Science 1996; 271: 173–178. [DOI] [PubMed] [Google Scholar]
- 3.Wherry EJ, Kurachi M. Molecular and cellular insights into T cell exhaustion. Nat Rev Immunol 2015; 15: 486–499. [DOI] [PMC free article] [PubMed] [Google Scholar]
- 4.Gallimore A, Glithero A, Godkin A, et al. Induction and exhaustion of lymphocytic choriomeningitis virus-specific cytotoxic T lymphocytes visualized using soluble tetrameric major histocompatibility complex class I-peptide complexes. J Exp Med 1998; 187: 1383–1393. [DOI] [PMC free article] [PubMed] [Google Scholar]
- 5.Pauken KE, Wherry EJ. Overcoming T cell exhaustion in infection and cancer. Trends Immunol 2015; 36: 265–276. [DOI] [PMC free article] [PubMed] [Google Scholar]
- 6.Jiang Y, Li Y, Zhu B. T-cell exhaustion in the tumor microenvironment. Cell Death Dis 2015; 6: e1792. [DOI] [PMC free article] [PubMed] [Google Scholar]
- 7.Chang K, Svabek C, Vazquez-Guillamet C, et al. Targeting the programmed cell death 1: programmed cell death ligand 1 pathway reverses T cell exhaustion in patients with sepsis. Crit Care 2014; 18: R3. [DOI] [PMC free article] [PubMed] [Google Scholar]
- 8.Thorp EB, Stehlik C, Ansari MJ. T-cell exhaustion in allograft rejection and tolerance. Curr Opin Organ Transplant 2015; 20: 37–42. [DOI] [PMC free article] [PubMed] [Google Scholar]
- 9.Sanchez-Fueyo A, Markmann JF. Immune Exhaustion and Transplantation. Am J Transplant 2016; 16: 1953–1957. [DOI] [PubMed] [Google Scholar]
- 10.Starzl TE, Zinkernagel RM. Antigen localization and migration in immunity and tolerance. N Engl J Med 1998; 339: 1905–1913. [DOI] [PMC free article] [PubMed] [Google Scholar]
- 11.Hricik DE, Nickerson P, Formica RN, et al. Multicenter validation of urinary CXCL9 as a risk-stratifying biomarker for kidney transplant injury. Am J Transplant 2013; 13: 2634–2644. [DOI] [PMC free article] [PubMed] [Google Scholar]
- 12.Levine JH, Simonds EF, Bendall SC, et al. Data-Driven Phenotypic Dissection of AML Reveals Progenitor-like Cells that Correlate with Prognosis. Cell 2015; 162: 184–197. [DOI] [PMC free article] [PubMed] [Google Scholar]
- 13.Amir el AD, Davis KL, Tadmor MD, et al. viSNE enables visualization of high dimensional single-cell data and reveals phenotypic heterogeneity of leukemia. Nat Biotechnol 2013; 31: 545–552. [DOI] [PMC free article] [PubMed] [Google Scholar]
- 14.Karnell FG, Lin D, Motley S, et al. Reconstitution of immune cell populations in multiple sclerosis patients after autologous stem cell transplantation. Clin Exp Immunol 2017; 189: 268–278. [DOI] [PMC free article] [PubMed] [Google Scholar]
- 15.Rivino L, Le Bert N, Gill US, et al. Hepatitis B virus-specific T cells associate with viral control upon nucleos(t)ide-analogue therapy discontinuation. J Clin Invest 2018; 128: 668–681. [DOI] [PMC free article] [PubMed] [Google Scholar]
- 16.Crespo J, Sun H, Welling TH, et al. T cell anergy, exhaustion, senescence, and stemness in the tumor microenvironment. Curr Opin Immunol 2013; 25: 214–221. [DOI] [PMC free article] [PubMed] [Google Scholar]
- 17.Rudd CE, Taylor A, Schneider H. CD28 and CTLA-4 coreceptor expression and signal transduction. Immunol Rev 2009; 229: 12–26. [DOI] [PMC free article] [PubMed] [Google Scholar]
- 18.Dolfi DV, Mansfield KD, Polley AM, et al. Increased T-bet is associated with senescence of influenza virus-specific CD8 T cells in aged humans. J Leukoc Biol 2013; 93: 825–836. [DOI] [PMC free article] [PubMed] [Google Scholar]
- 19.Brenchley JM, Karandikar NJ, Betts MR, et al. Expression of CD57 defines replicative senescence and antigen-induced apoptotic death of CD8+ T cells. Blood 2003; 101: 2711–2720. [DOI] [PubMed] [Google Scholar]
- 20.Blackburn SD, Shin H, Haining WN, et al. Coregulation of CD8+ T cell exhaustion by multiple inhibitory receptors during chronic viral infection. Nat Immunol 2009; 10: 29–37. [DOI] [PMC free article] [PubMed] [Google Scholar]
- 21.Baitsch L, Baumgaertner P, Devevre E, et al. Exhaustion of tumor-specific CD8(+) T cells in metastases from melanoma patients. J Clin Invest 2011; 121: 2350–2360. [DOI] [PMC free article] [PubMed] [Google Scholar]
- 22.Chew GM, Fujita T, Webb GM, et al. TIGIT Marks Exhausted T Cells, Correlates with Disease Progression, and Serves as a Target for Immune Restoration in HIV and SIV Infection. PLoS Pathog 2016; 12: e1005349. [DOI] [PMC free article] [PubMed] [Google Scholar]
- 23.Long AH, Haso WM, Shern JF, et al. 4–1BB costimulation ameliorates T cell exhaustion induced by tonic signaling of chimeric antigen receptors. Nat Med 2015; 21: 581–590. [DOI] [PMC free article] [PubMed] [Google Scholar]
- 24.Schurich A, Pallett LJ, Jajbhay D, et al. Distinct Metabolic Requirements of Exhausted and Functional Virus-Specific CD8 T Cells in the Same Host. Cell Rep 2016; 16: 1243–1252. [DOI] [PMC free article] [PubMed] [Google Scholar]
- 25.Zeevi A, Lunz J. Cylex ImmuKnow Cell Function Assay. Methods Mol Biol 2013; 1034: 343–351. [DOI] [PubMed] [Google Scholar]
- 26.Kowalski RJ, Post DR, Mannon RB, et al. Assessing relative risks of infection and rejection: a meta-analysis using an immune function assay. Transplantation 2006; 82: 663–668. [DOI] [PubMed] [Google Scholar]
- 27.Hooper E, Hawkins DM, Kowalski RJ, et al. Establishing pediatric immune response zones using the Cylex ImmuKnow assay. Clin Transplant 2005; 19: 834–839. [DOI] [PubMed] [Google Scholar]
- 28.Kowalski R, Post D, Schneider MC, et al. Immune cell function testing: an adjunct to therapeutic drug monitoring in transplant patient management. Clin Transplant 2003; 17: 77–88. [DOI] [PubMed] [Google Scholar]
- 29.McKinney EF, Lee JC, Jayne DR, et al. T-cell exhaustion, co-stimulation and clinical outcome in autoimmunity and infection. Nature 2015; 523: 612–616. [DOI] [PMC free article] [PubMed] [Google Scholar]
- 30.Aznar MA, Labiano S, Diaz-Lagares A, et al. CD137 (4–1BB) Costimulation Modifies DNA Methylation in CD8(+) T Cell-Relevant Genes. Cancer Immunol Res 2018; 6: 69–78. [DOI] [PubMed] [Google Scholar]
- 31.Ngiow SF, Teng MW, Smyth MJ. Prospects for TIM3-Targeted Antitumor Immunotherapy. Cancer Res 2011; 71: 6567–6571. [DOI] [PubMed] [Google Scholar]
- 32.Gurkan S, Luan Y, Dhillon N, et al. Immune reconstitution following rabbit antithymocyte globulin. Am J Transplant 2010; 10: 2132–2141. [DOI] [PMC free article] [PubMed] [Google Scholar]
- 33.Sun J, Sheil AG, Wang C, et al. Tolerance to rat liver allografts: IV. Acceptance depends on the quantity of donor tissue and on donor leukocytes. Transplantation 1996; 62: 1725–1730. [DOI] [PubMed] [Google Scholar]
- 34.Remuzzi G, Cravedi P, Perna A, et al. Long-term outcome of renal transplantation from older donors. N Engl J Med 2006; 354: 343–352. [DOI] [PubMed] [Google Scholar]
- 35.Sarraj B, Ye J, Akl AI, et al. Impaired selectin-dependent leukocyte recruitment induces T-cell exhaustion and prevents chronic allograft vasculopathy and rejection. Proc Natl Acad Sci U S A 2014; 111: 12145–12150. [DOI] [PMC free article] [PubMed] [Google Scholar]
- 36.Lee PP, Yee C, Savage PA, et al. Characterization of circulating T cells specific for tumor-associated antigens in melanoma patients. Nat Med 1999; 5: 677–685. [DOI] [PubMed] [Google Scholar]
- 37.Goepfert PA, Bansal A, Edwards BH, et al. A significant number of human immunodeficiency virus epitope-specific cytotoxic T lymphocytes detected by tetramer binding do not produce gamma interferon. J Virol 2000; 74: 10249–10255. [DOI] [PMC free article] [PubMed] [Google Scholar]
- 38.Kostense S, Ogg GS, Manting EH, et al. High viral burden in the presence of major HIV-specific CD8(+) T cell expansions: evidence for impaired CTL effector function. Eur J Immunol 2001; 31: 677–686. [DOI] [PubMed] [Google Scholar]
- 39.Lipson EJ, Bagnasco SM, Moore J Jr., et al. Tumor Regression and Allograft Rejection after Administration of Anti-PD-1. N Engl J Med 2016; 374: 896–898. [DOI] [PMC free article] [PubMed] [Google Scholar]
- 40.Arruda LCM, Lima-Junior JR, Clave E, et al. Homeostatic proliferation leads to telomere attrition and increased PD-1 expression after autologous hematopoietic SCT for systemic sclerosis. Bone Marrow Transplant 2018. [DOI] [PubMed] [Google Scholar]
- 41.Brennan DC, Daller JA, Lake KD, et al. Rabbit antithymocyte globulin versus basiliximab in renal transplantation. N Engl J Med 2006; 355: 1967–1977. [DOI] [PubMed] [Google Scholar]
- 42.Opelz G, Naujokat C, Daniel V, et al. Disassociation between risk of graft loss and risk of non-Hodgkin lymphoma with induction agents in renal transplant recipients. Transplantation 2006; 81: 1227–1233. [DOI] [PubMed] [Google Scholar]
- 43.Reinsmoen NL, Cornett KM, Kloehn R, et al. Pretransplant donor-specific and non-specific immune parameters associated with early acute rejection. Transplantation 2008; 85: 462–470. [DOI] [PubMed] [Google Scholar]
- 44.Morrell ED, Wiedeman A, Long SA, et al. Cytometry TOF identifies alveolar macrophage subtypes in acute respiratory distress syndrome. JCI Insight 2018; 3. [DOI] [PMC free article] [PubMed] [Google Scholar]
- 45.Cader FZ, Schackmann RCJ, Hu X, et al. Mass cytometry of Hodgkin lymphoma reveals a CD4(+) regulatory T-cell-rich and exhausted T-effector microenvironment. Blood 2018; 132: 825–836. [DOI] [PMC free article] [PubMed] [Google Scholar]
- 46.Lavin Y, Kobayashi S, Leader A, et al. Innate Immune Landscape in Early Lung Adenocarcinoma by Paired Single-Cell Analyses. Cell 2017; 169: 750–765 e717. [DOI] [PMC free article] [PubMed] [Google Scholar]
- 47.Hricik DE, Augustine J, Nickerson P, et al. Interferon Gamma ELISPOT Testing as a Risk-Stratifying Biomarker for Kidney Transplant Injury: Results From the CTOT-01 Multicenter Study. Am J Transplant 2015; 15: 3166–3173. [DOI] [PMC free article] [PubMed] [Google Scholar]
- 48.Levey AS, Coresh J, Greene T, et al. Using standardized serum creatinine values in the modification of diet in renal disease study equation for estimating glomerular filtration rate. Ann Intern Med 2006; 145: 247–254. [DOI] [PubMed] [Google Scholar]
- 49.DiGiuseppe JA, Cardinali JL, Rezuke WN, et al. PhenoGraph and viSNE facilitate the identification of abnormal T-cell populations in routine clinical flow cytometric data. Cytometry B Clin Cytom 2017. [DOI] [PMC free article] [PubMed] [Google Scholar]
- 50.Sis B, Mengel M, Haas M, et al. Banff ‘09 meeting report: antibody mediated graft deterioration and implementation of Banff working groups. Am J Transplant 2010; 10: 464–471. [DOI] [PubMed] [Google Scholar]
- 51.Purroy C, Fairchild RL, Tanaka T, et al. Erythropoietin Receptor-Mediated Molecular Crosstalk Promotes T Cell Immunoregulation and Transplant Survival. J Am Soc Nephrol 2017; 28: 2377–2392. [DOI] [PMC free article] [PubMed] [Google Scholar]
Associated Data
This section collects any data citations, data availability statements, or supplementary materials included in this article.
Supplementary Materials
Supplementary Figure S1 Changes in dendritic, NK, B , and CD8+ T cell subsets post-transplant based on induction Graphs depicting the evolution over time of the percentages of NK, B , and CD8+ T cell subsets post-transplant in patients that received depleting (n=10 patients) and non-depleting (n=16) induction therapy. Bar plots depict mean ± SEM. No comparisons were significant. Data points are depicted as mean ± SEM.
Supplementary Figure S2. Monocytes increase post-transplant. (A) Heatmap corresponding to the unbiased clustering (Phenograph) of the monocyte compartment (Figure 2) using CD14+, CD16+ and HLADR as markers. (B) Percentages of monocyte subsets based on the summation of Phenograph clusters (see Methods, n=26 patients). **p<0.01 by paired t-test. Bar plots depict mean ± SD. (C) Graphs depicting the evolution over time of the percentages of monocyte subsets in patients that received depleting (n=10 patients) and non-depleting (n=16 patients) induction therapy Comparisons between depleting and non-depleting groups at the same time point by unpaired t-test (* p<0.05) and with baseline for each group by paired t-test (▲p<0.05). Data points are depicted as mean ± SEM.
Supplementary Figure S3. Comparison of CD4+ T cell percentages between CyTOF and Flow Cytometry. (A) Percentages of CD4+ T cells in patients receiving depleting or nondepleting induction therapy. Data points are depicted as mean ± SEM (B) Correlation between CD4+ T cell percentages obtained by CyTOF and those obtained by flow cytometry for the same samples (Pearson correlation, n=69). (C) CD4+ T cells measured by flow cytometry in the entire cohort of CTOT-01 patients (grey dots; n=173 samples) receiving depleting induction compared with the average of CD4+ T cells obtained by CyTOF in the subjects included in the present study. **p<0.01, ***p<0.001 by unpaired t-test. Red bars show mean values of flow cytometry measurements of all CT0T01 participants; error bars depict SD.
Supplementary Figure S4. Changes in CD4+ T cell subsets post-transplant based on induction. Graphs depicting the evolution over time of the percentages of CD4+ T cell subsets post-transplant in patients that received depleting (n=10 patients) and non-depleting (n=16) induction therapy. Bar plots depict mean ± SEM. Comparisons between depleting and non-depleting groups at the same time point by unpaired t-test (*p<0.05, ** p<0.01, *** p<0.001) and with baseline for each group by paired t-test (▲p<0.05). Data points are depicted as mean ± SEM.
Supplementary Figure 5. Changes in CD8+ T cell subsets post-transplant based on induction Graphs depicting the evolution over time of the percentages of CD8+ T cell subsets post-transplant in patients that received depleting (n=10 patients) and non-depleting (n=16) induction therapy. Data points are depicted as mean ± SEM. No comparisons were significant.
Supplementary Table 1. CyTOF Markers
Supplementary Table 2. Characteristic markers for CD4+ and CD8+ T cell clusters


