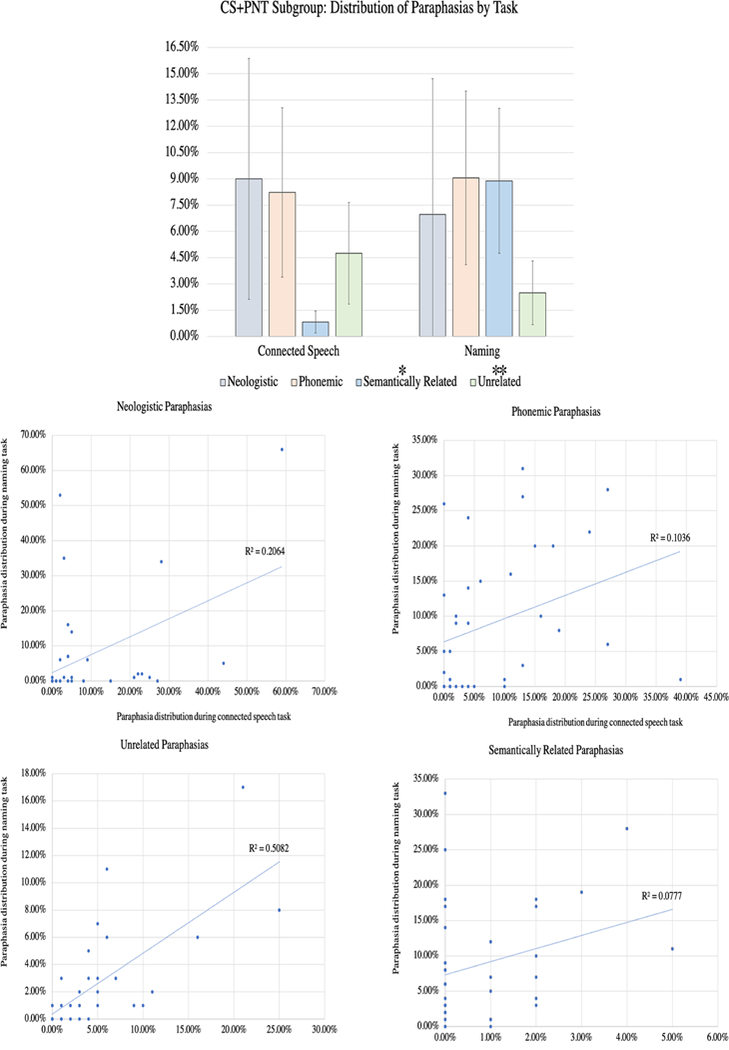
Figure 3: Distribution of paraphasia types produced during connected speech and naming.

This figure directly compares the distribution of paraphasia types in the CS+PNT subgroup (N=36), the members of which completed both a connected speech and naming task. The top figure demonstrates the relative distribution of each paraphasia type by task. Multinomial logistic regression indicated that the semantically related and unrelated paraphasia types were significantly different between the tasks, and this is marked with a * (p<0.05) or ** (p<0.01) above the paraphasia name in the legend. The scatterplots (bottom) contrast the distribution during naming (y axis) and connected speech (x axis) for each paraphasia type.
