Abstract.
Dynamic elastography is an attractive method to evaluate tissue biomechanical properties. Recently, it was extended from US- and MR-based modalities to optical ones, such as optical coherence tomography for three-dimensional (3-D) imaging of propagating mechanical waves in subsurface regions of soft tissues, such as the eye. The measured group velocity is often used to convert wave speed maps into 3-D images of the elastic modulus distribution based on the assumption of bulk shear waves. However, the specific geometry of OCE measurements in bounded materials such as the cornea and skin calls into question elasticity reconstruction assuming a simple relationship between group velocity and shear modulus. We show that in layered media the bulk shear wave assumption results in highly underestimated shear modulus reconstructions and significant structural artifacts in modulus images. We urge the OCE community to be careful in using the group velocity to evaluate tissue elasticity and to focus on developing robust reconstruction methods to accurately reconstruct images of the shear elastic modulus in bounded media.
Keywords: dynamic elastography, group velocity, optical coherence tomography, optical coherence elastography, tissue elasticity, shear modulus
1. Introduction
Mapping tissue mechanical properties, or elastography, has become an important medical imaging modality. There is a large body of work using different imaging systems, such as MRI and ultrasound, to track internal displacements and strains resulting from either external or internal mechanical loads to infer tissue mechanical properties.1–3
Recently, high-resolution optical coherence tomography (OCT) systems have been used for elastography with both static4 and dynamic5,6 loads. Although both load types can provide valuable information on tissue mechanical properties, dynamic elastography has a distinct advantage because quantitative elastic modulus maps can be obtained from local mechanical wave speed estimates for a wide range of practical operating conditions.5,6 Due to the very high line rates of spectral-domain (tens of kHz5–9) and swept-source OCT (a few MHz10–13), dynamic elastography can operate at sub-mm spatial resolution using pulsed, temporally compact mechanical waves. In other words, dynamic optical coherence elastography (OCE) can acquire snapshots of shear wave temporal profiles in soft tissues propagating with speed many times smaller (a few m/s typically) than the speed of sound.
OCE has been used to evaluate tissue biomechanics14 and, especially, in ophthalmology.5,6,8,15–19 Of particular note is dynamic OCE to map corneal elasticity using noncontact mechanical loads based on air-puffs6,8,11,20–22 or acoustic microtapping ().5,15,23
To date, dynamic OCE is primarily used to provide local elasticity information from estimates of the local group velocity5,6,9,15,20,24–28 of mechanical waves generated at the surface of the medium and propagating within that medium. Indeed, high quality two-dimensional (2-D) three-dimensional (3-D) maps of group velocity have been shown for the cornea using noncontact mechanical loads.5,6,15,24
The group velocity is often interpreted as being a direct measure of bulk shear wave speed , which leads to an estimate of the shear elastic modulus () using the simple relation
| (1) |
where is the material density. This is often the case for bulk mechanical waves produced in magnetic resonance elastography (MRE) and in ultrasound-based shear wave elastography, where the medium viscosity is negligible but is not the case in highly heterogeneous materials or in media greatly influenced by mechanical boundary conditions (i.e., heterogeneous and bounded media).
Here, we investigate how well group velocity images represent shear modulus information for the conditions typically encountered in dynamic OCE of the cornea assuming a purely elastic system (i.e., in the absence of viscosity). As will be demonstrated below, not only do shear modulus estimates derived from a simple assumption of bulk-waves differ greatly from the actual modulus but significant spatial features in group velocity images often interpreted as shear modulus heterogeneities are actually artifacts produced by wave propagation in a bounded medium.
2. Method
In this study, we performed both numerical simulations and experimental studies of mechanical wave propagation in bulk and bounded tissue-like phantoms with mechanical characteristics mimicking soft biological tissue in the purely elastic limit (i.e., the effects of viscosity are negligible).
2.1. Numerical Simulation
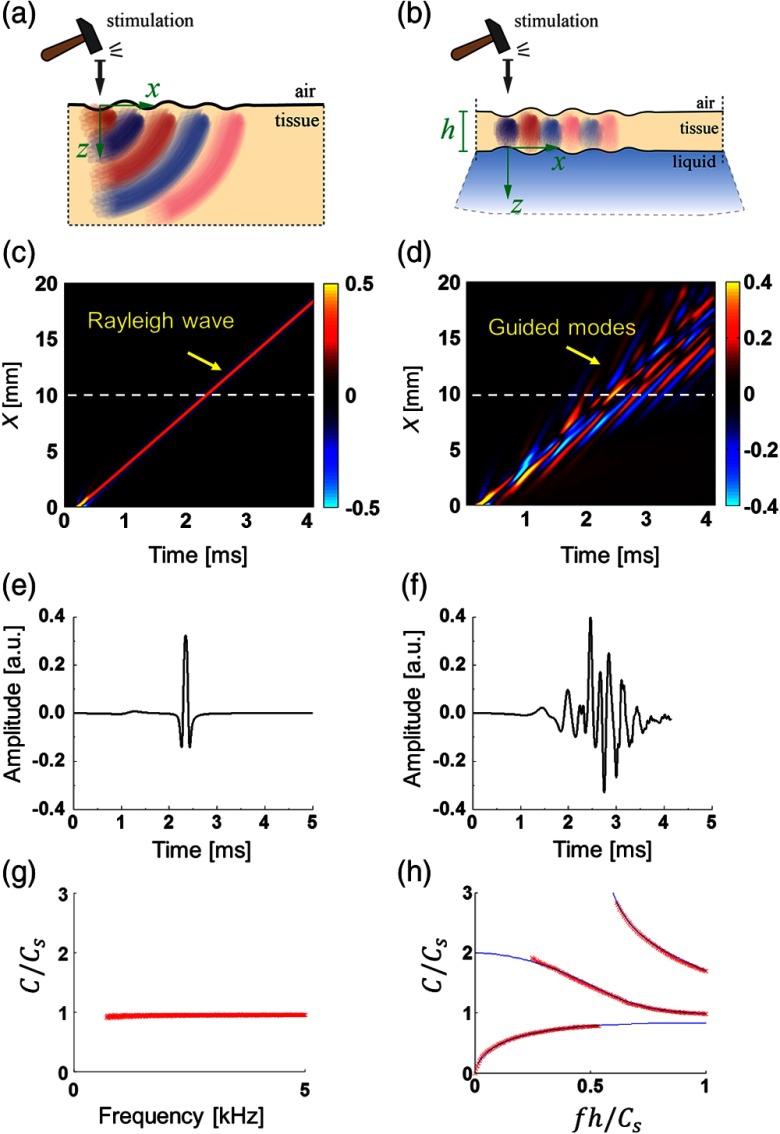
Numerical simulations were performed with a finite element method in OnScale (OnScale, Redwood City, California—formerly PZFlex). We extensively tested the OnScale solver for the propagation of mechanical waves in nearly incompressible linear elastic media to ensure that numerical solution is not corrupted by numerical dissipation or dispersion, a common characteristic of commercially available software packages. We summarize the simulation method and the medium geometry in Appendix A and also provide Video 1 showing Rayleigh wave propagation in a bulk medium [see Fig. 1(a)] versus guided waves in a 1-mm thick layer [Fig. 1(b)] with the same mechanical moduli but bounded with water on its bottom.
Fig. 1.
Mechanical waves in the subsurface region of a nearly incompressible linear elastic medium (mimicking soft tissue) simulated in OnScale. Spatial and temporal parameters of the push are and , respectively; shear wave speed is (). Left column: semi-infinite material with air at the upper boundary; and the right column: a 1-mm thick tissue layer bounded with a liquid from the bottom. (a), (b) Diagrams for wave excitation and propagation (taken from Ref. 5); (c), (d) wave fields (XT plots) along the medium surface displayed over an arbitrary dynamic range scaled to the signal maximum; (e), (f) temporal profiles of Rayleigh and guided waves at a 10-mm distance from the excitation point (shown with a white dashed line), respectively; and (g), (h) phase velocity dispersion plots for Rayleigh and guided waves, respectively: numerical simulation (red crosses) superimposed on the analytical solution (solid lines).5 Dynamic variations of the waveforms are presented in Video 1 (MP4, 498 MB [URL: https://doi.org/10.1117/1.JBO.24.7.076003.1]).
The shear wave speed was chosen in simulations to be (), typical for many soft tissues. To excite mechanical waves, a spatially and temporally compact force was applied to the medium with a Gaussian profile in space [characteristic width of Eq. (3) in Appendix A]; and a super Gaussian temporal profile with a characteristic time constant [see Eq. (4) in Appendix A]. These parameters are similar to those used in 5,15,23 experiments and define the shape and bandwidth of the Rayleigh wave. However, these simulation results are fully valid for any excitation method outside of the excitation zone.
In Fig. 1, the left column corresponds to the Rayleigh wave, and the column on the right corresponds to the guided wave. Figures 1(c) and 1(d) show XT plots of propagating Rayleigh versus guided waves along the surface of the medium. A horizontal slice of the XT plot (shown with a dashed white line) presents the temporal profile of the propagating signal for that spatial position at the medium surface ( from the excitation point) in Figs. 1(e) and 1(f), respectively.
As seen in Fig. 1(c) and 1(e), the temporal profile of the Rayleigh wave has a simple shape that does not change with distance outside the excitation zone. Thus, the cross-correlation coefficient between two signal profiles measured at different spatial positions along the surface will equal one, independent of where measurement points are taken. This means that cross-correlation-based calculation of the group velocity gives the same propagation speed over all positions. Because medium viscosity is omitted in our analysis, the calculated group velocity is equivalent to the phase velocity of the Rayleigh wave and, therefore, can be directly used for shear modulus calculation with Eq. (1), noting that the Rayleigh wave speed, , is related to the shear wave speed by a constant multiplicative factor of 0.955 in nearly incompressible materials such as soft tissue.5,25,29 Consequently, elasticity reconstruction based on the group velocity is accurate in this case.
If the medium is a layer bounded by water on its bottom [as shown in Fig. 1(b)], the signal shape is not preserved during propagation, showing dramatic perturbations of the signal temporal profile [see Fig. 1(d), 1(f), and Video 1] even if there is no viscosity. These effects result from highly dispersive guided modes [see Fig. 1(h)] that coexist and propagate along the medium surface instead of a simple nondispersive Rayleigh wave [Fig. 1(g)]. Note that analytical solutions to wave propagation for this case were reported previously and can be found in Ref. 5.
We used a 2-D Fourier transform to process signal wave fields (XT plots) in wavenumber and frequency coordinates30,31 and, finally, to compute phase velocity dispersion (phase velocity and frequency coordinates) from simulated data; results are superimposed on the analytical solution in Fig. 1(h).5 In general, calculating the group velocity of multimode motion does not produce quantitative elasticity estimates. Nevertheless, this method has been used to evaluate tissue elasticity through Eq. (1) in multiple studies.5,6,9,15,20,24–28 Here, we show that this approach results in poor shear modulus maps, both in terms of quantitative accuracy and the presence of image artifacts.
2.2. Tissue Mimicking Phantoms
Thin-plate polyvinyl alcohol (PVA)-based phantoms were created using protocols adapted from Ref. 32. PVA phantoms provide nearly pure elasticity, can be tuned to closely mimic the mechanical properties of soft tissue due to their extracellular matrix, and can be easily fabricated into thin plate shapes that serve the purpose of this study. They were made by first mixing 4:1 ratio dimethyl sulfoxide (DMSO, CAS: 67-68-5, EMD Millipore Corp.) into water using a stir plate. The phantom’s optical properties were tuned by introducing titanium dioxide nanoparticles. A concentrated stock solution of 0.3 wt. % titanium nanoparticles suspended in water was prepared, and a tip sonicator (Digital Sonifier 450, Branson, Danbury, Connecticut) was used for 3 min (30% duty cycle) at an amplitude of 30% to help disperse nanoparticles in solution.
The concentrated nanoparticle solution was then added to the DMSO solution to achieve a nanoparticle concentration of 0.025 wt. %. Two (2) wt. % PVA (146 to 186 kDa, hydrolyzed, CAS: 9002-89-5, Sigma-Aldrich) was then added to the solution. It was covered and stirred on a hot plate maintaining a temperature of 120°C for to dissolve the PVA. Once fully dissolved, the solution was degassed using a vacuum chamber to remove any bubbles before casting in molds and storing at for up to 12 h to solidify.
Multiple thin-plate phantoms were cast in circular molds with a diameter of 5 cm. The thickness was controlled by adding just enough molten PVA solution to cover the bottom of the mold and then rotating the mold to evenly distribute the solution. Multiple thin slabs were created and then physically sized using OCT structural imaging. Finally, casted, hardened phantoms were placed in a water bath. During this process, DMSO slowly diffused out of solution in exchange for water. The bath was regularly changed for a minimum of 48 h to remove all DMSO. Phantoms were stored in deionized water to prevent dehydration.
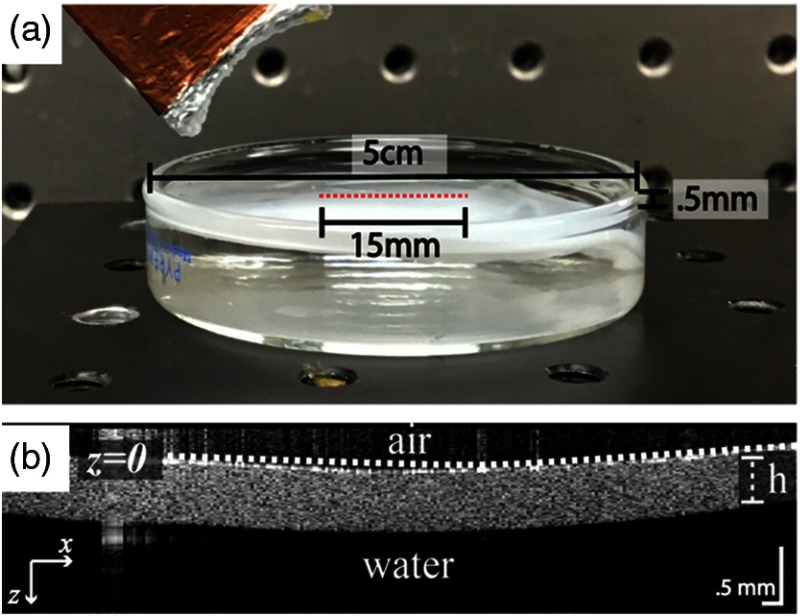
During imaging, the PVA phantom was suspended on top of water to force asymmetric boundary conditions and match the medium diagram used in numerical simulations (see Fig. 2). To estimate the true shear wave speed of the phantoms, we performed group velocity estimates at the surface of a separate thick layer (15 mm thick) phantom made using the same protocol. Note that in the case of a thick layer, dispersive guided wave modes do not develop and the group velocity provides an accurate estimate of the shear wave speed, in this case .
Fig. 2.
(a) Experimental setup showing a 0.5-mm-thick PVA phantom suspended on water boundary. An air-coupled transducer can be seen in the upper left. A red dotted line denotes an OCT B-scan line. (b) OCT structural image of thin-plate phantom. Note: uneven aspect ratio displayed to highlight phantom structure.
2.3. Experimental Setup
Elastic waves were tracked in the phantom using a phase-sensitive OCT (PhS-OCT) system operating in M-B mode, as detailed previously.5,9,23,33 The A-line rate of the system was 46.5 kHz, and the optical resolution was axially and laterally. Each M-scan consisted of 512 A-scans in the same location repeated at 256 locations (B-scans) horizontally across the imaging plane (), forming one complete M-B scan (1024 depth × 256 lateral locations × 512 frames) with an effective imaging range of (axial × lateral). The total acquisition time for one M-B scan was 3.66 s.
To generate quasiplanar guided waves, was used with a cylindrically focused air-coupled ultrasound (US) transducer.5,15,23 It was fixed at an angle (20 deg to 30 deg to vertical) normal to the phantom to avoid blocking the laser light from the OCT system, providing a push beam with dimensions of lateral and elevational. The push was applied for (same as in numerical simulation) and focused to the edge of the OCT imaging range.
Note that the push width of in the experiment is close to the minimum width that can be applied with our current air-coupled transducer tilted to the surface normal by . This value can be made smaller by positioning the transducer normal to the surface or by using a higher frequency ultrasound excitation. In one set of simulations, we intentionally used , i.e., twice narrower, to demonstrate the development of higher order guided modes.
2.4. Signal Processing
Similar to speckle tracking in ultrasound to detect shear waves,34,35 PhS-OCT can be used to detect motion by analyzing the differential signal between successive A-scans at a single location following an applied load.5,36–41 The displacement term is defined as the change in scatterer position between scans and is more appropriately reported by the depth-resolved vertical component (along ) of vibration speed:5,15,33
| (2) |
where is the scan rate, is the optical phase difference between successive scans, is the optical wavelength, and is the medium refractive index.
The vibration speed recorded at different time points in the imaging plane can be used to plot the mechanical wave field [see Figs. 1(c) and 1(d)] for a fixed depth position. A 2-D FFT was then applied30,31 to compute phase velocity dispersion curves [like those presented in Figs. 1(g) and 1(h)].
Group velocity maps in the plane were obtained with the correlation method described in detail in Refs. 5, 42, and 43. Finally, the average group velocity over the 2-D image was calculated.
3. Results
Using the numerical model, we first explore the effects of intrinsic (shear modulus) and extrinsic (geometry and mechanical wave bandwidth) parameters on group/phase velocity measurements and their relation to elasticity maps. To simplify the analysis, we assume infinite signal-to-noise ratio (SNR) with the goal of identifying key experimental parameters that produce the best quantitation of shear modulus and minimize artifacts in elasticity maps.
One of the important experimental parameters is the high frequency cutoff (or bandwidth) of propagating waves. Indeed, different excitation methods used in OCE produce different characteristic frequencies of generated mechanical waves. For example, air-puff techniques can generate broadband signals up to 400 Hz bandwidth. The newer technology can produce mechanical waves with significant components up to 8 kHz.15 Note that the high frequency cutoff in 5,15,23 depends mainly on the operating frequency of the driving air-coupled US transducer. Increasing the transducer carrier frequency can produce a much higher cutoff frequency, extending even to tens of kHz.
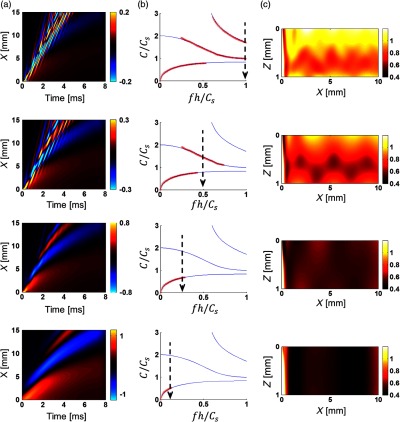
The main question here is how shear modulus estimates using Eq. (1) differ from actual material properties when tracking guided mechanical waves of different bandwidths. Figure 3 provides an answer for a specific illustrative example.
Fig. 3.
Mechanical wave propagation in a layer of nearly incompressible linear elastic medium bounded with water on the bottom [see Fig. 1(b)] simulated in OnScale. Spatial and temporal parameters of the push are and , respectively; shear wave speed is (); layer thickness is . (a) XT plots (wave fields) calculated along the tissue surface and obtained for different signal bandwidths () measured at cut-off so that (), respectively, for the rows from top to bottom. (b) The phase velocity dispersion computed from the wave fields of (a) red crosses, superimposed on the analytical solution5 (solid lines), respectively. (c) 2-D group velocity images normalized to the true shear wave speed (i.e., displayed value is 1 for a group velocity estimate equaling the true shear wave velocity) obtained for every point of the plane with the correlation method for the same values, respectively.
To properly analyze guided waves, the frequency should be scaled to the medium thickness and shear wave speed, as in the central column of Fig. 3. Indeed, geometric dispersion of the guided-wave phase velocity has a universal character when plotted in dimensionless coordinates. For example, can be obtained in multiple ways with different shear wave speed and medium thickness, yet the character of wave propagation will be the same for the same dimensionless frequency. This means that our analysis can be applied to a wide range of experimental conditions encountered in OCE.
Note that the large majority of prior experiments performed on the cornea, or other thin media such as the sclera and dermis, are over a range of smaller, or much smaller, than 1 (one). For example, a typical human cornea (thickness , ) probed over a 800-Hz bandwidth (typical for air puff20–22) would result in ; whereas a 5-kHz bandwidth for 5,15,23 results in .
To explore how the group velocity estimate depends on signal bandwidth (i.e., speed over a specific range on the dimensionless frequency scale), we applied a low-pass (LP) Gaussian filter to simulated data, artificially limiting the signal bandwidth. The filter cutoff frequency is indicated by a vertical dashed arrow in the central column of Fig. 3. For geometries without geometric dispersion (e.g., for Rayleigh wave propagation on a bulk material), the group velocity does not depend on signal bandwidth. For guided waves, it most certainly does.
The upper row of Fig. 3 presents the case where the signal spectrum is limited by . Here, a complicated wave field, shown in the left panel as the XT plot, produces (three propagating guided modes5,29 shown by red crosses in the phase velocity dispersion panel (central panel). The elasticity map in the right panel is produced by calculating the group velocity at every position in the medium and normalizing it to the true shear wave speed. Clearly, this image is very heterogeneous, with severe deviations from the true shear wave speed. These heterogeneities have nothing to do with intrinsic material parameters (the shear elastic modulus is constant within the bounded medium) and are artifacts. Their details are dominated by extrinsic parameters such as the medium thickness and signal bandwidth.
If the signal spectrum is limited by (see second row in Fig. 3), the XT plot dramatically changes and results in two guided modes and a totally different 2-D spatial distribution of estimated elasticity (again, not related to true medium elastic properties because the medium is homogeneous). This happens because limiting the signal bandwidth not only smooths the group velocity distribution but also affects the guided mode content that, in turn, creates a different group velocity structure.
Limiting the signal spectrum by (see third row in Fig. 3) results in a single propagating guided mode and further changes the XT plot and the 2-D distribution of estimated elasticity. Further narrowing the signal spectrum by (bottom row in Fig. 3) makes the 2-D group velocity distribution more homogeneous, but dramatically reduces the average group velocity relative to the true shear wave speed due to strong dispersion in the low range.
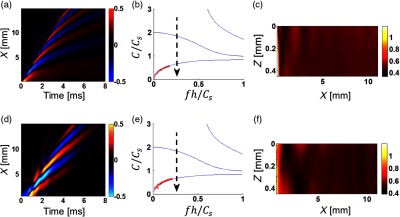
Experimental results shown in Figs. 4–6 show behavior similar to that of the simulations. To simplify the comparison, experimental results are split into three figures corresponding to a different range of dimensionless frequency and compared to numerical simulations in Onscale for the same medium parameters. The maximum value of the dimensionless bandwidth we could reach experimentally was and, thus, the upper row in Fig. 3 corresponding to is absent from the experimental study. The shear wave speed was measured to be for the bulk 15-mm thick sample using the group velocity method. The same speed was used to compute theoretical curves for phase velocity dispersion [solid blue lines in (b) and (e) in Figs. 4–6]. Note that the layer thickness measured with OCT structural imaging is (typical for human cornea), compared to 1 mm (close to that for porcine cornea) used to obtain Fig. 3.
Fig. 4.
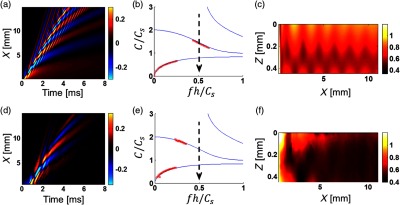
(d)–(f) Experimental study of mechanical wave propagation in a layer of PVA phantom (mimicking soft tissue) bounded with water on the bottom (see Fig. 2) is compared to numerical simulations in (a)–(c) OnScale for the same medium parameters. The dimensionless signal bandwidth (maximum achievable in the experiment). Spatial and temporal parameters of the push are and , respectively; the elastic modulus measured for a thick phantom is (shear wave speed ). The layer thickness was measured from the OCT structural image [Fig. 2(b)] to be . (a) An XT plot (wave field) calculated along the phantom surface. (b) The phase velocity dispersion computed from the wave field of (a) red crosses, superimposed on the analytical solution5 (solid lines), respectively. (c), (f) 2-D group velocity images normalized to the true shear wave speed (i.e., displayed value is 1 for a group velocity estimate equaling the true shear wave velocity) obtained for every point of the plane with the correlation method.
Fig. 5.
(d)–(f) Experimental study of mechanical wave propagation in a layer of PVA phantom (mimicking soft tissue) bounded with water on the bottom (see Fig. 2) is compared to numerical simulations in (a)–(c) OnScale for the same medium parameters. The dimensionless signal bandwidth . Medium parameters and spatial and temporal parameters of the push are the same as for Fig. 4.
Fig. 6.
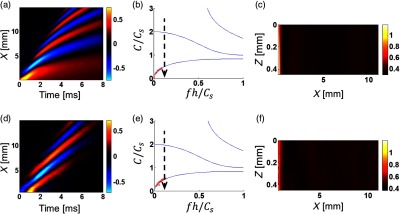
(d)–(f) Experimental study of mechanical wave propagation in a layer of PVA phantom (mimicking soft tissue) bounded with water on the bottom (see Fig. 2) is compared to numerical simulations in (a)–(c) OnScale for the same medium parameters. The dimensionless signal bandwidth . Medium parameters and spatial and temporal parameters of the push are the same as for Fig. 4.
Wave fields (XT plots) of propagating mechanical waves near the sample surface from experimental data are represented in (d) in Fig. 4–6 for different signal bandwidths. To reduce the signal bandwidth, LP filtering was applied to experimental data in the same way as described above. To improve SNR, measured wave fields were averaged in and with a 2-D Gaussian filter having kernel size corresponding to one-tenth (1/10) of the characteristic signal wavelength . They were then used to compute phase velocity dispersion via a 2-D Fourier transform [see red crosses in (e) in Fig. 4–6], which closely matches theoretical curves [see red crosses in (b) in Figs. 4–6].
To compare with experimental data, XT plots were also obtained from numerical simulations for the same medium parameters [(a) in Fig. 4–6]. Clearly, experimentally obtained wave fields match quite closely to numerically simulated ones. A little mismatch between (a) and (d) in Fig. 4 () is related to high-frequency attenuation of mechanical waves during propagation [high-frequency wave field “modulation” disappears at distances larger than from the source]. This behavior is clearly related with the medium viscosity not taken into account in simulations. On the other hand, for , i.e., for the narrowest bandwidth considered, the experimental wave field is affected by missing very low frequencies (below 100 Hz) due to high-pass filtration of experimental data to reduce environmental noise.
The 2-D group velocity images computed with experimental data [(f) in Figs. 4–6] and compared with numerically simulated [(c) in Figs. 4–6] show very strong variations in the plane. They are mostly due to multiple dispersive modes propagating in the bounded layer. Image artifacts depend on multiple parameters, such as signal bandwidth, layer thickness, shear wave speed, and the temporal profile of the excited mechanical wave. Note that in addition to structural artifacts, there is some high-frequency noise present in group velocity images [especially in Fig. 4(f)]. Because the signal shape changes drastically from point to point, quite a small kernel size (on the order of the spatial signal wavelength, ) was used to calculate the group velocity. In addition, structural artifacts are smoothed at distances larger than 5 mm for [Fig. 4(f)] due to medium viscosity limiting the signal bandwidth. The cross-correlation coefficient between signals was always better than 0.9. Further increasing the kernel size leads to signal decorrelation and, thus, reduces the accuracy of group velocity estimates. The 2-D group velocity images computed for [Fig. 5(f)] and for [Fig. 6(f)] closely match simulated images [Figs. 5(c) and 6(c) respectively] in most details.
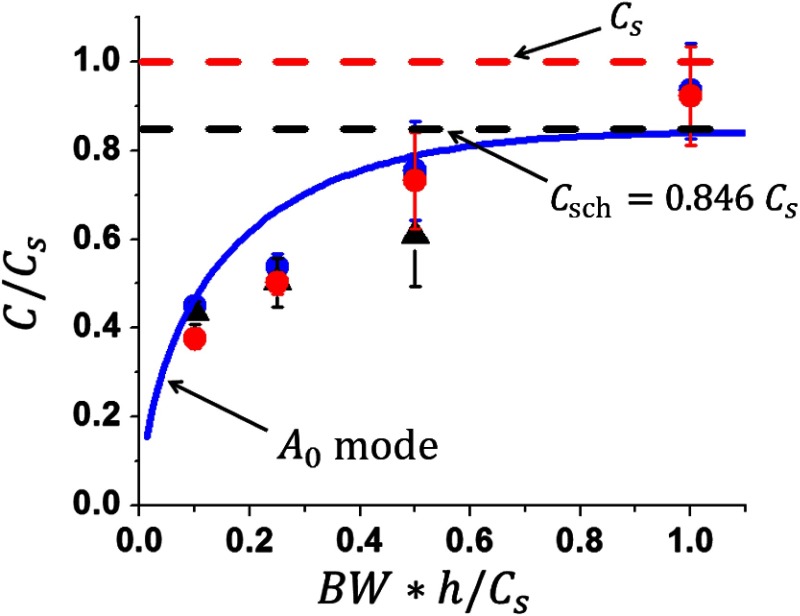
Figure 7 shows estimates of the group velocity averaged over the 2-D distributions (over area in case of a 1-mm thick medium and over for a 0.5-mm thick medium) shown in Figs. 3–6. The near field area (0.8 mm from the source) was excluded from group velocity averaging. Clearly, the broader the bandwidth, the closer the average group velocity is to the true shear wave speed (shown by a red dashed line in Fig. 7). However, broader bandwidths also yield higher variance, as evidenced by the artifacts seen in elasticity maps shown in Figs. 3 and 4. For significantly lower than 1, the group velocity estimate generally follows the dispersion curve for the guided mode of the lowest order, approaching zero in the limit of . We note that the high frequency asymptote for the lowest order mode is a Scholte wave having a propagation speed of . Both numerical simulations and experimental studies result in very similar average group velocity estimates (both being wrong) when the signal spectra are limited with the same even though the details of the measurements (e.g., medium thickness, excitation width, and shear wave speed) are different.
Fig. 7.
Mean value of group velocity as a function of signal bandwidth. Blue (obtained for a 1-mm thick medium) and red (obtained for a 0.5-mm thick medium) circular dots correspond to averaging over numerically simulated 2-D group velocity distributions [(c) in Fig. 3 and (c) in Figs. 4–6, respectively]. Black triangles correspond to averaging over experimentally obtained distributions [(f) in Figs. 4–6] for a 0.5-mm thick PVA sample. Solid blue line presents the dispersion curve for a guided mode of the lowest order (same as in Figs. 4–6). Dashed black line corresponds to the Scholte wave velocity asymptote for this mode (derived from Ref. 5 for an air/tissue/water system). Dashed red line corresponds to the true shear wave velocity. Error bars show variance of group velocity estimates in the plane.
4. Discussion and Conclusions
In this paper, we have analyzed the most common situation in dynamic OCE in which a high frame rate OCT system tracks propagating mechanical waves in soft tissue. We have confirmed that for a homogeneous bulk material, and negligibly small viscosity (no frequency dispersion in the phase velocity), the group velocity of Rayleigh waves propagating along the air/tissue interface is equal to its phase velocity and can, therefore, be used in Eq. (1) (noting that 5,29) to directly evaluate tissue elasticity.
For a bounded material [Figs. 1(b)], however, the situation is very different due to the tissue/liquid (or other) interfaces on wave propagation. This situation is exactly what OCE faces in evaluating corneal biomechanics and is very close to that for skin. In other words, when OCE is used to image layered tissue, multiple dispersive propagating modes should be expected.
As shown in Sec. 3, the group velocity estimate is quantitatively incorrect (due to multiple propagating guided modes), has strong artificial fluctuations in the plane (see images in right columns of Figs. 3–6), and the average value is highly underestimated due to a nearly linear reduction in velocity for the lower order mode in the low frequency limit.
Artifacts in group velocity images make it difficult to probe heterogeneous layered tissues because artificial spatial fluctuations in the group velocity cannot be distinguished from real structural heterogeneities in the elastic modulus. Furthermore, both artifacts in group velocity images and inaccurate group velocity average values are hard to predict and estimate in real experiments. The problem is that the position of the measurement point on the dispersion diagram versus (see central columns in Figs. 3 and 4) depends on itself, i.e., depends on the value to be measured! Thus, even if the medium thickness is known (can be evaluated with OCT structural image), it is still unclear how far the group velocity is from the true shear wave speed. For example, when (which is typical for many OCE cases), the group velocity can be 10 to 100 times smaller than depending on which corresponds to the mechanical wave signal bandwidth, which is not known a priori. Note that the problems associated with using the group velocity for elasticity evaluation were briefly discussed in our previous study of ex vivo porcine corneas.15 Replacing estimated group velocities with phase velocities was also mentioned in Ref. 44.
In conclusion, we urge the OCE community to be careful using the group velocity to evaluate tissue elasticity and be extremely careful in describing 2-D and 3-D group velocity images. In many practical cases, when the medium under study consists of one or more layers, wave propagation splits into multiple, highly dispersive, guided modes producing group velocity estimates greatly influenced by extrinsic parameters and very far from the true value of the shear wave speed. Inversion of group velocity images in such cases using Eq. (1) will produce very poor renditions of true tissue elasticity maps.
A similar analysis applies when the wavelength of propagating waves is of the same order as the object size as, for instance, when dynamic elastography is used to quantify elasticity within a single cell. For example, an impressive study was recently performed to evaluate the elasticity of a mouse oocyte with propagating mechanical waves generated at a frequency of 15 kHz.45 The authors reported not only the mean shear wave speed in the cell () but also images of shear modulus across the cell. Wave propagation in the oocyte is most likely severely influenced by guided wave modes in the zona pelludica (). For these experimental parameters, even an optimistic estimate of the dimensionless frequency gives . This means that the true shear wave speed is at least twice the measured estimate and, therefore, the shear modulus is at least four times higher than the reported value. In addition, the dimensions and boundary conditions of the cell clearly affect the shear modulus image of the cell, leading to artifacts that cannot be ignored or considered insignificant.
Finally, the OCE community must develop correction methods to accurately convert the group velocity into the shear wave speed, which may work for some experimental cases, or create alternative methods to reconstruct the shear modulus (elasticity) from wave field data. For example, a model-based wave speed dispersion diagram can be used to fit experimental data and determine both viscosity and elasticity, as recently demonstrated in Ref. 46. Alternatively, high frequency asymptotes of guided waves approaching the Rayleigh and Scholte wave speeds when can provide a careful estimate of tissue elasticity.5,15 For more complex geometries, wave field inversion algorithms similar to those used in MRE47 must be considered. In any event, there is a great need to develop robust reconstruction methods for dynamic OCE to convert wave field data into quantitative maps of tissue shear modulus.
5. Appendix A
5.1. Finite Element Model for a Semi-Infinite Medium
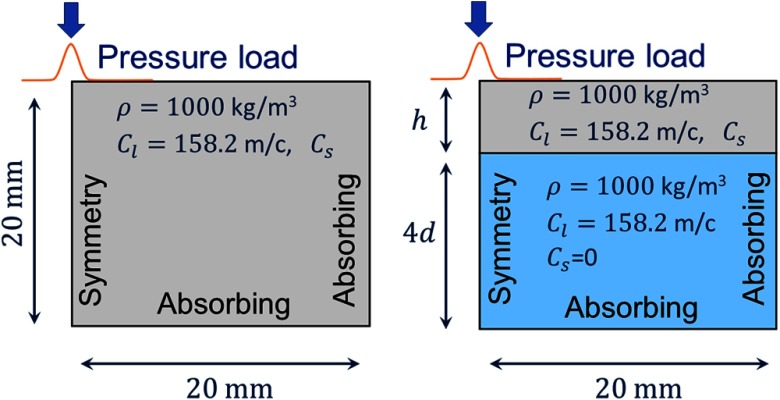
To model the propagation of elastic waves in soft tissue, we constructed a 2-D finite element model using OnScale (Onscale, Redwood City, California – formerly PZFlex). This approximation matches well to our experimental situation of a line excitation source,15,23 avoids diffraction effects during wave propagation, and maximizes the cross-correlation coefficient between signal profiles at different spatial locations (under this approximation the Rayleigh wave signal shape does not change during propagation29).
First, we wanted to ensure that the simulation provides accurate results for nearly incompressible media, demonstrating no significant artifacts (numerical dispersion or attenuation) during wave propagation. To do this, Rayleigh wave excitation and propagation in a bulk linear-elastic material were investigated [see Fig. 8(a)].
Fig. 8.
Finite element model in OnScale (formally PZFlex): (a) geometry and boundary conditions for a nearly incompressible semi-infinite medium and (b) a layer bounded on its bottom with water.
To simulate a spatiotemporally sharp push, we apply a time- and spatially dependent pressure load to the top () boundary of the domain. The spatial push profile is taken to be a Gaussian function [Eq. (3)] with full-width-at-half-max (FWHM) given by the push width . The temporal push profile is given by a super-Gaussian function [Eq. (4)] with FWHM given by the push duration . A time delay is introduced to avoid impulsive loading at time . The full pressure load is given by Eq. (5). In addition, we assume that the top boundary is free of shear stress.
| (3) |
| (4) |
| (5) |
Boundary conditions are assigned as follows. We assume the solutions are symmetric about the boundary. The lower and right boundaries are set to be absorbing layers that minimize the reflection of incident waves back into the domain. Because absorbing boundaries do not always perfectly prevent reflection of incident shear waves, the right boundary was set sufficiently far away from the region of interest so any partially reflected waves did not affect the results.
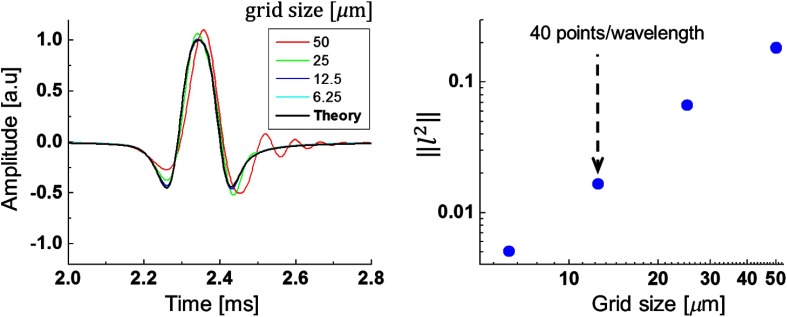
The domain was discretized with linear finite elements on a regular rectangular grid with a minimum of 40 elements per wavelength. The equations were integrated in time using an explicit time-stepping method and the vertical component of the vibration velocity field, equivalent to data recorded in OCE experiments, was extracted for analysis.
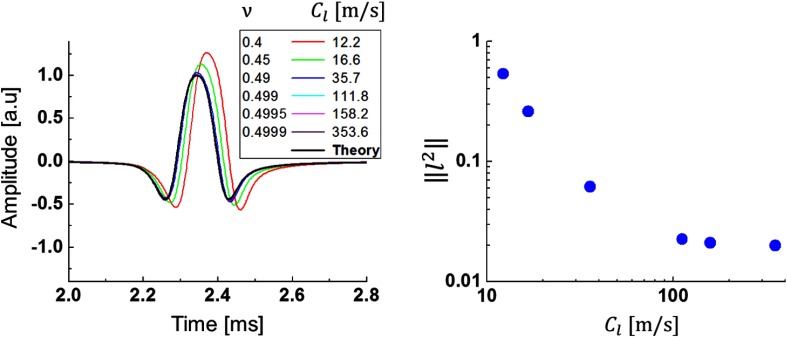
Because the Rayleigh wave speed does not depend on the longitudinal wave speed in a nearly incompressible medium,5,29 the numerical solution should converge in the limit . We checked this hypothesis by varying the Poisson ratio (see Fig. 9). For nearly incompressible media such as this, underintegrated linear finite elements are prone to spurious solutions. To prevent this, Belytchko–Bindeman strain hourglass suppression was applied to all models.48
Fig. 9.
(a) Temporal profiles of Rayleigh wave signals at different Poisson’s ratios (corresponding to different values of longitudinal wave speed ) and (b) convergence curve for the norm of vibration speed as a function of longitudinal wave speed . Signal excitation parameters were and [see Eqs. (3)–(5)].
Figure 9(a) shows how Rayleigh wave profiles change with increasing Poisson’s ratio. Clearly, signal shapes converge to the analytic solution (defined by the Green’s function49) for Poisson’s ratios higher than 0.4995. This is also seen in the quantitative error estimate in Fig. 9(b), which shows that for sufficiently high longitudinal wave speed, the numerical solution approaches the analytic solution at and changes very little. The longitudinal wave velocity necessary for this convergence is . Thus, it is not necessary to set the true value of (typical for soft tissues) in simulations; any values corresponding to Poisson’s ratio larger than 0.4995 will produce the same wave propagation over the time scales used in these simulations. Using this fact, simulation times can be dramatically reduced (from 8 h to 50 min per full simulation on a standard, 128 GB RAM workstation), spurious solutions due to hourglassing can be virtually eliminated, and floating point error in the numerical solution can be minimized.
To ensure that the numerical solution provides the correct outcome, we varied the grid size (number of points per wavelength). The results are shown in Fig. 10. As seen, profiles converge at more than 40 points per wavelength. In addition, we see that the solution does not change with propagation distance, which verifies the absence of significant numerical attenuation and dispersion within the simulation volume for the parameters used. The validity of results is further supported by a nearly perfect match of simulated wave speed dispersion curves to the analytical solution for guided waves5 shown in Fig. 3.
Fig. 10.
(a) Temporal profiles of the Rayleigh wave signals at different grid discretization and (b) convergence curve for the Rayleigh signal vector norm. Signal excitation parameters were and [see Eqs. (3)–(5)].
5.2. Finite Element Model for a Bounded Medium
The bounded tissue model consisted of two layered regions, both of which are assumed to be linear elastic materials under plane strain [Fig. 8(b)]. The upper layer models a medium under study with a thickness , shear wave speed , density , and longitudinal wave speed . These properties correspond to a Poisson’s ratio of about 0.4995, depending on the shear wave speed .
We set the longitudinal wave speed in the lower medium to that of water (closely approximating the anterior chamber of the eye). This region can support longitudinal waves but not shear waves and generates appropriate reflections back into the upper tissue layer. To achieve this, we match the density and longitudinal wave speeds to the upper region (, ) but set the shear wave speed to . The thickness of the lower layer is set to four times the estimated wavelength in the top layer to minimize interactions between the “leaky” longitudinal wave and the lower boundary.
Supplementary Material
Acknowledgments
This work was supported in part by NIH R01EY026532, R01EY024158, R01EB016034, R01CA170734, R01HL093140, Life Sciences Discovery Fund 3292512, the Coulter Translational Research Partnership Program, an unrestricted grant from Research to Prevent Blindness, Inc., New York, New York, and the Department of Bioengineering at the University of Washington. M. Kirby was supported by NSF Graduate Fellowship No. DGE-1256082. This material was based upon work supported by the National Science Foundation Graduate Research Fellowship Program under Grant No. DGE-1256082. Any opinions, findings, and conclusions or recommendations expressed in this material are those of the authors and do not necessarily reflect the views of the funders.
Biographies
Ivan Pelivanov is a research associate professor of the Department of Bioengineering at the University of Washington. His projects include areas of ultrasonics, laser physics, laser-ultrasonics and photoacoustics, both fundamental and applied, in NDT and biomedical fields, where light and sound could be used for diagnostics and imaging. He has spent years in designing ultra-broadband contact and non-contact transducers, from single element probes of different sizes and geometries, to multi-element arrays.
Liang Gao graduated from the College of Optical Sciences, University of Arizona. His PhD thesis was about ultrasound elasticity imaging of the human posterior tibial tendon. As a senior fellow in Department of Bioengineering, University of Washington, his research focuses on medical ultrasound imaging, shearwave elastography, and optical coherence elastography.
John Pitre received his BSE in biomedical engineering from Tulane University and MS and PhD degrees in biomedical engineering from the University of Michigan. He is currently a postdoctoral researcher at the University of Washington in the Department of Bioengineering. His research interests include ultrasound and optical coherence elastography, tissue biomechanics, and elastic wave propagation.
Mitchell A. Kirby received his BSc degree in biomedical engineering from Michigan Technological University. He is currently a doctoral student in bioengineering at the University of Washington. His research interests include biophotonics, imaging, and the combination of acoustics and optics in medicine.
Shaozhen Song received his doctoral degree from the University of Dundee, Scotland, United Kingdom. He is currently a postdoctoral fellow in the Biophotonics and Imaging Laboratory (BAIL), University of Washington, Seattle, USA, a biophotonics research group directed by Professor Ruikang Wang. His current research interests include biophotonics and imaging, especially in swept source optical coherence tomography (OCT), optical microangiography, and optical elastography, as well as their applications in ophthalmology, dermatology, and cancer.
David Li received his BSE, MSE, and PhD degrees in biomedical engineering from the University of Michigan. He is currently a postdoctoral researcher at the University of Washington in the Departments of Bioengineering and Chemical Engineering. His current research areas in the photoacoustic imaging, ultrasound-based contrast agent design, and nonlinear imaging modalities blending the use of optics and acoustics.
Tueng T. Shen is a clinician scientist at the University of Washington and an expert in corneal diseases. She received her PhD from the Massachusetts Institute of Technology and MD from Harvard Medical School. She is building a bridge between engineers and physicians to facilitate the translation of innovative engineering technology to creative clinical solutions to treat global blindness. She is a fellow of the American Institute for Medical and Biological Engineering (AIMBE).
Ruikang K. Wang is currently a professor with appointments in the Departments of Bioengineering and Ophthalmology, University of Washington, Seattle, Washington, USA. He holds the positions of WRF/David and Nancy Auth Innovator of Bioengineering, and Jules and Doris Stein Research to Prevent Blindness Professor of Ophthalmology. His current research interests include biophotonics and imaging and its translational applications in ophthalmology, dermatology, dentistry, and neuroscience. He is an elected fellow of OSA, SPIE, and AIMBE.
Matthew O’Donnell has worked at GE-CRD, the University of Michigan and the University of Washington (UW). He is now Frank and Julie Jungers Dean Emeritus of Engineering and professor of bioengineering at UW. His most recent research has focused on elasticity imaging, optoacoustic devices and photoacoustic contrast agents. He is a fellow of the IEEE and AIMBE and is a member of the Washington State Academy of Sciences and the National Academy of Engineering.
Disclosures
The authors declare they have no competing financial interests.
References
- 1.Ophir J., et al. , “Elastography: imaging the elastic properties of soft tissues with ultrasound,” J. Med. Ultrason. 29, 155–171 (2002). 10.1007/BF02480847 [DOI] [PubMed] [Google Scholar]
- 2.Mariappan Y. K., Glaser K. J., Ehman R. L., “Magnetic resonance elastography: a review,” Clin. Anat. 23, 497–511 (2010). 10.1002/ca.v23:5 [DOI] [PMC free article] [PubMed] [Google Scholar]
- 3.Tanter M., et al. , “High-resolution quantitative imaging of cornea elasticity using supersonic shear imaging,” IEEE Trans. Med. Imaging 28, 1881–1893 (2009). 10.1109/TMI.2009.2021471 [DOI] [PubMed] [Google Scholar]
- 4.Kennedy K. M., et al. , “Quantitative micro-elastography: imaging of tissue elasticity using compression optical coherence elastography,” Sci. Rep. 5, 15538 (2015). 10.1038/srep15538 [DOI] [PMC free article] [PubMed] [Google Scholar]
- 5.Kirby M. A., et al. , “Optical coherence elastography in ophthalmology,” J. Biomed. Opt. 22(12), 121720 (2017). 10.1117/1.JBO.22.12.121720 [DOI] [PMC free article] [PubMed] [Google Scholar]
- 6.Wang S., Larin K. V., “Optical coherence elastography for tissue characterization: a review,” J. Biophotonics 8, 279–302 (2015). 10.1002/jbio.v8.4 [DOI] [PMC free article] [PubMed] [Google Scholar]
- 7.Song S., Huang Z., Wang R. K., “Tracking mechanical wave propagation within tissue using phase-sensitive optical coherence tomography: motion artifact and its compensation,” J. Biomed. Opt. 18(12), 121505 (2013). 10.1117/1.JBO.18.12.121505 [DOI] [PubMed] [Google Scholar]
- 8.Wang S., Larin K. V., “Shear wave imaging optical coherence tomography (SWI-OCT) for ocular tissue biomechanics,” Opt. Lett. 39, 41 (2014). 10.1364/OL.39.000041 [DOI] [PMC free article] [PubMed] [Google Scholar]
- 9.Song S., et al. , “Shear modulus imaging by direct visualization of propagating shear waves with phase-sensitive optical coherence tomography,” J. Biomed. Opt. 18(12), 121509 (2013). 10.1117/1.JBO.18.12.121509 [DOI] [PMC free article] [PubMed] [Google Scholar]
- 10.Adie S. G., et al. , “Spectroscopic optical coherence elastography,” Opt. Express 18, 25519–22534 (2010). 10.1364/OE.18.025519 [DOI] [PMC free article] [PubMed] [Google Scholar]
- 11.Alonso-Caneiro D., et al. , “Assessment of corneal dynamics with high-speed swept source optical coherence tomography combined with an air puff system,” Opt. Express 19, 14188 (2011). 10.1364/OE.19.014188 [DOI] [PubMed] [Google Scholar]
- 12.Song S., et al. , “High speed imaging of remotely induced shear waves using phasesensitive optical coherence tomography,” Proc. SPIE 9312, 93121G (2015). 10.1117/12.2080990 [DOI] [Google Scholar]
- 13.Song S., et al. , “Strategies to improve phase-stability of ultrafast swept source optical coherence tomography for single shot imaging of transient mechanical waves at 16 kHz frame rate,” Appl. Phys. Lett. 108, 191104 (2016). 10.1063/1.4949469 [DOI] [PMC free article] [PubMed] [Google Scholar]
- 14.Kennedy B. F., Kennedy K. M., Sampson D. D., “A review of optical coherence elastography: fundamentals, techniques and prospects,” IEEE J. Sel. Top. Quantum Electron. 20, 272–288 (2014). 10.1109/JSTQE.2013.2291445 [DOI] [Google Scholar]
- 15.Ambroziński Ł., et al. , “Acoustic micro-tapping for non-contact 4D imaging of tissue elasticity,” Sci. Rep. 6, 38967 (2016). 10.1038/srep38967 [DOI] [PMC free article] [PubMed] [Google Scholar]
- 16.Twa M. D., et al. , “Influence of corneal hydration on optical coherence elastography,” Proc. SPIE 9693, 96930V (2016). 10.1117/12.2210756 [DOI] [Google Scholar]
- 17.Park S., et al. , “The impact of intraocular pressure on elastic wave velocity estimates in the crystalline lens,” Phys. Med. Biol. 62, N45–N57 (2017). 10.1088/1361-6560/aa54ef [DOI] [PMC free article] [PubMed] [Google Scholar]
- 18.Wang S., Larin K. V., “Noncontact depth-resolved micro-scale optical coherence elastography of the cornea,” Biomed. Opt. Express 5, 3807 (2014). 10.1364/BOE.5.003807 [DOI] [PMC free article] [PubMed] [Google Scholar]
- 19.Li J., et al. , “Differentiating untreated and cross-linked porcine corneas of the same measured stiffness with optical coherence elastography,” J. Biomed. Opt. 19(11), 110502 (2014). 10.1117/1.JBO.19.11.110502 [DOI] [PMC free article] [PubMed] [Google Scholar]
- 20.Wang S., et al. , “Noncontact quantitative biomechanical characterization of cardiac muscle using shear wave imaging optical coherence tomography,” Biomed. Opt. Express 5, 1980–1992 (2014). 10.1364/BOE.5.001980 [DOI] [PMC free article] [PubMed] [Google Scholar]
- 21.Li J., et al. , “Air-pulse OCE for assessment of age-related changes in mouse cornea in vivo,” Laser Phys. Lett. 11, 65601 (2014). 10.1088/1612-2011/11/6/065601 [DOI] [Google Scholar]
- 22.Wang S., et al. , “Noncontact measurement of elasticity for the detection of soft-tissue tumors using phase-sensitive optical coherence tomography combined with a focused air-puff system,” Opt. Lett. 37, 5184 (2012). 10.1364/OL.37.005184 [DOI] [PMC free article] [PubMed] [Google Scholar]
- 23.Ambroziński Ł., et al. , “Air-coupled acoustic radiation force for non-contact generation of broadband mechanical waves in soft media,” Appl. Phys. Lett. 109, 43701 (2016). 10.1063/1.4959827 [DOI] [PMC free article] [PubMed] [Google Scholar]
- 24.Larin K. V., Sampson D., “Optical coherence elastography–OCT at work in tissue biomechanics,” Biomed. Opt. Express. 8, 1172–1202 (2017). 10.1364/BOE.8.001172 [DOI] [PMC free article] [PubMed] [Google Scholar]
- 25.Han Z., et al. , “Quantitative methods for reconstructing tissue biomechanical properties in optical coherence elastography: a comparison study,” Phys. Med. Biol. 60, 3531–3547 (2016). 10.1088/0031-9155/60/9/3531 [DOI] [PMC free article] [PubMed] [Google Scholar]
- 26.Li C. H., et al. , “Quantitative elastography provided by surface acoustic waves measured by phase-sensitive optical coherence tomography,” Opt. Lett. 37, 722–724 (2012). 10.1364/OL.37.000722 [DOI] [PubMed] [Google Scholar]
- 27.Zhu J., et al. , “3D mapping of elastic modulus using shear wave optical micro-elastography,” Sci. Rep. 6, 35499 (2016). 10.1038/srep35499 [DOI] [PMC free article] [PubMed] [Google Scholar]
- 28.Zhu J., et al. , “Longitudinal shear wave imaging for elasticity mapping using optical coherence elastography,” Appl. Phys. Lett. 110, 201101 (2017). 10.1063/1.4983292 [DOI] [PMC free article] [PubMed] [Google Scholar]
- 29.Viktorov I. A., Rayleigh and Lamb Waves Physical Theory and Applications (Springer Science+Business Media, Heidelberger, Berlin, Germany: (1967). [Google Scholar]
- 30.Alleyne D. N., Cawley P., “A two-dimensional Fourier transform for the measurement of propagating multimode signals,” J. Acoust. Soc. Am. 89, 1159–1168 (1991). 10.1121/1.400530 [DOI] [Google Scholar]
- 31.Costley D. R., Berthelot Y. H., “Dispersion curve analysis of laser-generated Lamb waves,” Ultrasonics 32, 249–253 (1994). 10.1016/0041-624X(94)90002-7 [DOI] [Google Scholar]
- 32.Hyon S. H., Cha W. I., Ikada Y., “Preparation of transparent poly(vinyl alcohol) hydrogel,” Polym. Bull. 22, 119–122 (1989). 10.1007/BF00255200 [DOI] [Google Scholar]
- 33.Nguyen T.-M., et al. , “Visualizing ultrasonically induced shear wave propagation using phase-sensitive optical coherence tomography for dynamic elastography,” Opt. Lett. 39, 838 (2014). 10.1364/OL.39.000838 [DOI] [PMC free article] [PubMed] [Google Scholar]
- 34.Bohs L. N., Trahey G. E., “A novel method for angle independent ultrasonic imaging of blood flow and tissue motion,” IEEE Trans. Biomed. Eng. 38, 280–286 (1991). 10.1109/10.133210 [DOI] [PubMed] [Google Scholar]
- 35.O’Donnell M., et al. , “Internal displacement and strain imaging using ultrasonic speckle tracking,” IEEE Trans. Ultrason. Ferroelectr. Freq. Control 41, 314–325 (1994). 10.1109/58.285465 [DOI] [Google Scholar]
- 36.Kurokawa K., et al. , “In-plane and out-of-plane tissue micro-displacement measurement by correlation coefficients of optical coherence tomography,” Opt. Lett. 40, 2153–2156 (2015). 10.1364/OL.40.002153 [DOI] [PubMed] [Google Scholar]
- 37.Kurokawa K., et al. , “Two-dimensional micro-displacement measurement for laser coagulation using optical coherence tomography,” Biomed. Opt. Express 6, 170 (2015). 10.1364/BOE.6.000170 [DOI] [PMC free article] [PubMed] [Google Scholar]
- 38.Zaitsev V. Y., et al. , “Hybrid method of strain estimation in optical coherence elastography using combined sub-wavelength phase measurements and supra-pixel displacement tracking,” J. Biophotonics 9, 499–509 (2016). 10.1002/jbio.v9.5 [DOI] [PubMed] [Google Scholar]
- 39.Duncan D. D., Kirkpatrick S. J., “Processing algorithms for tracking speckle shifts in optical elastography of biological tissues,” J. Biomed. Opt. 6(4), 418–426 (2001). 10.1117/1.1412224 [DOI] [PubMed] [Google Scholar]
- 40.Wang Y., et al. , “Robust motion tracking based on adaptive speckle decorrelation analysis of OCT signal,” Biomed. Opt. Express 6, 4302–4316 (2015). 10.1364/BOE.6.004302 [DOI] [PMC free article] [PubMed] [Google Scholar]
- 41.Zaitsev V. Y., et al. , “Deformation-induced speckle-pattern evolution and feasibility of correlational speckle tracking in optical coherence elastography,” J. Biomed. Opt. 20(7), 075006 (2015). 10.1117/1.JBO.20.7.075006 [DOI] [PubMed] [Google Scholar]
- 42.Deffieux T., et al. , “The variance of quantitative estimates in shear wave imaging: theory and experiments,” IEEE Trans. Ultrason. Ferroelectr. Freq. Control 59, 2390–2410 (2012). 10.1109/TUFFC.2012.2472 [DOI] [PubMed] [Google Scholar]
- 43.Rouze N. C., et al. , “Parameters affecting the resolution and accuracy of 2-D quantitative shear wave images,” IEEE Trans. Ultrason. Ferroelectr. Freq. Control 59, 1729–1740 (2012). 10.1109/TUFFC.2012.2377 [DOI] [PMC free article] [PubMed] [Google Scholar]
- 44.Chen P.-Y., et al. , “High resolution shear wave imaging of the human cornea using a dual-element transducer,” Sensors 18, 4244 (2018). 10.3390/s18124244 [DOI] [PMC free article] [PubMed] [Google Scholar]
- 45.Grasland-Mongrain P., et al. , “Ultrafast imaging of cell elasticity with optical microelastography,” PNAS 115, 861–866 (2018). 10.1073/pnas.1713395115 [DOI] [PMC free article] [PubMed] [Google Scholar]
- 46.Liou H. C., et al. , “Nondestructive characterization of soft materials and biofilms by measurements of guided elastic wave propagation using optical coherence elastography,” Soft Matter. 15, 575–586 (2018). 10.1039/C8SM01902A [DOI] [PubMed] [Google Scholar]
- 47.Litwiller D. V., Mariappan Y. K., Richard L. E., “Magnetic resonance elastography,” Curr. Med. Imaging Rev. 8, 46–55 (2015). 10.2174/157340512799220562 [DOI] [PMC free article] [PubMed] [Google Scholar]
- 48.Belytschko T., Bindeman L. P., “Assumed strain stabilization of the 4-node quadrilateral with 1-point quadrature for nonlinear problems,” Comput. Methods Appl. Mech. Eng. 88, 311–340 (1991). 10.1016/0045-7825(91)90093-L [DOI] [Google Scholar]
- 49.Kausel E., Fundamental Solutions in Elastodynamics: A Compendium, Cambridge University Press, New York: (2006). [Google Scholar]
Associated Data
This section collects any data citations, data availability statements, or supplementary materials included in this article.


