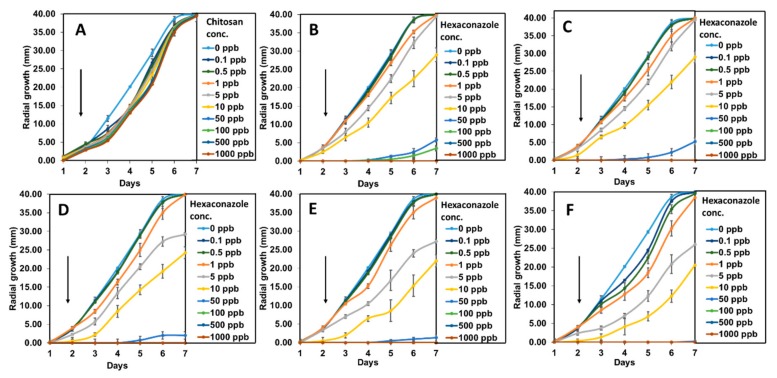
Figure 8.
G. boninense growth curve from day 1 to 7 incubated in (A) CEN, (B) pure hexaconazole and chitosan–hexaconazole nanoparticles prepared at various concentrations of TPP, (C) 2.5, (D) 5, (E) 10, and (F) 20 mg/mL at 28 ± 2 °C and at increasing concentration of 0–1000 ppb. Black arrows represent the increasing of the hexaconazole concentration and the error bars represent the standard deviation of the mean.

