Abstract
Third-generation sequencing using nanopores as biosensors has recently emerged as a strategy capable to overcome next-generation sequencing drawbacks and pitfalls. Assessing the quality of the data produced by nanopore sequencing platforms is essential to decide how useful these may be in making biological discoveries. Here, we briefly contextualized NanoR, a quality control method for nanopore sequencing data we developed, in the scenario of preexistent similar tools. We also illustrated 2 quality control pipelines, readily applicable to nanopore sequencing data, respectively, based on NanoR and PyPore, a second quality control method published by our group.
Keywords: anopore, NGS, quality control
Comment on: Bolognini D, Bartalucci N, Mingrino A, Vannucchi AM, Magi A. NanoR: a user-friendly R package to analyze and compare nanopore sequencing data. PLoS One. 2019 May 9;14(5): e0216471. doi:10.1371/journal.pone.0216471. PubMed PMID: 31071140. PubMed Central PMCID: PMC6508625. https://www.ncbi.nlm.nih.gov/pmc/articles/PMC6508625/.
Introduction
DNA sequencing evolves quickly. Barely 40 years have passed since initial sequencing methods have been developed in mid-1970s and, by way of next-generation sequencing (NGS), third-generation sequencing (TGS) emerged in early 2010s.1 Although NGS has become a standard approach in both basic and clinical research, it also has some drawbacks. A major limitation of NGS is the shortness of the reads generated; indeed, short reads fail to detect large structural variants and long repeated sequences,2 and are not well suited for allele phasing.3 TGS technologies now routinely generate reads averaging around 10 kb in length (with many over 100 kb), laying the foundations to overcome NGS limitations. Among TGS companies, Oxford Nanopore Technologies (ONTs) have rapidly risen to prominence mainly thanks to their low-cost (∼US$1000), portable (∼10 cm in length), real-time, DNA and RNA sequencing device MinION, theoretically capable to generate 10 to 20 Gb of sequenced data more than a 48-hour sequencing run. Oxford Nanopore Technologies also offer GridION X5 (up to 150 Gb sequenced data) and PromethION (up to 7.6 Tb sequenced data) for researchers with broader scope projects. All ONTs’ devices use a sequencing strategy called nanopore sequencing. Nanopore sequencing occurs in MinION (PromethION) flow cells containing 2048 (12 000) nanopores, arranged in 512 (3000) channels, through which an ionic current flows; on translocation of DNA or RNA molecule through a nanopore, a change in the ionic current can be observed and characterized.4 The current shift is eventually translated into a nucleic acid sequence by way of a basecaller (currently, the GPU-enhanced basecaller Guppy). Oxford Nanopore Technologies’ devices store all the information (ie, metadata) about sequenced reads in binary hierarchical files with groups, data sets, and attributes called FAST5 (a variant of HDF5 files), 1 per read (single-read FAST5). Recently, as sequencing experiments with ONTs’ devices frequently generate millions of reads, a new multi-read FAST5 format has been introduced (more practical for data transfer and data querying). Together with FAST5, sequencing summary files (TSV files describing each sequenced read) and sequences in FASTQ format are also generated.
Assessing quality of sequenced data from these technologies is of fundamental importance for meaningful downstream analyses. As MinION release in 2014, a number of tools designed to perform quality control on ONTs’ data have been released and can be broadly grouped into 2 categories. On one hand, tools from category 1 extract metadata from raw FAST5,5,6 which can be computationally intensive and time-consuming. In addition, most of the tools from this category are out of date and may not work properly with the most recent format of FAST5. On the other hand, tools from category 2 use sequencing summary files,7,8 which is definitely a faster approach but, as these are lacking information on the base composition of the sequences, it requires also FASTQ parsing to infer their guanine–cytosine (GC) content distribution.
Over the last year, our group has been working on versatile, efficient, and up-to-date quality control methods for ONTs’ sequenced data. This led us to develop and release NanoR9 and PyPore.10
Methods
NanoR is fully implemented in R, a programming language widely used by biologists. It provides functions supporting ONTs’ MinION and GridION X5 data analysis, starting either from raw FAST5 (single- or multi-read) or sequencing summary (with FASTQ). Moreover, output coming from any MinION and GridION X5 releases, until the most recent ones (18.12 and 18.12.1), can be handled by NanoR, which greatly adds to its ease of use and versatility. Main output from NanoR are static plots that offer a complete overview of the sequencing run (eg, reads and basepairs yield, reads quality and reads length fluctuations over time and sequencing channels activity, among others). Moreover, as ONTs’ data reads are notoriously affected by high error-rate profiles, we included in NanoR methods to filter FASTQ files based on a quality threshold higher than the default one for high-quality sequences (Phred score ⩾ 7), demonstrating its usefulness in reducing the error rate of the final alignments. A unique strength of NanoR is its capability to perform comparisons across experiments, thus being suitable to detect at first glance differences in multiple sequencing runs.
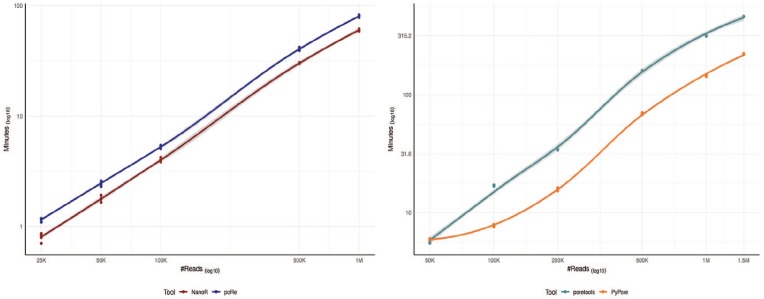
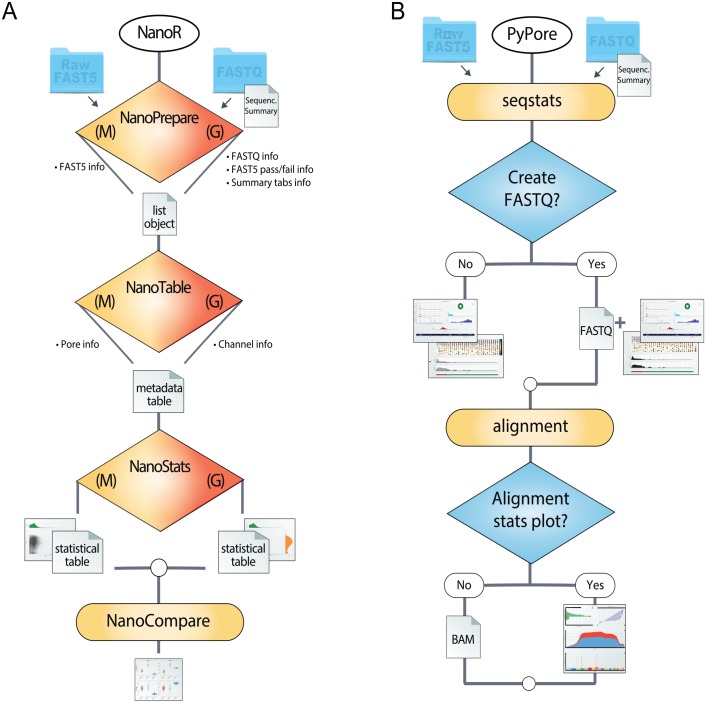
PyPore is implemented in Python and shares most of the features described above. It does not perform comparisons across experiments, but provides an useful alignment module that exploits up to 3 state-of-the-art long reads aligners for mapping sequences against the reference genome and to compute alignment statistics such as coverage, mapped/unmapped reads fractions, and error rate. Moreover, PyPore generates interactive HTML plots that allow users to easily scroll across and zoom into the experimental results. Overall, our methods offer improvements in the field of quality control for ONTs’ data, mainly for their versatility and completeness; moreover, Figure 1 shows that, compared with widely used competitors implemented in the same programming languages, our tools perform well also in terms of speed. Given their similarity as well as their specific features, we also illustrate in Figure 2, two possible complete pipelines users may take advantage of when analyzing their data with NanoR and PyPore.
Figure 1.
Speed comparison. Left panel shows LOESS curves comparing speed of NanoR and poRe, both implemented in R. We measured the user waiting-time when extracting metadata from increasing number of sampled FAST5 (25 K, 50 K, 100 K, 500 K, 1 M) using functions from the 2 packages designed for parallelization (NanoTableM from NanoR and extract.fast5 from the poRe parallel GUI). We used 10 Intel® Xeon® CPU E5-46100 @2.40 GHz cores on a 48 cores SUSE Linux Enterprise Server 11. For each number of read, the sampling-extraction step was repeated 5 times. Overall, NanoR is faster than poRe and, for example, it requires ∼60 minutes to extract metadata from 1 M FAST5, whereas poRe ∼80 minutes. Right panel shows LOESS curves comparing speed of PyPore and poretools, both implemented in python. For a fair comparison, we measured the user waiting-time when performing a complete analysis from increasing number of sampled FAST5 (50 K, 100 K, 200 K, 500 K, 1 M, 1.5 M) using a single Intel® Xeon® CPU E5-46100 @2.40 GHz core, as poretools functions are not designed for parallelization. In particular, we compared the speed of seqstats from PyPore with the speed of 5 functions from poretools required to generate a comparable output (poretools stats, occupancy, hist, and yield_plot). For each number of read, the sampling-analysis step was repeated 5 times. PyPore is definitely faster than poretools and, for example, it requires ∼145 minutes to complete the analysis on 1 M FAST5, whereas poretools requires ∼220 minutes. GUI indicates graphical user interfaces; LOESS, locally estimated scatterplot smoothing.
Figure 2.
NanoR and PyPore flowcharts. Panel A illustrates a symbolic workflow with NanoR generating a complete overview of the sequencing run, starting either from FAST5 or sequencing summary files and FASTQ (FASTQ extraction/filtering is performed with NanoFastqM and NanoFastqG, not shown). Once sequencing runs are analyzed, they can be compared in 1 command with NanoCompare. Panel B illustrates a symbolic workflow with PyPore. Starting either from FAST5 or sequencing summary files and FASTQ, seqstats is capable to perform data conversion and quality assessment at once. If FASTQ sequences are provided/generated, alignment attends computing alignment statistics capable to make data conversion and quality assessment at once.
Acknowledgments
The authors gratefully acknowledge Dr Niccolo’ Bartalucci, Dr Alessandra Mingrino, and Dr Alessandro Maria Vannucchi for providing MinION and GridION X5 sequencing data sets for benchmarking NanoR and PyPore.
Footnotes
Funding:The author(s) disclosed receipt of the following financial support for the research, authorship, and/or publication of this article: This work was supported by the Associazione Italiana per la Ricerca sul Cancro (AIRC Investigator Grant 20307, “Third Generation Cancer Genomics”). The funders had no role in study design, data collection and analysis, decision to publish, or preparation of the manuscript.
Declaration of conflicting interests:The author(s) declared no potential conflicts of interest with respect to the research, authorship, and/or publication of this article.
Author Contributions: DB wrote, tested, and optimized NanoR. RS wrote, tested, and optimized PyPore. AM supervised both projects and provided meaningful suggestions on their computational methods. DB and RS wrote the manuscript. AM revised the manuscript.
ORCID iD: Davide Bolognini  https://orcid.org/0000-0002-8735-8093
References
- 1. Heather JM, Chain B. The sequence of sequencers: the history of sequencing DNA. Genomics. 2016;107:1–8. [DOI] [PMC free article] [PubMed] [Google Scholar]
- 2. Chaisson MJP, Sanders AD, Zhao X, et al. Multi-platform discovery of haplotype-resolved structural variation in human genomes. Nat Commun. 2019;10:1784. [DOI] [PMC free article] [PubMed] [Google Scholar]
- 3. Tewhey R, Bansal V, Torkamani A, Topol EJ, Schork NJ. The importance of phase information for human genomics. Nat Rev Genet. 2011;12:215–223. [DOI] [PMC free article] [PubMed] [Google Scholar]
- 4. Van Dijk EL, Jaszczyszyn Y, Naquin D, Thermes C. The third revolution in sequencing technology. Trends Genet. 2018;34:666–681. [DOI] [PubMed] [Google Scholar]
- 5. Loman NJ, Quinlan AR. Poretools: a toolkit for analyzing nanopore sequence data. Bioinformatics. 2014;30:3399–3401. [DOI] [PMC free article] [PubMed] [Google Scholar]
- 6. Watson M, Thomson M, Risse J, et al. poRe: an R package for the visualization and analysis of nanopore sequencing data. Bioinformatics. 2015;31:114–115. [DOI] [PMC free article] [PubMed] [Google Scholar]
- 7. De Coster W, D’Hert S, Schultz DT, Cruts M, Van Broeckhoven C. NanoPack: visualizing and processing long-read sequencing data. Bioinformatics. 2018;34:2666–2669. [DOI] [PMC free article] [PubMed] [Google Scholar]
- 8. Lanfear R, Schalamun M, Kainer D, Wang W, Schwessinger B. MinIONQC: fast and simple quality control for MinION sequencing data. Bioinformatics. 2019;35:523–525. [DOI] [PMC free article] [PubMed] [Google Scholar]
- 9. Bolognini D, Bartalucci N, Mingrino A, Vannucchi AM, Magi A. NanoR: a user-friendly R package to analyze and compare nanopore sequencing data. PLoS One. 2019;14:e0216471. [DOI] [PMC free article] [PubMed] [Google Scholar]
- 10. Semeraro R, Magi A. PyPore: a python toolbox for nanopore sequencing data handling [published online ahead of print April 16, 2019]. Bioinformatics. doi: 10.1093/bioinformatics/btz269. [DOI] [PubMed] [Google Scholar]


