Abstract
Objective
Virus-transduced, intracellular-calcium indicators are effective reporters of neural activity, offering the advantage of cell-specific labeling. Due to the existence of optimal time window for expression of calcium indicators, a suitable tool for tracking GECI expression in vivo following transduction is highly desirable.
Approach
We developed a noninvasive imaging approach based on a custom-modified, low-cost and fundus viewing system that allow us to monitor and characterize in vivo bright-field and fluorescence images of the mouse retina. AAV2-CAG-GCaMP6f was injected into a mouse eye. The fundus imaging system was used to measure fluorescence at several time points post injection. At defined time points, we prepared wholemount retina mounted on a transparent multielectrode array (MEA) and used calcium imaging to evaluate the responsiveness of RGCs to external electrical stimulation.
Main results
The non-invasive fundus imaging system clearly resolves individual retinal ganglion cells (RGCs) and axons. RGC fluorescence intensity and the number of observable fluorescent cells show a similar rising trend from week 1 to week 3 after viral injection, indicating a consistent increase of GCaMP6f expression. Analysis of the in vivo fluorescence intensity trend and in vitro neurophysiological responsiveness shows that the slope of intensity vs. days post injection can be used to estimate the optimal time for calcium imaging of RGCs in response to external electrical stimulation.
Significance
The proposed fundus imaging system enables high-resolution digital fundus imaging in the mouse eye, based on off-the-shelf components. The long-term tracking experiment with in vitro calcium imaging validation demonstrate the system can serve as a powerful tool monitoring the level of GECI expression, further determining the optimal time window for following experiment.
1. Introduction
Genetically encoded calcium indicators (GECIs) have been widely used for observing neural activity in multiple systems because they enable repeated measurement of many cells in parallel at single-cell resolution. For example, some genetically encoded activity reporters were developed for achieving functional imaging of hippocampal place cells during virtual navigation (1), obtaining tuning curves of orientation-selective neurons in visual cortex (2), optimizing the stimulation parameters of retinal prostheses (3), or monitoring responses in targeted retinal cell populations during visual information processing activity with relatively high spatial resolution (4). GECIs can be delivered to cells via electroporation, biolistics, viral vector transduction, or generation of transgenic animals (5). Of these methods, viral transduction provides the greatest cellular specificity in the retina (3, 4). However, viral transduction of GECIs is known to vary with time and an optimal time window of expression exists (3, 6). Before this window, underexpression leads to small fluorescence changes that are difficult to measure. Past this window, overexpression renders cells unresponsive. Therefore, a suitable tool for tracking GECI expression in vivo following transduction is highly desirable to allow experimental determination of the best time window.
Several systems have been reported for microscopic fundus imaging in rodents, including scanning laser ophthalmoscopes incorporating adaptive optics (7–9) and commercial fundus systems (10,11). Applications range from observing autofluorescence in retinal pigment epithelial cells (8), identifying RGC bodies and axons labeled with dye (9), imaging curcumin-labeled Aβ plaques in Alzheimer’s disease mice retina (10), or evaluating retinal transduction following neonatal intravascular administration of virus vectors (11). Two-photon microscopy has also been used for monitoring calcium transients of retinal bipolar cells modulated by visual stimulation (12). Although those systems allow fluorescent fundus imaging, the high cost of these systems is a barrier to wide-spread use.
Compared with these relatively complex and expensive imaging techniques, digital fundus imaging in fluorescence mode, has been considered a cost-effective method for fluorescein angiograms (13). Fundus autofluorescence imaging, which focuses on the fluorescent properties of pigments in the retina, has been used to diagnose various disease processes clinically (14). Some customized topical endoscopy funduscopes for rodents have been demonstrated for the screening of the ciliary body and retinal vessels (15) or monitoring gene expression in transduced neurons (16). Such systems offer the advantage of user-friendly procedures that facilitate the training and reduce execution time needed to perform the examination.
We report here the development and validation of a custom endoscope-based fundus system for monitoring and characterizing in vivo brightfield and fluorescence retinal images, based on low-cost adaptations of a simple fundus imaging system similar to that proposed by Paques et al. (15) and Schejter et al (16). To monitor the genetic expression of GECI GCaMP6f (17) transduced in mouse RGCs by adeno-associated viral vector (AAV), we performed long-term tracking following intravitreal injection and identified an optimal window of expression. The in vivo imaging data was then compared to in vitro calcium imaging using a retinal wholemount preparation.
2. Methods
2.1. Overview
Adult mice (C57BL6/J) receiving an intravitreal injection of an AAV vector encoding a GECI (AAV2-CAG-GCaMP6f) were used to perform fundus imaging and calcium imaging experiments. One group of retinas was imaged in vivo by our fundus imaging system from week 1 to week 5 post injection at 4-day intervals. The other group of retinas was dissected at defined time points to identify the optimal time following AAV transduction for performing in vitro calcium imaging experiments, which are designed to determine the neurophysiological properties of RGCs expressing GCaMP6f. All procedures were approved by the Institutional Animal Care and Use Committee (IACUC) and the Institutional Biosafety Committee (IBC) at the University of Southern California.
2.2. Animal
Two strains of animals were used. To assess inter-experiment differences with in vivo monitoring, the Thy 1-YFP-H line transgenic WT YFP-expressing mice developed by Feng et al. were selected since they have consistently, sparsely-labeled RGCs (< 10%), suitable for visualizing individual cells without overlap (18). These cells should have stable expression of YFP. For tracking the GECI expression at different time points, adult female and male mice C57BL6/J (Jackson Lab, Bar Harbor, Maine), aged postnatal day 60–180, were used for both in vivo monitoring and in vitro assessment.
2.3. Funduscope
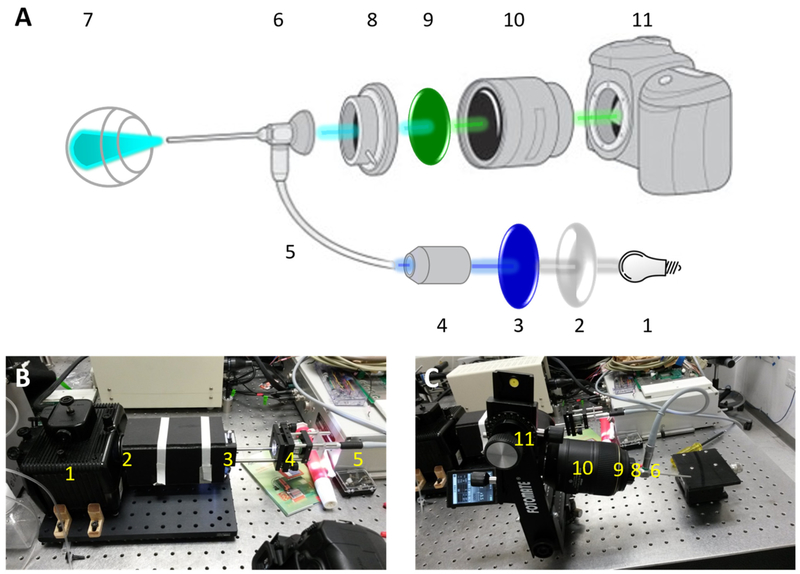
The fundus imaging system is illustrated in Figure 1A, with divided excitation and emission pathways to facilitate fluorescence imaging of the retina at single-cell resolution. For the emission pathway (Figure 1 A, C), an endoscope with a 5-cm otoscope and 3-mm outer diameter (1218 AA, Karl Storz, Tuttlingen, Germany) was positioned in front of the camera. Assembled with a step-down ring, the manufactured adaptor was used to connect the digital camera (D5100 with AF-S VR Micro-Nikkor 105mm f/2.8G lens, Nikon, Tokyo, Japan) with the endoscope, providing the ability to install optical emission filters. For the excitation pathway (Figure 1A, B), a xenon lamp (LH-M100CB-1, Nikon, Tokyo, Japan) was used as the light source to generate collimated light. Depending on the chosen mode, the light was projected through the excitation filter or neutral density filter on to a custom-made optical fiber connector that transmitted the light source to the endoscope by means of a commercial optic fiber cable (495NA, Karl Storz, Tuttlingen, Germany). For fluorescence imaging, the illumination power in the band of interest (centered on λ = 480nm) was calibrated to 6mW by bench top optical power meter (1936-R, Newport, Irvine, CA). This power setting ensures that the average brightness of the obtained fluorescent fundus images and the SNR are acceptable, while remaining in the range of permissible exposures for ocular safety. (19)
Figure 1:
(A) System schematic diagram. 1: light source, 2: convex lens, 3: excitation filter, 4: objective lens, 5: optic fiber, 6: endoscope, 7: in vivo eye, 8: adaptor, 9: emission filter, 10: lens of camera, 11: camera. (B) Excitation part of the system, including compartments 1 through 5 in (A). (C) Emission part of the system, including compartments 6 through 11 in (A).
Fluorescence images were obtained using a 469 nm excitation filter (MF469–35, Thorlabs, Newton, NJ) placed in the removable filter holder on the light source breadboard (Figure 1B), and a 535 nm emission filter (MF525–39, Thorlabs, Newton, NJ) positioned in the adaptor in front of the camera lens. Brightfield and green-field images were obtained with and without the emission filter, respectively, and in both cases the excitation filter was replaced with a neutral density filter (NE06B-A, Thorlabs, Newton, NJ) attenuating the illumination power by 75%. The camera settings are listed in Table 1.
Table 1:
Camera setting for the proposed fundus imaging system.
| Parameters | Settings |
|---|---|
| Image resolution | fine (4928×3264) |
| Focus | manual operating mode |
| Aperture | F 3.3 |
| ISO | 3200 |
| Focal length | 105 mm |
| Shutter speed | 1/8 sec (bright and green field) |
| 8 – 25 sec (fluorescence) |
2.4. Fundus imaging
For in vivo fundus imaging, the mice were anesthetized using a mixture of ketamine (80mg/kg) and xylazine (10mg/kg). The pupil was dilated with 0.5% tropicamide and 2.5% phenylephrine hydrochloride. Topical tetracaine hydrochloride was applied for local corneal anesthesia. The animals were placed on the adjustable platform while the eye was positioned such that it lightly touched the endoscope tip. A drop of saline (NACL 0.9%>) was used to keep the eye hydrated and optically coupled to the endoscope. To make images comparable at different time points, the optic disc was aligned at the center of camera, and the edge of dilated pupil was arranged perpendicular to the endoscope tip.
2.5. Imaging processing
For the fluorescence intensity analysis, we used MATLAB (The MathWorks, Natick, MA). To eliminate the temporal and spatial variation caused by the variations in the optical pathway of the eye or the alignment between the eye and the tip of endoscope, the green-field intensity was used for normalization. The green channel was first separated and extracted from the raw RGB fluorescence image, and 10 consistently observable cells expressing GCaMP6f fluorescence across different time points were randomly selected from the fundus images. The normalized fluorescence intensity was calculated by the average of fluorescence intensity within each cell divided by the baseline green-field reflection taken from an identical region of interest (eq. (1)). For each time points, 6 to 8 trials of image pairs were taken to compute the final value.
| (1) |
To count cells, we used Image J (National Institutes of Health, Bethesda, MD). The green channel was first separated from the raw fluorescence data, and the background subtraction tool was applied with a rolling ball radius of 40 pixels. After removing the background, the inverted image threshold was adjusted so that distinct cell contours could be clearly observed. To eliminate the noise generated by the CCD camera, the noise correction function, including outlier removal and despeckle, were used in order to eliminate the hot and dead pixels. The images were further processed by binary function fill holes and watershed functions to fill in the nucleus and partition the overlapping cells. Finally, the analyze particles function was used to count the number of observable cells, with the size set to 500-infinity.
2.6. Viral vector
The pGFP plasmid (20, 21) was selected as the backbone for the GECI-containing vector. The original GFP sequence was removed and replaced with the GECI GCaMP6f (17) to create pAAV-CAG-GCaMP6f. A CMV enhancer, chicken β-actin promoter (CBA promoter), exon, and intron were collectively used to form a ubiquitously strong CAG promotor, located upstream of the cassette encoding GCaMP (22). To enhance protein translation, woodchuck hepatitis virus posttranscriptional regulatory element (WPRE) was placed downstream of the transgene (23). The entire cassette was flanked by AAV2 inverted terminal repeats. Recombinant AAV vectors were produced by the two-plasmid co-transfection method (3, 24). Final concentration of AAV2-CAG-GCaMP6f was 2.6 × 10¹² vector genomes per milliliter. Viral stock was diluted to 1.04 × 10¹² with balanced salt solution before injection.
2.7. Electrical Stimulation
Transparent MEAs were fabricated in a class 100 cleanroom. Arrays were patterned by selective etching of indium tin oxide (ITO) on no. 1 cover glass substrates (Vaculayer, Mississauga, Ontario, Canada). A dualinsulation layer, including SU-8 epoxy photoresist and silicon nitride, was formed atop the ITO. The insulation layer was removed to create 200-μm- diameter disk electrodes. These dimensions are within the range of present day retinal prostheses.
Electrical stimuli consisted of 50-sec trains of charge-balanced, biphasic current rectangular pulses with 5-ms duration per phase at 20 pulses per second to produce a robust calcium transient. Voltage stimuli were generated from a computer-controlled stimulus generator (STG-2008, Multi Channel Systems, Reutlingen, Germany) and fed through a custom voltage-to-current converter. A customized interface circuit board was used to relay the signal to the designated electrode. A platinum wire encircling the top of the recording chamber served as the return electrode. The amplitude of pulse train was selected to be 1.2 times the maximum threshold of RGCs in the region of interest, where the threshold set as 5% increase in calcium fluorescence (△F/F).
2.8. Calcium Imaging
Virus-injected mice were euthanized at times corresponding to times at which fundus imaging was conducted, in order to assay the neurophysiological responses as a function of post-injection time of RGCs expressing GCaMP6f. After anesthesia with ketamine/xylazine, the mice were rapidly decapitated and the treated eye was enucleated and hemisected with Vannas spring scissors. To flatten the retina, 4 cuts were made, from periphery to center, to create quadrants of near equal size. Vitreous was gently peeled from the retina surface with fine forceps to allow for a tight interface between the retina and MEA.
After removal from the eye cup, the retina was mounted on a porous membrane (cat. No. JVWP01300; Millipore) and placed on the transparent MEA chamber with ganglion cell side facing down. Images of calcium fluorescence were acquired through an inverted epifluorescence microscope. Fluorescence excitation was provided by a super bright cool white light-emitting diode (LED). Excitation and emission light were filtered through a commercial filter set (GFP-4050A, Semrock, Rochester, NY) for GCaMP6f. Images were viewed through a Nikon (Tokyo, Japan) Plan Apo 0.75-numerical aperture (NA) ×20 objective and captured by an electron-multiplied charge-coupled device (EMCCD) camera. (iXon, Andor Technology, Belfast, Northern Ireland).
For superfusion, bicarbonate-buffered Ames’ Medium (Sigma-Aldrich, St. Louis, MO) was used in all procedures. Media was supplemented with penicillin-streptomycin to prevent bacterial growth, equilibrated with 5% 002–95% O2 gas, and adjusted to pH 7.4 and 280 mOsm. During the course of each experiment, the retina was continuously superfused at a flow rate of 4–5 ml/min and a temperature of 33°C.
3. Results
3.1. System Performance
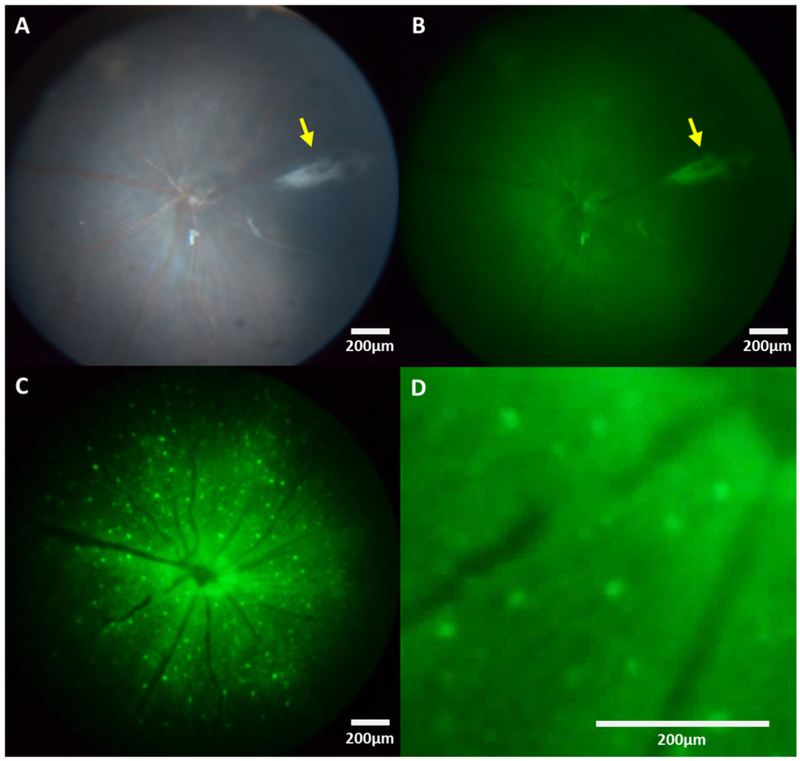
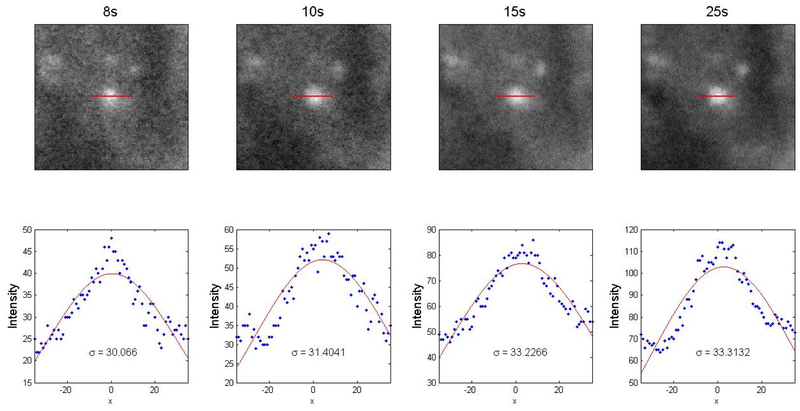
Brightfield, green-field and fluorescence fundus images were acquired from virus-transduced GCaMP6f mice. Figure 4A illustrates a representative brightfield image in which the blood vessels radiating from the center of optic nerve can be visualized clearly through the funduscope system. Moreover, the axon bundles of RGCs located within nerve fiber layer can be observed near the center when higher illumination power is used. The white/grey region on the right side of the view faithfully depicts the needle track of the needle used for intravitreal injection of the virus (indicated by yellow arrow). In the fluorescence images, axons and individual RGCs can be visualized (Figure 4C, D) and appeared to be relatively well resolved when compared to the previous fluorescence endoscope-based fundus imaging work (16). Tests of different exposure time settings showed that 25 sec is required to observe GCaMP6f-expressing cells located at the peripheral regions of fundus in fluorescence mode, especially for the period when GCaMP6f is sparsely expressed (Figure 5). However, the extended exposure might also lead to the imaging blurring caused by breathing artifact or other head motion. The fluorescence intensity profile of individual GCaMP6f RGCs shown in Figure 6 demonstrate the spatial resolutions of an individual cell remain relatively consistent across different exposure settings, even when the high exposure setting was used.
Figure 4:
Representative fundus images in a C57 mouse. (A) Bright field image. (B) Green-field image. (C) Fluorescence image. (D) Magnification of (C). The yellow arrows in (A) and (B) indicate the track of virus injection needle.
Figure 5:
Representative fundus images under different exposure setting of virus-induced GCaMP6f in mouse RGCs at 15 day post injection. From (A) to (E) are 8s, 10s, 15s, 25s respectively.
Figure 6:
Evaluation of the ability of the system to resolve individual cells. Top row: Zoomed in normalized fluorescent fundus images of GCaMP6f-expressing RGCs under different exposure time settings. Red lines illustrate the path along which intensity profiles were taken. Bottom row: Intensity profiles taken along the cross-sections of soma, fitted with Gaussian curves. The standard deviation of each Gaussian curve is listed (unit: pixel).
3.2. Long-term Expression Tracking
The long-term tracking of the fundus of transgenic YFP-expressing mice is shown in Figure 7. Generally, a similar fluorescence pattern can be observed consistently at different time points in terms of YFP-RGCs, though the background and overall fluorescence slightly declined over time. This experiment also demonstrates that since identical field of view cannot be obtained for different time points, due to the slightly different alignment for each measurement, a normalization procedure relative to the baseline greenfield is necessary for quantitatively analyzing the change of fluorescent intensity.
Figure 7:
Representative fundus images demonstrating the expression of transgenic YFP in mouse RGCs From (A) to (E) are 7, 11, 15, 19, 23 days corresponding to the time points for the experimental GCaMP6 group.
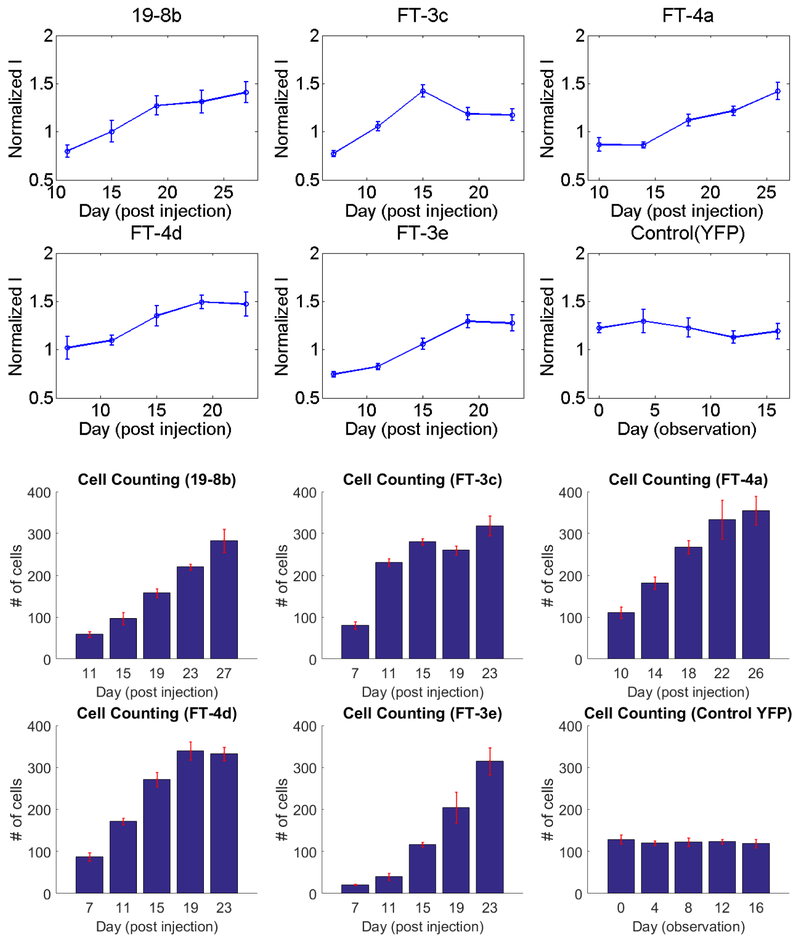
Representative fluorescence images for different stages of virus-induced GCaMP6f expression are shown in Figure 8. At 1 to 1.5 week post injection, only a few RGCs could be distinguished from the relatively weak background. The number of observable cells, as well as the fluorescence intensity of each cell, both demonstrated a consistent rising trend with time, in addition, there was a gradual increase in background intensity at late stages, which may be due to increased scattering seen with enhanced fluorescence intensity. Figure 9 shows the statistical analysis for the change in RGC fluorescence intensity and cell number across different experimental and control subjects (n=5 and n=l), respectively. In the intensity analysis, each curve represents the averaged normalized intensity from 10 different RGCs. The results indicate that RGCs share a similar trend of rising intensity from week 1 to week 2, post injection. However, for most of the cases, the fluorescence intensity reached a plateau or decreased slightly at 2–3 weeks. In contrast, for the control transgenic YFP retina, the normalized intensity was relatively unchanged or slightly decreased over time, as observed in Figure 7. The only dramatically declining case (subject: FT-3c) was later found to be attributable to the deterioration of the crystalline lens. The average slope of the normalized fluorescence intensity before and after week 2 are 0.2997 (n=5) and 0.0990 (n=4, one animal removed due to deterioration of crystalline lens) respectively, with p<0.05. The significant change of fluorescence intensity in terms of slope can serve as an effective indicator for determining the optimal time window.
Figure 8:
Representative fundus images demonstrating the long-term expression of virally-transduced GCaMP6f in mouse RGCs. From (A) to (E) are 11, 15, 19, 23, 27 days post injection, respectively.
Figure 9:
Normalized intensity in selective RGCs and number of observable RGCs in the fundus field of view across 5 GCaMP6 expressing and 1 control YFP subjects. For each time point, 6–8 trials of data were averaged to demonstrate the tendency of fluorescent expression.
As for the number of fluorescent cells, a progressively increasing trend can also be identified in GCaMP6f-injected animals, which is to be contrasted with the stable number of cells in the transgenic YFP mice. Both findings support a uniform increase in both fluorescence within a cell and the number of cells expressing GCaMP6f.
3.3. In vitro Calcium Imaging Validation
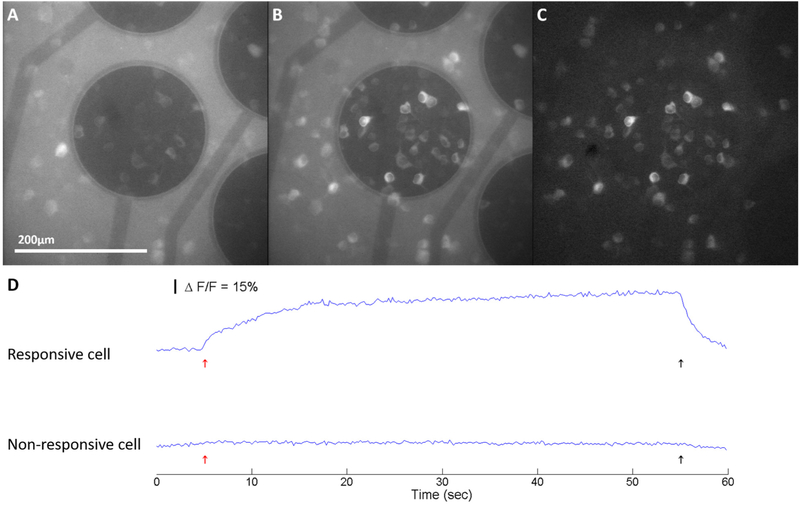
To test whether the images obtained by fundus imaging could be used to establish optimal experimental time windows for neurophysiological experiments, virus-injected mice were used for in vitro calcium imaging at time points coinciding with in vivo imaging time points. As shown in Figure 10, burst electrical stimulation with an ITO electrode was applied to elicit calcium transient fluorescence responses in GCaMP6f-expressing RGCs in the field of view. The difference between the post-stimulus and baseline images show that the responsive cells can be located and correctly labeled in the field of view
Figure 10:
Electrical stimulation activates RGCs as revealed through large changes in GCaMP6f fluorescence intensity in well expressed region in vitro. (A) Before Stimulation, cells are at baseline fluorescence. (B) Original calcium imaging in response to external stimuli from the ITO electrode in the middle, the electrically activated cells became visibly brighter. (C) Image subtraction of (B) from (A) baseline highlights the responding cells in the field of view. (D) Normalized changes in fluorescence (△F/F) for responsive and non-responsive RGCs expressing GCaMP6f in response to the 20 Hz 5 ms duration biphasic symmetric pulse train stimuli. The red and black arrows indicate the onset and offset of the stimulation pulse train.
Since the expression is highly non-uniform across the retina, we selected 3 to 4 regions where expression is relatively higher in terms of number of GCaMP-expressing cells as the region of interest (Table 2, column 4). This sampling strategy is also used for in other retinal calcium imaging experiment because more cells with expression allow more data to be collected in a single experiment. The statistical results shown in Table 2 indicate that the ratio for the responsive RGC versus the total observable cells was highest at week 3 post injection. For earlier time points, there were few observable cells and the responsiveness rate of those cells was also extremely low. If the incubation time was longer than 3 weeks, although the number of GCaMP6f-expressing cells was high, the responsive ratio decreased significantly from week 3.
Table 2.
Responsive cells (in vitro)
| Time post injection | Expression Ratio (mean) | Expression Ratio (std) | # of RGCs w/GCaMP6f |
|---|---|---|---|
| 2 weeks | 29.60% | ±6.38% | 43.3 |
| 3 weeks | 86.97% | ±3.83% | 86.3 |
| ≥4 weeks | 69.24% | ±5.00% | 94.0 |
Statistical results for the ratio of responsive RGC versus total cell expressing GCaMP6f in the region of interest. The data was acquired from 3–4 well-expressed regions of each retina.
The in vitro calcium imaging results correspond to the in vivo fundus imaging results shown in Figure 8 and 9. In most cases, the fluorescence intensity within RGCs began to increase around 1 to 1.5 week and started to plateau or decrease slightly around 3 week, which parallels the trend of in vitro neurophysiological responsiveness. The optimal time window for the proposed virus-transduced calcium indicator can thus be determined in terms of the normalized fluorescence intensity trend. When the curve reaches a plateau or demonstrates decreasing trend with significant reduction of slope, the GCaMP6f-expressing retina has optimal expression the for electrical stimulation experiment.
4. Discussion
We have presented an in vivo fundus system that enables high-resolution digital fundus imaging in the mouse eye. The system is built of off-the-shelf components. Additionally, the long-term tracking experiment demonstrates the system can serve as a tool for obtaining consistent, cell-resolved fluorescent images, and this information can be used to monitor level of GECI expression, thus greatly reducing the time to evaluate transduction outcomes. Moreover, the in vitro calcium imaging shows that the fluorescence fundus imaging can be used to determine the best time window for neurophysiological studies of transduced RGCs.
4.1. Head motion and optical blurring
Most of fundus imaging acquisition techniques require head fixation of animals to eliminate the motion caused by breathing, thus improving the spatial resolution. However, in our experiments, the imaging quality did not improve significantly when the mouse head was fixed. Tests of different exposure time settings for GCaMP6f expressing RGCs show fluorescence intensity profiles with similar standard deviation for those cells consistently appearing near the optic disc (Figure 5, 6). This observation suggests the effective resolution is primarily limited by optical point spread function, instead of movement-related blurring. Instead, offline image processing techniques such as those applied in super resolution image reconstruction (25) and deconvolution algorithms (26) possibly can be used to enhance the resolution.
4.2. Photobleaching of fluorophore
Previous studies have shown that the fluorescence intensity decreases during illumination with a high intensity light source, due to photobleaching of the fluorophores (27, 28). In our experiments, the power and the exposure time were set to 6mW and 25sec, to limit illumination exposure to a level that still ensured high signal-to-noise ratio (SNR). In our transgenic YFP control subject, we observed a slight reduction of background and overall fluorescence at late-stages. For GCaMP6f-transduced RGCs, on the other hand, fluorescence showed a net rising trend overall, most likely due to continued expression of GCaMP6f. .
4.3. Cytomorbidity
Our findings demonstrate that fluorescence intensity, measured in vivo by imaging the fundus, generally reaches a plateau around 3–4 weeks post injection. At the time of this plateau, the responsive ratio decreases in vitro. Further investigation indicates that some of neurons with aberrant responses at that stage are those with GCaMP fluorescence appearing in the nucleus, while the others display relatively stable baseline fluorescence, resembling the results on cytomorbidity proposed in one of the first studies on GCaMP6 (17) and previous generations of GCaMP (3). Thus, virus-induced cytomorbidity most likely contributes to the in vitro reduction of the responsive ratio as well as the in vivo fluorescent intensity plateau at late times.
4.4. Limitations of Calcium imaging
One drawback to calcium imaging in studies of WT retina is that the excitation light causes bleaching of photoreceptors, which limits the applicability for studies involving light stimulation. To minimize photobleaching at photoreceptors while imaging calcium dynamics at inner retinal neurons, some groups have used two-photon (infrared) excitation which can be used to selectively excite fluorescence only in inner retinal neurons. For our studies, however, which rely on extracellular electrical stimulation (the method of stimulation with epiretinal prosthetic implants, such as the Argus II) of retinal neurons, even strong excitation light does not inhibit RGC or bipolar neuron responsiveness. Therefore, calcium imaging is still a valuable tool for investigating the spatial distribution of inner retinal neuron responsiveness in response to electrical stimulation.
Figure 2:
Calculation of normalized fluorescence intensity of individual cell. Locally selective fluorescence intensity was normalized by the green-field intensity from identical region of interest. (A) Group of cells selected from fluorescence fundus image. (B) Baseline captured from identical location of relevant greenfield image.
Figure 3:
Map of pAAV2-CAG-GCaMP. The CMV enhancer, chicken β-actin promoter (CBA promoter), exon, and intron collectively form the CAG promoter. Woodchuck hepatitis virus posttranscriptional regulatory element (WPRE) is placed downstream of the GCaMP6f transgene to increase protein translation. The cassette is flanked by adeno-associated virus type 2 (AAV2) inverted terminal repeats (TR).
5. Reference
- 1.Dombeck DA, Harvey CD, Tian L, Looger LL, Tank DW. Functional imaging of hippocampal place cells at cellular resolution during virtual navigation. Nature neuroscience. 2010;13(11):1433–40. [DOI] [PMC free article] [PubMed] [Google Scholar]
- 2.Mank M, Santos AF, Direnberger S, Mrsic-Flogel TD, Hofer SB, Stein V, et al. A genetically encoded calcium indicator for chronic in vivo two-photon imaging. Nature methods. 2008;5(9):805–11. [DOI] [PMC free article] [PubMed] [Google Scholar]
- 3.Weitz AC, Behrend MR, Lee NS, Klein RL, Chiodo VA, Hauswirth WW, et al. Imaging the response of the retina to electrical stimulation with genetically encoded calcium indicators. J Neurophysiol. 2013;109(7):1979–88. [DOI] [PMC free article] [PubMed] [Google Scholar]
- 4.Borghuis BG, Tian L, Xu Y, Nikonov SS, Vardi N, Zemelman BV, et al. Imaging light responses of targeted neuron populations in the rodent retina. The Journal of neuroscience : the official journal of the Society for Neuroscience. 2011;31(8):2855–67. [DOI] [PMC free article] [PubMed] [Google Scholar]
- 5.Zariwala HA, Borghuis BG, Hoogland TM, Madisen L, Tian L, De Zeeuw Cl et al. A Cre-dependent GCaMP3 reporter mouse for neuronal imaging in vivo. The Journal of neuroscience : the official journal of the Society for Neuroscience. 2012;32(9):3131–41. [DOI] [PMC free article] [PubMed] [Google Scholar]
- 6.Chen TW, Wardill TJ, Sun Y, Pulver SR, Renninger SL, Baohan A, et al. Ultrasensitive fluorescent proteins for imaging neuronal activity. Nature. 2013;499(7458):295–300. [DOI] [PMC free article] [PubMed] [Google Scholar]
- 7.Roorda A, Romero-Borja F, Donnelly lii W, Queener H, Hebert T, Campbell M. Adaptive optics scanning laser ophthalmoscopy. Optics express. 2002;10(9):405–12. [DOI] [PubMed] [Google Scholar]
- 8.Gray DC, Merigan W, Wolfing Jl, Gee BP, Porter J, Dubra A, et al. In vivo fluorescence imaging of primate retinal ganglion cells and retinal pigment epithelial cells. Optics express. 2006;14(16):7144–58. [DOI] [PubMed] [Google Scholar]
- 9.Leung CK, Lindsey JD, Crowston JG, Ju WK, Liu Q, Bartsch DU, et al. In vivo imaging of murine retinal ganglion cells. Journal of neuroscience methods. 2008;168(2):475–8. [DOI] [PubMed] [Google Scholar]
- 10.Koronyo-Hamaoui M, Koronyo Y, Ljubimov AV, Miller CA, Ko MK, Black KL, et al. Identification of amyloid plaques in retinas from Alzheimer’s patients and noninvasive in vivo optical imaging of retinal plaques in a mouse model. Neuroimage. 2011;54 Suppl 1:S204–17. [DOI] [PMC free article] [PubMed] [Google Scholar]
- 11.Dalkara D, Byrne LC, Lee T, Hoffmann NV, Schaffer DV, Flannery JG. Enhanced gene delivery to the neonatal retina through systemic administration of tyrosine-mutated AAV9. Gene therapy. 2012;19(2):176–81. [DOI] [PubMed] [Google Scholar]
- 12.Dreosti E, Esposti F, Baden T, Lagnado L. In vivo evidence that retinal bipolar cells generate spikes modulated by light. Nature neuroscience. 2011;14(8):951–2. [DOI] [PMC free article] [PubMed] [Google Scholar]
- 13.Bernardes R, Serranho P, Lobo C. Digital ocular fundus imaging: a review. Ophthalmologica Journal international d’ophtalmologie International journal of ophthalmology Zeitschrift fur Augenheilkunde. 2011;226(4):161–81. [DOI] [PubMed] [Google Scholar]
- 14.Schmitz-Valckenberg S, Holz FG, Bird AC, Spaide RF. Fundus autofluorescence imaging: review and perspectives. Retina. 2008;28(3):385–409. [DOI] [PubMed] [Google Scholar]
- 15.Paques M, Guyomard JL, Simonutti M, Roux MJ, Picaud S, Legargasson JF, et al. Panretinal, high-resolution color photography of the mouse fundus. Investigative ophthalmology & visual science. 2007;48(6):2769–74. [DOI] [PubMed] [Google Scholar]
- 16.Schejter A, Tsur L, Farah N, Reutsky-Gefen I, Falick Y, Shoham S. Cellular Resolution Panretinal Imaging of Optogenetic Probes Using a Simple Funduscope. Translational vision science & technology. 2012;1(2):4. [DOI] [PMC free article] [PubMed] [Google Scholar]
- 17.Chen T-W, Wardill TJ, Sun Y, Pulver SR, Renninger SL, Baohan A, et al. Ultrasensitive fluorescent proteins for imaging neuronal activity. Nature. 2013;499(7458):295–300. [DOI] [PMC free article] [PubMed] [Google Scholar]
- 18.Feng G, Mellor RH, Bernstein M, Keller-Peck C, Nguyen QT, Wallace M, et al. Imaging neuronal subsets in transgenic mice expressing multiple spectral variants of GFP. Neuron. 2000;28(1):41–51. [DOI] [PubMed] [Google Scholar]
- 19.Delori FC, Webb RH, Sliney DH, American National Standards I. Maximum permissible exposures for ocular safety (ANSI 2000), with emphasis on ophthalmic devices. Journal of the Optical Society of America A, Optics, image science, and vision. 2007;24(5):1250–65. [DOI] [PubMed] [Google Scholar]
- 20.Klein RL, Hamby ME, Gong Y, Hirko AC, Wang S, Hughes JA, et al. Dose and promoter effects of adeno-associated viral vector for green fluorescent protein expression in the rat brain. Experimental neurology. 2002;176(1):66–74. [DOI] [PubMed] [Google Scholar]
- 21.Wu K, Klein RL, Meyers CA, King MA, Hughes JA, Millard WJ, et al. Long-term neuronal effects and disposition of ectopic preproNGF gene transfer into the rat septum. Human gene therapy. 2003;14(15):1463–72. [DOI] [PubMed] [Google Scholar]
- 22.Niwa H, Yamamura K, Miyazaki J. Efficient selection for high-expression transfectants with a novel eukaryotic vector. Gene. 1991;108(2):193–9. [DOI] [PubMed] [Google Scholar]
- 23.Loeb JE, Cordier WS, Harris ME, Weitzman MD, Hope TJ. Enhanced expression of transgenes from adeno-associated virus vectors with the woodchuck hepatitis virus posttranscriptional regulatory element: implications for gene therapy. Human gene therapy. 1999;10(14):2295–305. [DOI] [PubMed] [Google Scholar]
- 24.Zolotukhin S, Byrne BJ, Mason E, Zolotukhin I, Potter M, Chesnut K, et al. Recombinant adeno-associated virus purification using novel methods improves infectious titer and yield. Gene therapy. 1999;6(6):973–85. [DOI] [PubMed] [Google Scholar]
- 25.Sung Cheol P, Min Kyu P, Moon Gi K. Super-resolution image reconstruction: a technical overview. IEEE Signal Processing Magazine. 2003;20(3):21–36. [Google Scholar]
- 26.Swedlow JR. Quantitative fluorescence microscopy and image deconvolution. Methods in cell biology. 2013;114:407–26. [DOI] [PubMed] [Google Scholar]
- 27.Patterson GH, Piston DW. Photobleaching in two-photon excitation microscopy. Biophysical journal. 2000;78(4):2159–62. [DOI] [PMC free article] [PubMed] [Google Scholar]
- 28.Jl Morgan, Pugh EN Jr. Scanning laser ophthalmoscope measurement of local fundus reflectance and autofluorescence changes arising from rhodopsin bleaching and regeneration. Investigative ophthalmology & visual science. 2013;54(3):2048–59. [DOI] [PMC free article] [PubMed] [Google Scholar]


