

Abstract
Understanding of the oral microbiome in relation to periodontal disease in older adults is limited. The composition and diversity of the subgingival microflora and their oligotypes in health and levels of periodontal disease were investigated in this study on older postmenopausal women. The 16S rRNA gene was sequenced using the Illumina MiSeq platform in 1,206 women aged 53 to 81 y. Presence and severity of periodontal disease were defined by Centers for Disease Control and Prevention/American Academy of Periodontology criteria. Composition of the microbiome was determined by 16S rRNA amplicon sequencing and the abundance of taxa described by the centered log2-ratio (CLR) transformed operational taxonomic unit (OTU) values. Differences according to periodontal disease status were determined by analysis of variance with Bonferroni correction. Bacteria oligotypes associated with periodontal disease and health were determined by minimum entropy decomposition and their functions estimated in silico using PICRUSt. Prevalence of none/mild, moderate, and severe periodontal disease was 25.1%, 58.3%, and 16.6%, respectively. Alpha diversity of the microbiome differed significantly across the 3 periodontal disease categories. β-Diversity differed between no/mild and severe periodontal disease, although considerable overlap was noted. Of the 267 bacterial species identified at ≥0.02% abundance, 56 (20.9%) differed significantly in abundance according to periodontal disease status. Significant linear correlations for pocket depth and clinical attachment level with bacterial amounts were observed for several taxa. Of the taxa differing in abundance according to periodontal disease status, 53% had multiple oligotypes appearing to differ between none/mild and severe periodontal disease. Among older women, taxonomic differences in subgingival microbiome composition and diversity were observed in relation to clinical periodontal disease measures. Potential differences in bacterial subspecies (oligotypes) and their function were also identified in periodontal disease compared with health.
Keywords: next-generation sequencing, oligotypes, oral health, microbiology, bacteria, menopause
Introduction
The microbiome in the oral cavity is one of the most complex and diverse human microbiomes, with at least 700 bacterial species identified (Dewhirst et al. 2010; Human Microbiome Project Consortium 2012). Several of these bacteria have important roles in maintaining oral health and normal function (Jenkinson and Lamont 2005). Shifts in the oral microbiota ecology can lead to oral diseases such as caries, gingivitis, and periodontal disease (Teles et al. 2013; Wang 2015). A series of studies comparing the subgingival microbiome of individuals with varying levels of periodontal disease have been carried out, and they report a distinct difference in the composition of the microflora of healthy sites compared to those affected with periodontal disease (Perez-Chaparro et al. 2014; Patini et al. 2018). These studies have identified subgingival organisms by cultural, targeted checkerboard and nontargeted 16S rRNA gene sequencing. Significantly different composition of the subgingival microflora comparing healthy sites to those exhibiting periodontal disease is found by all of these methods.
The taxonomic resolution of the microflora of healthy and periodontal disease sites is markedly advanced by use of nontargeted next-generation sequencing, but these methods are limited by use of de novo clustering methods in which sequences that were more than 97% similar (Dewhirst et al. 2010) are grouped into operational taxonomic units (OTUs). While providing opportunity to identify taxonomic differences between individuals differing on periodontal disease status, this approach is rather blunt and does not provide understanding of bacterial subspecies variation that could have relevance for specific patterns of disease characteristics compared with health. Eren and coworkers (Eren et al. 2015) devised a system to differentiate between closely related microbial taxa using 16S rRNA gene data, referred to as minimum entropy decomposition (MED). When applied to analysis of human oral microbiome data, it revealed differences of oligotypes (e.g., subspecies) in taxa separated by sequence variation of less than 1%. We have applied the 16S rRNA amplicon method to a study of the subgingival microbiota in postmenopausal women who exhibited periodontal health and a range of periodontal disease presence and severity based on clinical probing measures (Banack et al. 2018). In an earlier study on a small subset of these women, we observed considerable heterogeneity of oligotypes in the subgingival microflora between those with none/mild compared to severe periodontal disease (LaMonte et al. 2018). Based on these results, we hypothesize that oligotypes indicative of subspecies in health will be different from those in periodontal disease, and comparison of these strains would lead to a better understanding of the role these organisms have in the pathogenesis of periodontal disease in later life. This has important relevance to the field of clinical periodontology as well as to public health, given the expected doubling in numbers of older adults between 2010 and 2050 (Griffin et al. 2012) and the dearth of studies on the oral microbiome and its relationship with periodontal disease in older adults (Feres et al. 2016).
The objective of the present study was to investigate the composition and diversity of the subgingival microbiota at the taxon and oligotype levels, as well as its association with presence and severity of clinical periodontal disease in a cohort of community-dwelling older postmenopausal women who were not selected into the study on the basis of periodontal disease status.
Materials and Methods
Study Cohort
Participants were postmenopausal women initially enrolled in 1993 to 1998 in the Women’s Health Initiative Observational Study (WHIOS; N = 2,249; ages 50 to 79 y) at the Buffalo, New York, Clinical Center, who then further enrolled in 1997 to 2001 into the ancillary Buffalo Osteoporosis and Periodontal Disease Study (OsteoPerio; N = 1,362; ages 53 to 81 y). Details of the WHIOS and OsteoPerio studies have been published (Langer et al. 2003; LaMonte et al. 2013; Banack et al. 2018). Periodontal disease status was not a criterion for study inclusion or exclusion. A total of 1,342 women participated in the baseline OsteoPerio study (1997 to 2001), of whom 1,206 had available subgingival microbiome and periodontal disease measures required for the present analysis. Figure 1 shows the flow of participant enrollment into the OsteoPerio study. Questionnaire assessments were used to obtain information on sociodemographic characteristics, personal medical histories, lifestyle factors, oral hygiene habits, and medication use. Neighborhood socioeconomic status was characterized using aggregate census tract information to compute a score ranging from 0 to 100, with higher scores indicating more affluent tracts (Dubowitz et al. 2012). Height (cm) and weight (kg) were measured using a calibrated clinical scale and stadiometer; body mass index (BMI; kg/m2) was calculated. The University at Buffalo Institutional Review Board approved all study protocols, and written informed consent was obtained from participants. This study conformed to STROBE guidelines for human observational studies.
Figure 1.
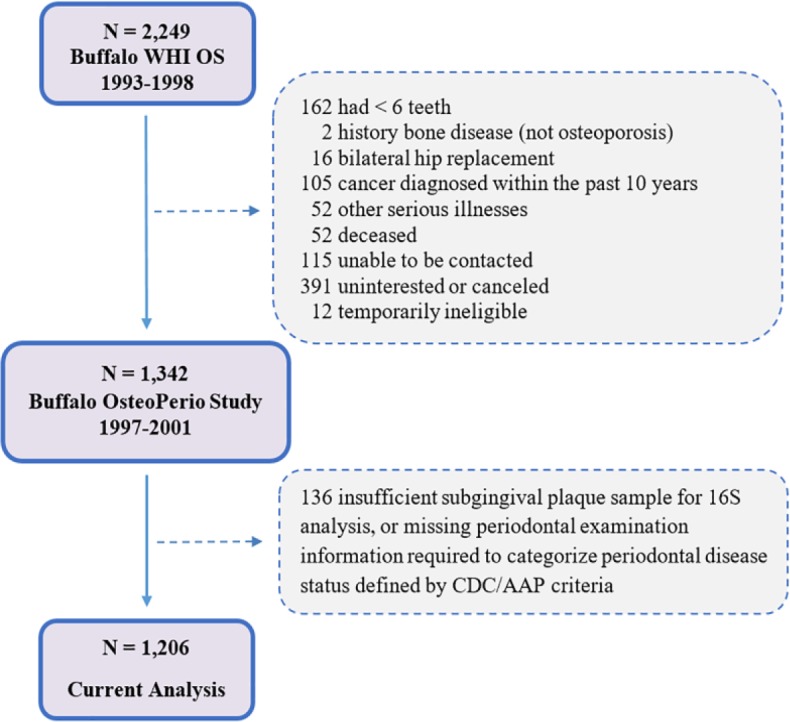
Flowchart had of participants into the Buffalo OsteoPerio study cohort. Adapted from Banack et al. (2018). AAP, American Academy of Periodontology; CDC, Centers for Disease Control and Prevention; WHIOS, Women’s Health Initiative Observational Study.
Periodontal Assessment and Subgingival Plaque Samples
Participants completed a whole-mouth clinical dental examination (LaMonte et al. 2013; Banack et al. 2018). Presence and severity of clinical periodontal disease were determined from whole-mouth mean pocket depth (PD) and clinical attachment level (CAL) measurements, based on Centers for Disease Control and Prevention (CDC)/American Academy of Periodontology (AAP) criteria to define none, mild, moderate, and severe periodontal disease (Eke et al. 2012). Mild is defined as ≥2 interproximal sites with ≥3 mm CAL and ≥2 interproximal sites with ≥4 mm PD (not on same tooth) or 1 site with ≥5 mm PD. Moderate is defined as ≥2 interproximal sites with ≥4 mm CAL (not on same tooth) or ≥2 interproximal sites with ≥5 mm PD (not on same tooth). Severe is defined as ≥2 interproximal sites with ≥6 mm CAL (not on same tooth) and ≥1 interproximal site with ≥5 mm PD. None is defined as no evidence of mild, moderate, or severe disease. Because the frequency of mild periodontal disease by this definition was too low in our sample for separate analysis (1%), none and mild were combined for analyses. Subgingival plaque samples were obtained using fine paper points and frozen immediately at −80°C, following a protocol designed for this study (Brennan et al. 2007).
Subgingival Microbiome Analysis
The procedures used to characterize the subgingival microbiome have been published (Banack et al. 2018). Briefly, genomic DNA was isolated using an automated system. DNA extracted material was quantified with most samples yielding average concentrations between 0.3 and 2 ng/µL. Metagenomic DNA was amplified using the 16S V3 (341F) forward and V4 (805R) reverse primer pairs with added Illumina adapter overhang nucleotide sequences. Polymerase chain reaction (PCR) amplifications and sequencing were performed on 96 samples at a time with both positive controls (mock DNA, subgingival plaque pools) and negative controls (PCR-grade water, extraction buffer). Samples were multiplexed and 300 bp pair-end sequenced on an Illumina MiSeq. Sequences were clustered at 97% identity against the Human Oral Microbiome Database (HOMD) version 14.5 (Chen et al. 2010) with BLAST (Altschul et al. 1990) aiming at the species level. Sequences that failed to match the database were discarded. As a preprocessing step, we require a “merge rate” ≥90%, “pass rate” ≥60%, and “hit count” per sample ≥3,000; samples failing to meet the criterion were removed. The raw OTU table was filtered at a frequency <0.02% of the total read count. Batches of 85 to 88 test samples were processed together, randomly arranged on the 96-well plates with negative and positive quality control samples to minimize batch effects.
Additional detail on the study protocol is provided in the Appendix.
Statistical Analysis
We first normalized individual OTU relative abundance using a centered log2-ratio (CLR) transformation, which helps to account for the complex compositional data structure, reduce the likelihood of spurious correlations, and enhance the meaningfulness of subcomposition comparisons (Gloor et al. 2017). The CLR distribution of each OTU was approximately normal and the variances in groups were similar by visual inspection. Microbial diversity between groups was determined using α-diversity (rarefaction curve, Chao1 Index [richness] and Shannon Index [evenness]) and β-diversity (principal component analysis [PCA]) analysis (Caporaso et al. 2010). The t tests were used to evaluate differences in α-diversity, and PERMANOVA was used to evaluate differences in β-diversity. Comparisons of CLR mean microbial abundance between periodontal disease categories were performed using analysis of variance and corrected for multiple comparisons by the Bonferroni method (Mert et al. 2018). Because the CLR distributions were approximately normal and linearity of the associations between CLR OTUs and periodontal disease measures was verified in scatterplots, linear relationships for CLR microbiota abundance with probing pocket depth and clinical attachment level were evaluated using Pearson product-moment correlations. To provide comparability with previous studies, we also describe microbiome diversity based on prevalence (presence of a taxon regardless of relative composition).
To understand the potential functional characteristics of the subgingival microbiota associated with periodontal disease and health, we completed an in silico analysis using PICRUSt (version 1.1.1), a computational algorithm that predicts potential functions based on 16S rRNA sequence information (Langille et al. 2013). To further determine probabilistically which potential functional pathways are enriched with OTUs observed in our study samples, enrichment analysis was performed on level 3 Kyoto Encyclopedia of Genes and Genomes (KEGG) pathways (Kanehisa and Goto 2000) using a hypergeometric distribution. Level 3 pathways were reported as significant if they contained at least 10 functions and a corrected P < 0.05. This resulted in 8 potentially relevant pathways, reported herein.
MED was performed using the oligotyping pipeline v2.1 to predict whether subspecies or strain differences might exist in organisms that differ according to periodontal disease status (Eren et al. 2015). We report uncorrected 2-tailed P values and indicate which are statistically significant after Bonferroni correction. Analyses were performed using SAS version 9.4 (SAS Institute).
Results
The study cohort was, on average, 66 y of age; had 23 teeth present; and had mean PD, CAL, and percentage of sites with gingival bleeding of 2.2 mm, 2.4 mm, and 34%, respectively (Table 1). The mean BMI was 26.6 kg/m2, consistent with being clinically overweight. The majority (97%) of women were white, 48% reported current hormone therapy use, 3% reported current smoking, and 5% reported a history of diagnosed and treated diabetes. A high proportion of women reported tooth brushing at least twice a day (77%) and dental visits at least once a year (92%). The prevalence of none/mild, moderate, and severe periodontal disease, defined by CDC/AAP criteria, was 25.1%, 58.3%, and 16.6%, respectively (Table 1). Age, current smoking, and mean PD, CAL, and gingival bleeding all were positively associated (P < .01), and socioeconomic status was inversely associated (P = .004), with clinical periodontal status.
Table 1.
Baseline Characteristics of the OsteoPerio Microbiome Study Participants for the Overall Cohort and According to Periodontal Disease Presence and Severity.
| Characteristic | Periodontal Disease Categorya |
||||
|---|---|---|---|---|---|
| Overall (N = 1,206) | None/Mild (n = 303) | Moderate (n = 703) | Severe (n = 200) | P Valueb | |
| Age (y) | 66.1 ± 7.0 | 65.0 ± 6.9 | 66.5 ± 7.0 | 66.6 ± 7.1 | <0.05 |
| BMI (kg/m2) | 26.6 ± 5.1 | 26.9 ± 5.0 | 26.4 ± 5.1 | 26.7 ± 5.2 | 0.25 |
| Neighborhood SES (units) | 76.2 ± 6.9 | 76.5 ± 6.6 | 76.5 ± 6.7 | 74.7 ± 7.6 | <0.01 |
| Race-ethnicity: White | 1,174 (97.4) | 292 (96.4) | 690 (98.2) | 192 (96.0) | 0.32 |
| Current smoking | 39 (3.2) | 5 (1.7) | 23 (3.3) | 11 (5.5) | <.001 |
| Treated diabetes | 63 (5.2) | 17 (5.6) | 36 (5.1) | 10 (5.0) | 0.94 |
| Treated hypertension | 387 (32.1) | 99 (32.7) | 217 (30.9) | 71 (35.5) | 0.45 |
| Treated high cholesterol | 199 (16.5) | 54 (17.9) | 115 (16.4) | 30 (15.0) | 0.69 |
| Osteoporosisc | 467 (38.7) | 106 (35.0) | 290 (41.3) | 71 (35.5) | 0.15 |
| Current hormone therapy | 579 (48.1) | 162 (53.5) | 326 (46.4) | 91 (45.5) | 0.20 |
| Brush teeth ≥2 times/d | 934 (77.4) | 227 (74.9) | 553 (78.7) | 154 (77.0) | 0.42 |
| Dental visit ≥1 time/y | 1,107 (91.8) | 280 (92.4) | 647 (92.0) | 180 (90.0) | 0.59 |
| Number of teeth present | 23.2 ± 5.3 | 23.0 ± 5.9 | 23.3 ± 5.2 | 23.3 ± 4.5 | 0.59 |
| Pocket depth (mm) | 2.2 ± 0.4 | 1.9 ± 0.2 | 2.2 ± 0.3 | 2.6 ± 0.4 | <0.001 |
| Clinical attachment level (mm) | 2.4 ± 0.7 | 1.8 ± 0.3 | 2.4 ± 0.5 | 3.2 ± 0.8 | <0.001 |
| Percent of sites bleeding | 34.2 ± 22.9 | 28.7 ± 19.4 | 34.7 ± 22.6 | 40.7 ± 26.8 | <0.001 |
Data are mean ± SD or n (%).
BMI, body mass index; SES, socioeconomic status.
Defined according Centers for Disease Control and Prevention/American Academy of Periodontology criteria (Eke et al. 2012).
Differences across groups determined by analysis of variance (continuous) or chi-squared (categorical) tests.
Osteoporosis was defined according to worst T-score from a multisite dual-energy X-ray absorptiometry scan.
A total of 267 bacterial taxa were identified in the subgingival plaque samples of the overall cohort after filtering at ≥0.02% abundance (Table 2 and Appendix Table 1). Figure 2A–D shows results for microbial α- and β-diversity analyses for these 267 bacterial taxa according to periodontal status. Rarefaction curves (α-diversity; Fig. 2A) showed that a significantly greater number of OTUs were observed with increasing severity of periodontal disease (corrected P < .05, all comparisons). Further evidence of significant α-diversity is provided by the significant differences in Chao1 Index (richness; Fig. 2B) and Shannon Index (evenness; Fig. 2C) according to periodontal status (corrected P < .05, all comparisons). The PCA plots (Fig. 2D) indicated statistically significant differences in β-diversity of bacterial species between the severe and non/mild periodontal disease groups (corrected P < .05), although considerable overlap is present.
Table 2.
The 56 Taxa That Were Significantly Different across Categories of Periodontal Disease Presence and Severity.
| OTU Label | Periodontal Disease Categorya |
Whole-Mouth Mean |
||||||
|---|---|---|---|---|---|---|---|---|
| None/Mild(n = 303) | Moderate(n = 703) | Severe(n = 200) | PD |
CAL |
||||
| Meanb (SE) | Meanb (SE) | Meanb (SE) | P Valuec | r d | P Valuec | r d | P Value | |
| 36 taxa elevated in severe and moderate periodontal disease | ||||||||
| Fretibacterium fastidiosum | 0.16 (0.17) | 1.23 (0.13) | 3.26 (0.25) | <0.0001e,f,g | 0.314 | <0.001 | 0.175 | <0.001 |
| Tannerella forsythia | 0.71 (0.18) | 1.82 (0.13) | 3.77 (0.24) | <0.0001e,f,g | 0.266 | <0.001 | 0.171 | <0.001 |
| Fretibacterium HMT 360 | 1.73 (0.20) | 2.72 (0.14) | 4.77 (0.25) | <0.0001e,f,g | 0.287 | <0.001 | 0.179 | <0.001 |
| Fretibacterium HMT 359 | –0.85 (0.17) | 0.02 (0.14) | 2.09 (0.30) | <0.0001e,f,g | 0.269 | <0.001 | 0.171 | <0.001 |
| Porphyromonas gingivalis | –1.58 (0.19) | –0.64 (0.15) | 1.28 (0.37) | <0.0001e,f,g | 0.177 | <0.001 | 0.157 | <0.001 |
| Desulfobulbus HMT 041 | –1.49 (0.17) | –0.76 (0.12) | 0.98 (0.26) | <0.0001e,f,g | 0.214 | <0.001 | 0.164 | <0.001 |
| Anaerolineae_[G-1] HMT 439 | –2.83 (0.10) | –2.32 (0.09) | –0.41 (0.26) | <0.0001e,f,g | 0.210 | <0.001 | 0.198 | <0.001 |
| Treponema denticola | –1.16 (0.17) | –0.35 (0.13) | 1.20 (0.30) | <0.0001e,f,g | 0.188 | <0.001 | 0.108 | 0.05 |
| Dialister pneumosintes | –0.36 (0.16) | 0.56 (0.12) | 1.82 (0.23) | <0.0001e,f,g | 0.248 | <0.001 | 0.098 | 0.17 |
| Peptostreptococcaceae_[XI][G-6] [Eubacterium]_noda | –2.47 (0.11) | –1.84 (0.10) | –0.43 (0.23) | <0.0001e,f,g | 0.220 | <0.001 | 0.146 | <0.001 |
| Treponema maltophilum | –1.33 (0.13) | –0.53 (0.10) | 0.67 (0.22) | <0.0001e,f,g | 0.245 | <0.001 | 0.199 | <0.001 |
| Selenomonas HMT 134 | 0.19 (0.18) | 0.60 (0.13) | 2.12 (0.25) | <0.0001e,f | 0.238 | <0.001 | 0.066 | 1.00 |
| Treponema socranskii | 1.44 (0.14) | 2.22 (0.10) | 3.35 (0.17) | <0.0001e,f,g | 0.278 | <0.001 | 0.174 | <0.001 |
| Fretibacterium HMT 362 | –1.93 (0.14) | –1.64 (0.10) | –0.03 (0.25) | <0.0001e,f | 0.262 | <0.001 | 0.167 | <0.001 |
| Pseudoramibacter alactolyticus | –2.18 (0.14) | –1.84 (0.10) | –0.37 (0.26) | <0.0001e,f | 0.183 | <0.001 | 0.155 | <0.001 |
| Streptococcus constellatus | –0.26 (0.18) | 0.28 (0.13) | 1.47 (0.26) | <0.0001e,f | 0.185 | <0.001 | 0.140 | <0.001 |
| Porphyromonas endodontalis | –0.11 (0.21) | 0.50 (0.16) | 1.53 (0.32) | 0.01e,f | 0.194 | <0.001 | 0.073 | 1.00 |
| Anaeroglobus geminatus | 1.45 (0.20) | 2.12 (0.14) | 3.09 (0.23) | 0.0007e,f,g | 0.120 | 0.008 | 0.086 | 0.73 |
| Veillonellaceae_[G-1] HMT 150 | 0.63 (0.18) | 1.18 (0.12) | 2.22 (0.21) | <0.0001e,f,g | 0.162 | <0.001 | 0.071 | 1.00 |
| Prevotella intermedia | –1.98 (0.16) | –1.39 (0.15) | –0.42 (0.32) | 0.009e,f | 0.078 | 1.00 | 0.081 | 1.00 |
| Bacteroidaceae_[G-1] HMT 272 | –2.58 (0.11) | –2.27 (0.09) | –1.04 (0.23) | <0.0001e,f | 0.178 | <0.001 | 0.150 | <0.001 |
| Lachnospiraceae_[G-8] HMT 500 | –2.49 (0.10) | –1.98 (0.09) | –0.96 (0.22) | <0.0001e,f,g | 0.211 | <0.001 | 0.115 | 0.02 |
| TM7_[G-1] HMT 349 | 2.38 (0.21) | 2.98 (0.13) | 3.90 (0.23) | 0.002e,f,g | 0.137 | <0.001 | 0.075 | 1.00 |
| Filifactor alocis | –1.30 (0.18) | –1.10 (0.13) | 0.16 (0.31) | 0.003e,f | 0.160 | <0.001 | 0.084 | 0.89 |
| Peptostreptococcaceae_[XI][G-5] [Eubacterium]_saph | –2.56 (0.12) | –2.31 (0.10) | –1.16 (0.24) | <0.0001e,f | 0.189 | <0.001 | 0.121 | 0.007 |
| Prevotella dentalis | –2.05 (0.13) | –1.82 (0.10) | –0.65 (0.27) | <0.0001e,f | 0.208 | <0.001 | 0.088 | 0.56 |
| TM7_[G-5] HMT 356 | 0.11 (0.20) | 0.33 (0.14) | 1.48 (0.28) | 0.02e,f | 0.143 | <0.001 | 0.025 | 1.00 |
| Veillonellaceae_[G-1] HMT 145 | –2.19 (0.13) | –2.03 (0.10) | –0.89 (0.23) | <0.0001e,f | 0.134 | <0.001 | 0.105 | 0.07 |
| Prevotella oralis | –0.52 (0.19) | –0.11 (0.13) | 0.76 (0.24) | 0.03e,f | 0.113 | 0.023 | 0.090 | 0.45 |
| Prevotella HMT 526 | –2.80 (0.11) | –2.76 (0.08) | –1.58 (0.24) | <0.0001e,f | 0.152 | <0.001 | 0.111 | 0.03 |
| Johnsonella HMT 166 | –3.08 (0.08) | –2.89 (0.08) | –1.94 (0.22) | <0.0001e,f | 0.133 | <0.001 | 0.114 | 0.02 |
| Prevotella baroniae | –2.46 (0.11) | –2.08 (0.10) | –1.33 (0.22) | 0.001e,f | 0.157 | <0.001 | 0.073 | 1.00 |
| Fusobacterium nucleatum_subsp._vincentii | 5.86 (0.16) | 6.51 (0.10) | 6.96 (0.17) | 0.004e,g | 0.127 | 0.003 | 0.072 | 1.00 |
| Fretibacterium HMT 361 | –3.24 (0.07) | –3.09 (0.07) | –2.18 (0.23) | <0.0001e,f | 0.131 | 0.001 | 0.113 | 0.02 |
| Parvimonas micra | 3.76 (0.16) | 4.39 (0.10) | 4.77 (0.16) | 0.01e,g | 0.115 | 0.016 | 0.115 | 0.02 |
| Fretibacterium HMT 358 | –3.04 (0.09) | –2.97 (0.08) | –2.17 (0.23) | 0.006e,f | 0.117 | 0.012 | 0.096 | 0.22 |
| 20 taxa elevated in none/mild periodontal disease | ||||||||
| Microbacterium flavescens | –2.60 (0.08) | –2.92 (0.06) | –3.21 (0.10) | 0.008e,f,g | –0.160 | <0.001 | –0.064 | 1.00 |
| Sphingomonas HMT 006 | –3.27 (0.07) | –3.58 (0.05) | –3.89 (0.09) | <0.0001e,f,g | –0.229 | <0.001 | –0.086 | 0.76 |
| Leptothrix HMT 025 | –3.20 (0.07) | –3.53 (0.05) | –3.84 (0.09) | <0.0001e,f,g | –0.208 | <0.001 | –0.086 | 0.74 |
| Atopobium HMT 416 | –3.09 (0.10) | –3.40 (0.06) | –3.76 (0.12) | 0.02e,f,g | –0.189 | <0.001 | –0.078 | 1.00 |
| Porphyrobacter tepidarius | –3.30 (0.07) | –3.60 (0.05) | –3.97 (0.08) | <0.0001e,f,g | –0.238 | <0.001 | –0.110 | 0.04 |
| Brevundimonas diminuta | –3.01 (0.08) | –3.31 (0.05) | –3.72 (0.09) | <0.0001e,f,g | –0.206 | <0.001 | –0.074 | 1.00 |
| Actinomyces naeslundii | 4.09 (0.12) | 3.92 (0.08) | 3.30 (0.15) | 0.03e,f | –0.150 | <0.001 | –0.098 | 0.18 |
| Mitsuokella HMT 521 | –2.55 (0.12) | –2.91 (0.07) | –3.44 (0.11) | 0.001e,f,g | –0.089 | 0.51 | –0.078 | 1.00 |
| Streptococcus oralis | 8.31 (0.11) | 8.15 (0.07) | 7.41 (0.13) | <0.0001e,f | –0.160 | <0.001 | –0.090 | 0.48 |
| Capnocytophaga HMT 324 | –1.84 (0.15) | –2.32 (0.09) | –2.77 (0.17) | 0.04e,g | –0.099 | 0.16 | –0.055 | 1.00 |
| Actinomyces massiliensis | 1.62 (0.14) | 1.49 (0.09) | 0.66 (0.17) | 0.003e,f | –0.150 | <0.001 | –0.121 | 0.007 |
| Haemophilus parahaemolyticus | –1.85 (0.16) | –2.32 (0.10) | –2.85 (0.17) | 0.05e,f,g | –0.115 | 0.017 | –0.076 | 1.00 |
| Sphingomonas echinoides | –1.44 (0.13) | –2.00 (0.09) | –2.52 (0.15) | 0.0002e,f,g | –0.161 | <0.001 | –0.120 | 0.008 |
| Gemella haemolysans | 2.57 (0.17) | 2.11 (0.11) | 1.43 (0.21) | 0.04e,f | –0.022 | 1.00 | –0.037 | 1.00 |
| Streptococcus HMT 056 | –0.15 (0.17) | –0.37 (0.11) | –1.34 (0.20) | 0.004e,f | –0.155 | <0.001 | –0.056 | 1.00 |
| Pseudomonas fluorescens | –1.47 (0.16) | –2.10 (0.10) | –2.69 (0.16) | 0.0003e,f,g | –0.171 | <0.001 | –0.108 | 0.04 |
| Haemophilus parainfluenzae | 4.07 (0.18) | 3.90 (0.11) | 2.79 (0.22) | 0.0009e,f | –0.127 | 0.003 | –0.065 | 1.00 |
| Leptotrichia goodfellowii | –1.75 (0.14) | –2.09 (0.10) | –3.06 (0.15) | <0.0001e,f | –0.160 | <0.001 | –0.142 | <0.001 |
| Rothia aeria | 2.86 (0.18) | 2.05 (0.12) | 1.30 (0.23) | <0.0001e,f,g | –0.128 | 0.002 | –0.152 | <0.001 |
| Lautropia mirabilis | 1.69 (0.17) | 0.81 (0.11) | 0.03 (0.22) | <0.0001e,f,g | –0.143 | <0.001 | –0.153 | <0.001 |
Those elevated in severe and moderate disease compared with none/mild are at the top of the table above the dashed horizontal line.
CAL, clinical attachment level; OTU, operational taxonomic unit; PD, pocket depth.
Defined according to Centers for Disease Control and Prevention/American Academy of Periodontology criteria (Eke et al. 2012).
Mean centered log2-ratio transformed OTU.
P value for omnibus test of difference across categories corrected for multiple testing using the Bonferroni method.
Pearson product-moment correlation coefficient.
Significant pairwise difference between severe and none/mild after correction for multiple comparisons.
Significant pairwise difference between severe and moderate after correction for multiple comparisons.
Significant pairwise difference between moderate and none/mild after correction for multiple comparisons.
Figure 2.

Diversity analysis shows increasing diversity with increasing severity of periodontitis, with α- and β- diversity analysis according to categories of periodontitis. The α-diversity is given in (A) rarefaction curves, (B) Chao1 Richness Index, and (C) Shannon Evenness Index. The β-diversity is given in (D) principal component analysis plot of weighted UniFrac distances. P values provided on each plot are for the indicated comparisons. CDC/AAP, categories of periodontal disease presence and severity as defined by Centers for Disease Control and Prevention/American Academy of Periodontology criteria (Eke et al. 2012); OTU, operational taxonomic unit.
Statistically significant differences according to periodontal disease status were observed for 56 (20.9%) of the total 267 species identified (Table 2). Of these 56 bacteria, there were 36 identified as being significantly higher in severe compared with none/mild and in severe compared with moderate (corrected P < 0.05; Table 2). Fretibacterium fastidiosum demonstrated the largest difference between severe (CLR mean, 3.26) and none/mild (CLR mean, 0.16), as well as between severe and moderate (CLR mean, 1.23) periodontal disease. The 3 classical periodontal pathogens were the second (Tannerella forsythia), fifth (Porphyromonas gingivalis), and eighth (Treponema denticola) ranked species based on magnitude of differences for these same periodontal disease group comparisons (corrected P < .001, each). Sixteen (44.4%) of the 36 organisms observed to be higher in severe periodontal disease also demonstrated significantly higher abundance in moderate compared with none/mild (corrected P < .05). Of the 56 taxa that differed according to periodontal disease categories, 20 were significantly higher in none/mild compared with moderate and severe periodontal disease (corrected P < .05; Table 2). Lautropia mirabilis demonstrated the largest difference between none/mild and severe periodontal disease (CLR mean, 1.69 vs. 0.03), followed by Rothia aeria (CLR mean, 2.86 vs. 1.30) and Leptotrichia goodfellowii (CLR mean, −1.75 vs. −3.06). Comparisons of CLR mean OTUs according to categories of periodontal disease for the 211 taxa that were not significantly different across categories of periodontal disease are given in Appendix Table 1.
We next evaluated the linear correlations for each CLR mean OTU with PD and CAL measures. These results are shown in Table 2 for the 56 bacteria differing by periodontal disease categories and in Appendix Table 1 for the other 211 taxa. Correlations tended to be stronger with PD than with CAL. Pearson correlations ranged from −0.23 to 0.31 for PD and from −0.15 to 0.19 for CAL. Statistical significance (corrected P < .05) was achieved for 102 (38.2%) correlations with PD and 33 (12.4%) with CAL.
We next describe the subgingival microbiome according to prevalence for the 267 taxa identified in our cohort, according to periodontal disease categories in Appendix Table 2. Three taxa, Veillonella dispar, Veillonella parvula, and Streptococcus oralis, were 100% prevalent in each periodontal disease category. Treponema HMT 247 was least prevalent (2.6% to 7.5%) across periodontal disease categories. Anaerolinea_[G-1] HMT 439 demonstrated the largest difference in prevalence between severe (56.6%) and none/mild (16.2%; corrected P < .05). Prevalence of the 3 classical periodontal pathogens (T. forsythia, P. gingivalis, T. denticola) increased across worsening periodontal disease categories. The highest prevalence was for T. forsythia (77.6%, 82.4%, 92.5%; corrected P < .05), whereas prevalence was, overall, lower but still positively correlated with periodontal disease status for P. gingivalis (46.2%, 56.3%, 65.5%; corrected P < .05) and T. denticola (48.2%, 55.9%, 67%; corrected P < .05). The prevalence of bacteria associated with the healthy periodontium was high and differed minimally according to periodontal category: for example, Streptococcus gordonii: 98.0%, 99.4%, 99.0% (corrected P = .11); Streptococcus sanguinis: 99.0%, 99.3%, 100% (corrected P = .39).
Results of the in silico PICRUSt analysis to predict potential functional pathways enriched in periodontal disease and health resulted in 4 statistically significant pathways identified in severe periodontal disease and another 4 in none/mild. Bacterial motility (corrected P = .03), sporulation (corrected P < .001), methane metabolism (corrected P = .05), and histidine kinase (corrected P = .02) were enriched in women with severe periodontal disease. Toluene degradation (corrected P < .01), ion coupled transporters (corrected P = .04), oxidative phosphorylation (corrected P = .01), and amino acid degradation (corrected P < .001) were enriched in women with none/mild periodontal disease. The results of the entire PICRUSt analysis are available upon request to the corresponding author.
MED analysis (oligotyping) was used to explore the potential existence of subspecies for the identified 56 subgingival taxa that differed significantly in abundance according to periodontal disease category. Eleven of these bacteria did not show evidence of subspecies (data not shown). For the other 45 bacterial taxa, evidence of subspecies differences was observed as shown in Figure 3. Of these, 21 showed evidence of 1 or 2 detectable oligotypes, and the remaining 24 showed multiple oligotypes. Among those taxa with multiple oligotypes, several showed unique oligotypes (e.g., subspecies) in periodontal disease that were absent in the microflora of healthy. This can be seen, for example, for P. gingivalis and Prevotella intermedia, which show evidence of multiple oligotypes different between health and periodontal disease.
Figure 3.

Oligotypes of the 45 subgingival organisms significantly elevated in periodontal disease or health. The color bars represent the oligotypes. The black bars at the bottom show the relative abundance. Periodontal disease category designations are 0/1, none/mild; 2, moderate; and 3, severe defined by Centers for Disease Control and Prevention/American Academy of Periodontology criteria (Eke et al. 2012).
Discussion
To our knowledge, a study of this size and scope using untargeted sequencing of the oral microbiome in older women has not been published previously. Several principal findings deserve comment. First, we confirm previous subgingival microbiome studies conducted using targeted (Haffajee et al. 1998; Socransky et al. 1998; Kumar et al. 2003; Tettamanti et al. 2017) and nontargeted measurement methods in younger adults (Griffen et al. 2012; Abusleme et al. 2013; Deng et al. 2017; Ganesan et al. 2017; Shi et al. 2018). Using targeted DNA probe measurements, both Socransky (Socransky et al. 1998) and Kumar (Kumar et al. 2003) reported significant differences in the prevalence of several bacteria in middle-aged adults selected to have either periodontal disease or healthy periodontium. Among the organisms found at greater prevalence in disease compared with health were the classical pathogens T. forsythia, P. gingivalis, and T. denticola, as well as Actinomyces naeslundii, Treponema socranskii, Eubacterium saphenum, Parvimonas micra, and T. denticola. In the present study on older women, each of these microbiota was of higher prevalence in severe compared with none/mild (Table 2 for the 56 bacteria differing by periodontal disease categories and in Appendix Table 2).
Studies using nontargeted high-throughput sequencing identified substantially more subgingival bacterial species than previously had been evaluated using targeted approaches. The benchmark study by Griffen et al. (2012) used 454 pyrosequencing of the 16S rRNA gene (V1–2 and V4 regions) of subgingival plaque in 58 middle-aged adults, selected to have either periodontal disease or healthy gingiva, and identified 596 total species. Microbial α- and β-diversity were significantly higher in periodontal disease compared with health, as we also observed in the present study on older community-dwelling women (Fig. 2). Herein, 36 species had significantly higher relative abundance in periodontal disease compared with health after correction for multiple testing. These included many of those previously identified, such as Filifactor alocis, P. gingivalis, T. denticola, Treponema vincentii, Synergistes spp., T. socranskii, T. forsythia, Campylobacter rectus, and E. saphenum.
With the recent technological advances in sequencing and microbial annotation, newly identified organisms have been reported at higher levels in periodontal disease as compared to health (Perez-Chaparro et al. 2014; Patini et al. 2018). We identified several subgingival species among older women that were previously noted infrequently or not at all, including Anaerolineae (G-1) HMT 439, Dialister pneumosintes, Treponema maltophilum, Pseudoramibacter alactolyticus, Bacteroidaceae (G-1) HMT 272, Veillonellaceae (G-1) HMT 145, Johnsonella HMT 166, and Prevotella baroniae. There also is a group of organisms we did not find in our subgingival plaque samples that has been reported previously to be associated with periodontal disease, including Aggregatibacter actinomycetemcomitans, C. rectus, Eikenella corrodens, Clostridia, Olsenella uli, Pseudomonas aeruginosa, and Klebsiella pneumonia (Griffen et al. 2012; Vieira Colombo et al. 2016). Of special note among those not found in our study is A. actinomycetemcomitans. This organism is associated with localized aggressive periodontal disease, a condition infrequently seen in older adults (Mombelli et al. 2002). Future studies are needed to clarify abundance, strains, and function of taxa that differ in health and periodontal disease across the adult age range.
Oligotyping, used to explore diversity within defined microbial species, suggested the presence of subspecies difference between disease and health for some organisms such as P. gingivalis and P. intermedia. Further study is warranted to determine if a subspecies (or potentially substrain) found in disease and not health may be the critical virulent component that plays a key pathogenic role. It is also possible that certain subspecies of a subgingival organism may be abundant in health and confer protection, modulating colonization or virulence factors. If this were the case, analysis of overall abundance might not be sensitive enough to discriminate pathogenicity conferred at the subspecies level. Previous studies have identified heterogeneity in the genetic (Loos et al. 1990) and fimbria (Moreno et al. 2015) of P. gingivalis. However, the origin of variation in these strains or species was not reported. Our oligotyping results suggest that there may be specific subspecies (potentially strains) associated with periodontal disease, providing a basis to guide further studies to clarify the extent to which subspecies or strains and their virulence or protection functions play a role in periodontal disease. These studies may have critical relevance to variations in individual-level susceptibility for periodontal disease presence, severity, and progression.
Characterizing microbiota function is needed to refine understanding of how microbial communities give rise to periodontal disease or health (Wang 2015). The present study could not directly measure functional expression of taxa. However, as an exploratory step, we evaluated potential functions of microbiota differing in periodontal disease and health using the in silico PICRUSt method (Langille et al. 2013), which has been employed similarly in other published studies on microbiome and periodontal disease (Kirst et al. 2015). Taxa associated with severe periodontal disease had genes that could encode pathogenic activities, including microbial mobility, and sporulation. Taxa associated with health had genes that could encode functions for sustaining microbial viability, including oxidative phosphorylation (complete PICRUSt results available upon request to corresponding author). These findings are consistent with results of studies using PICRUSt (Kirst et al. 2015) and metatranscriptomic (Yost et al. 2017) methods. Further understanding the functional implications of defined subgingival microbiota and microbial ecologies is paramount to developing targeted therapeutic interventions for prevention of periodontal disease onset and to slow its progression among those already affected.
The present study has both strengths and limitations. The strengths include the large cohort size and its community-based enrollment, not using periodontal disease or other aspects of oral health as selection criteria. Understanding the epidemiology of the oral microbiota in such a cohort is important because of the ability to evaluate a range of distribution in periodontal measures and the subgingival microbiome that might be expected in a general community. This information provides a benchmark for future studies evaluating associations between the oral microflora and both oral and systemic diseases in various study populations. The use of high-throughput nontargeted next-generation sequencing, with well-documented laboratory procedures and quality control minimizing batch-to-batch variation (Appendix; Banack et al. 2018), is another strength of this study. Weaknesses of the study include its cross-sectional design, which does not allow for assessing the temporal relationship between the subgingival microflora and initiation or progression of periodontal disease. Longitudinal analyses of these same subjects are in progress and should help to address the question about temporality. Taxonomic annotation of microbial OTUs was completed using HOMD version 14.5, but inevitably this could result in an incomplete characterization of microbiota present in the subgingival plaque samples studied here as additional taxa are discovered and added to future versions of the database. Because our study cohort is part of the larger Women’s Health Initiative program, men were not included. It is unclear the extent to which our findings extend to men of similar age as the women studied here.
We conclude that, in a large cross-sectional study of over 1,200 postmenopausal women enrolled from the community exhibiting a range of presence and severity of periodontal disease, the subgingival organisms associated with periodontal disease in older women are comparable to the subgingival microbiota observed in studies on younger individuals. The notable exception is the absence of A. actinomycetemcomitans, which one would not expect to be identified in older adults. The diversity of the subgingival microbiome increases with the severity of periodontal disease, which is different from other studies of human bacterial infections such as Clostridium difficile–associated gastrointestinal infections where diversity is reduced in disease but similar to diseases like bacterial vaginosis where gut microbiome diversity is increased (Duvallet et al. 2017). The reason for this difference is unknown, but it appears that diversity of microbiota may be high or low in health or disease depending on the human habitat. We also observed that oligotype subspecies diversity is present among several taxa. Confirmation that this reflects strain differences in microflora correlated with periodontal disease could lead to a deeper understanding of these taxa and their role in the ecological dysbiosis and disease process associated with periodontal disease. Better understanding of both the diversity and functions of the subgingival microflora could lead to mechanistic targets for prevention and treatment of periodontal disease and associated systemic conditions.
Author Contributions
R.J. Genco, M.J. LaMonte, K.M. Hovey, J. Wactawski-Wende, contributed to conception, design, data acquisition, analysis, and interpretation, drafted and critically revised the manuscript; D.I. McSkimming, L. Li, W. Zheng, H.R. Banack, V. Murugaiyan, contributed to design, data analysis, and interpretation, critically revised the manuscript; M.J. Buck, Y. Sun, contributed to conception, design, data acquisition, analysis, and interpretation, critically revised the manuscript; C.A. Andrews, contributed to conception, design, data analysis, and interpretation, drafted and critically revised the manuscript; M. Tsompana, contributed to design and data interpretation, critically revised the manuscript. All authors gave final approval and agree to be accountable for all aspects of the work.
Supplemental Material
Supplemental material, DS_10.1177_0022034519860449 for The Subgingival Microbiome Relationship to Periodontal Disease in Older Women by R.J. Genco, M.J. LaMonte, D.I. McSkimming, M.J. Buck, L. Li, K.M. Hovey, C.A. Andrews, Y. Sun, M. Tsompana, W. Zheng, H.R. Banack, V. Murugaiyan and J. Wactawski-Wende in Journal of Dental Research
Acknowledgments
Prior to publication of this manuscript, Dr. Robert Genco unexpectedly passed away. Rest in peace mentor, colleague, and dear friend; you are sorely missed.
Footnotes
A supplemental appendix to this article is available online.
This study was supported by the following funding sources: National Heart, Lung, and Blood Institute (contract N01WH32122); National Institute for Dental and Craniofacial Research (grants DE13505, DE4898, DE022654, and DE024523); National Institute of Allergy and Infectious Diseases (R01Al125982); US Army Reserve Medical Corps (grant DAMD17-96-1-6319); Feasibility Study Award (AS382) from the Women’s Health Initiative Program; and support from Sunstar (Osaka, Japan).
The authors declare no potential conflicts of interest with respect to the authorship and/or publication of this article.
References
- Abusleme L, Dupuy AK, Dutzan N, Silva N, Burleson JA, Strausbaugh LD, Gamonal J, Diaz PI. 2013. The subgingival microbiome in health and periodontitis and its relationship with community biomass and inflammation. ISME J. 7(5):1016–1025. [DOI] [PMC free article] [PubMed] [Google Scholar]
- Altschul SF, Gish W, Miller W, Myers EW, Lipman DJ. 1990. Basic local alignment search tool. J Mol Biol. 215(3):403–410. [DOI] [PubMed] [Google Scholar]
- Banack HR, Genco RJ, LaMonte MJ, Millen AE, Buck MJ, Sun Y, Andrews CA, Hovey KM, Tsompana M, McSkimming DI, et al. 2018. Cohort profile: the Buffalo OsteoPerio Microbiome Prospective Cohort Study. BMJ Open. 8(12):e024263. [DOI] [PMC free article] [PubMed] [Google Scholar]
- Brennan RM, Genco RJ, Wilding GE, Hovey KM, Trevisan M, Wactawski-Wende J. 2007. Bacterial species in subgingival plaque and oral bone loss in postmenopausal women. J Periodontol. 78(6):1051–1061. [DOI] [PubMed] [Google Scholar]
- Caporaso JG, Kuczynski J, Stombaugh J, Bittinger K, Bushman FD, Costello EK, Fierer N, Pena AG, Goodrich JK, Gordon JI, et al. 2010. QIIME allows analysis of high-throughput community sequencing data. Nat Methods. 7(5):335–336. [DOI] [PMC free article] [PubMed] [Google Scholar]
- Chen T, Yu WH, Izard J, Baranova OV, Lakshmanan A, Dewhirst FE. 2010. The human oral microbiome database: a web accessible resource for investigating oral microbe taxonomic and genomic information. Database (Oxford). 2010:baq013. [DOI] [PMC free article] [PubMed] [Google Scholar]
- Deng ZL, Szafranski SP, Jarek M, Bhuju S, Wagner-Dobler I. 2017. Dysbiosis in chronic periodontitis: key microbial players and interactions with the human host. Sci Rep. 7(1):3703. [DOI] [PMC free article] [PubMed] [Google Scholar]
- Dewhirst FE, Chen T, Izard J, Paster BJ, Tanner AC, Yu WH, Lakshmanan A, Wade WG. 2010. The human oral microbiome. J Bacteriol. 192(19):5002–5017. [DOI] [PMC free article] [PubMed] [Google Scholar]
- Dubowitz T, Ghosh-Dastidar M, Eibner C, Slaughter ME, Fernandes M, Whitsel EA, Bird CE, Jewell A, Margolis KL, Li W, et al. 2012. The women’s health initiative: the food environment, neighborhood socioeconomic status, BMI, and blood pressure. Obesity. 20(4):862–871. [DOI] [PMC free article] [PubMed] [Google Scholar]
- Duvallet C, Gibbons SM, Gurry T, Irizarry RA, Alm EJ. 2017. Meta-analysis of gut microbiome studies identifies disease-specific and shared responses. Nat Commun. 8(1):1784. [DOI] [PMC free article] [PubMed] [Google Scholar]
- Eke PI, Page RC, Wei L, Thornton-Evans G, Genco RJ. 2012. Update of the case definitions for population-based surveillance of periodontitis. J Periodontol. 83(12):1449–1454. [DOI] [PMC free article] [PubMed] [Google Scholar]
- Eren AM, Morrison HG, Lescault PJ, Reveillaud J, Vineis JH, Sogin ML. 2015. Minimum entropy decomposition: unsupervised oligotyping for sensitive partitioning of high-throughput marker gene sequences. ISME J. 9(4):968–979. [DOI] [PMC free article] [PubMed] [Google Scholar]
- Feres M, Teles F, Teles R, Figueiredo LC, Faveri M. 2016. The subgingival periodontal microbiota of the aging mouth. Periodontology 2000. 72(1):30–53. [DOI] [PMC free article] [PubMed] [Google Scholar]
- Ganesan SM, Joshi V, Fellows M, Dabdoub SM, Nagaraja HN, O’Donnell B, Deshpande NR, Kumar PS. 2017. A tale of two risks: smoking, diabetes and the subgingival microbiome. ISME J. 11(9):2075–2089. [DOI] [PMC free article] [PubMed] [Google Scholar]
- Gloor GB, Macklaim JM, Pawlowsky-Glahn V, Egozcue JJ. 2017. Microbiome datasets are compositional: and this is not optional. Front Microbiol. 8:2224. [DOI] [PMC free article] [PubMed] [Google Scholar]
- Griffen AL, Beall CJ, Campbell JH, Firestone ND, Kumar PS, Yang ZK, Podar M, Leys EJ. 2012. Distinct and complex bacterial profiles in human periodontitis and health revealed by 16S pyrosequencing. ISME J. 6(6):1176–1185. [DOI] [PMC free article] [PubMed] [Google Scholar]
- Griffin SO, Jones JA, Brunson D, Griffin PM, Bailey WD. 2012. Burden of oral disease among older adults and implications for public health priorities. Am J Public Health. 102(3):411–418. [DOI] [PMC free article] [PubMed] [Google Scholar]
- Haffajee AD, Cugini MA, Tanner A, Pollack RP, Smith C, Kent RL, Jr, Socransky SS. 1998. Subgingival microbiota in healthy, well-maintained elder and periodontitis subjects. J Clin Periodontol. 25(5):346–353. [DOI] [PubMed] [Google Scholar]
- Human Microbiome Project Consortium. 2012. Structure, function and diversity of the healthy human microbiome. Nature. 486(7402):207–214. [DOI] [PMC free article] [PubMed] [Google Scholar]
- Jenkinson HF, Lamont RJ. 2005. Oral microbial communities in sickness and in health. Trends Microbiol. 13(12):589–595. [DOI] [PubMed] [Google Scholar]
- Kanehisa M, Goto S. 2000. KEGG: Kyoto encyclopedia of genes and genomes. Nucleic Acids Res. 28(1):27–30. [DOI] [PMC free article] [PubMed] [Google Scholar]
- Kirst ME, Li EC, Alfant B, Chi YY, Walker C, Magnusson I, Wang GP. 2015. Dysbiosis and alterations in predicted functions of the subgingival microbiome in chronic periodontitis. Appl Environ Microbiol. 81(2):783–793. [DOI] [PMC free article] [PubMed] [Google Scholar]
- Kumar PS, Griffen AL, Barton JA, Paster BJ, Moeschberger ML, Leys EJ. 2003. New bacterial species associated with chronic periodontitis. J Dent Res. 82(5):338–344. [DOI] [PubMed] [Google Scholar]
- LaMonte MJ, Genco RJ, Zheng W, McSkimming DI, Andrews CA, Hovey KM, Li L, Sun Y, Buck MJ, Millen AE, et al. 2018. Substantial differences in the subgingival microbiome measured by 16s metagenomics according to periodontitis status in older women. Dent J (Basel). 6(4). doi: 10.3390/dj6040058 [DOI] [PMC free article] [PubMed] [Google Scholar]
- LaMonte MJ, Hovey KM, Genco RJ, Millen AE, Trevisan M, Wactawski-Wende J. 2013. Five-year changes in periodontal disease measures among postmenopausal females: the Buffalo OsteoPerio Study. J Periodontol. 84(5):572–584. [DOI] [PubMed] [Google Scholar]
- Langer RD, White E, Lewis CE, Kotchen JM, Hendrix SL, Trevisan M. 2003. The Women’s Health Initiative Observational Study: baseline characteristics of participants and reliability of baseline measures. Ann Epidemiol 13(9 Suppl):S107–S121. [DOI] [PubMed] [Google Scholar]
- Langille MG, Zaneveld J, Caporaso JG, McDonald D, Knights D, Reyes JA, Clemente JC, Burkepile DE, Vega Thurber RL, Knight R, et al. 2013. Predictive functional profiling of microbial communities using 16S rRNA marker gene sequences. Nat Biotechnol. 31(9):814–821. [DOI] [PMC free article] [PubMed] [Google Scholar]
- Loos BG, Mayrand D, Genco RJ, Dickinson DP. 1990. Genetic heterogeneity of Porphyromonas (bacteroides) gingivalis by genomic DNA fingerprinting. J Dent Res. 69(8):1488–1493. [DOI] [PubMed] [Google Scholar]
- Mert MC, Filzmoser P, Endel G, Wilbacher I. 2018. Compositional data analysis in epidemiology. Stat Methods Med Res. 27(6):1878–1891. [DOI] [PubMed] [Google Scholar]
- Mombelli A, Casagni F, Madianso P. 2002. Can presence or absence of periodontal pathogens distinguish between subjects with chronic and aggressive periodontitis? A systematic review. J Clin Periodontol. 29(Suppl 3):10–21; discussion 37–38. [DOI] [PubMed] [Google Scholar]
- Moreno S, Jaramillo A, Parra B, Botero JE, Contreras A. 2015. Porphyromonas gingivalis fim—a genotype distribution among Colombians. Colomb Med (Cali). 46(3):122–127. [PMC free article] [PubMed] [Google Scholar]
- Patini R, Staderini E, Lajolo C, Lopetuso L, Mohammed H, Rimondini L, Rochetti V, Gallenzi P. 2018. Relationship between oral microbiota and periodontal disease: a systematic review. Eur Rev Med Pharmacol Sci. 22(18):5575–5788. [DOI] [PubMed] [Google Scholar]
- Perez-Chaparro PJ, Goncalves C, Figueiredo LC, Faveri M, Lobao E, Tamashiro N, Duarte P, Feres M. 2014. Newly identified pathogens associated with periodontitis: a systematic review. J Dent Res. 93(9):846–858. [DOI] [PMC free article] [PubMed] [Google Scholar]
- Shi M, Wei Y, Hu W, Nie Y, Wu X, Lu R. 2018. The subgingival microbiome of periodontal pockets with different probing depths in chronic and aggressive periodontitis: a pilot study. Front Cell Infect Microbiol. 8:124. [DOI] [PMC free article] [PubMed] [Google Scholar]
- Socransky SS, Haffajee AD, Cugini MA, Smith C, Kent RL., Jr 1998. Microbial complexes in subgingival plaque. J Clin Periodontol. 25(2):134–144. [DOI] [PubMed] [Google Scholar]
- Teles R, Teles F, Frias-Lopez J, Paster B, Haffajee A. 2013. Lessons learned and unlearned in periodontal microbiology. Periodontology 2000. 62(1):95–162. [DOI] [PMC free article] [PubMed] [Google Scholar]
- Tettamanti L, Gaudio RM, Cura F, Mucchi D, Illuzzi N, Tagliabue A. 2017. Prevalence of periodontal pathogens among Italian patients with chronic periodontitis: a retrospective study on 2992 patients. Oral Implantol (Rome). 10(1):28–36. [DOI] [PMC free article] [PubMed] [Google Scholar]
- Vieira Colombo AP, Magalhaes CB, Hartenbach FA, Martins do, Souto R, Maciel da, Silva-Boghossian C. 2016. Periodontal-disease-associated biofilm: a reservoir for pathogens of medical importance. Microb Pathog. 94:27–34. [DOI] [PubMed] [Google Scholar]
- Wang GP. 2015. Defining functional signatures of dysbiosis in periodontitis progression. Genome Med. 7(1):40. [DOI] [PMC free article] [PubMed] [Google Scholar]
- Yost S, Duran-Pinedo AE, Krishnan K, Frias-Lopez J. 2017. Potassium is a key signal in host-microbiome dysbiosis in periodontitis. PLoS Pathog. 13(6):e1006457. [DOI] [PMC free article] [PubMed] [Google Scholar]
Associated Data
This section collects any data citations, data availability statements, or supplementary materials included in this article.
Supplementary Materials
Supplemental material, DS_10.1177_0022034519860449 for The Subgingival Microbiome Relationship to Periodontal Disease in Older Women by R.J. Genco, M.J. LaMonte, D.I. McSkimming, M.J. Buck, L. Li, K.M. Hovey, C.A. Andrews, Y. Sun, M. Tsompana, W. Zheng, H.R. Banack, V. Murugaiyan and J. Wactawski-Wende in Journal of Dental Research