

Key Points
Question
Does intensive glucose control improve functional outcome in patients with hyperglycemic acute ischemic stroke?
Findings
This randomized clinical trial included 1151 adults who received either intensive treatment of hyperglycemia (target blood glucose concentration of 80-130 mg/dL) or standard treatment of hyperglycemia (target glucose concentration of 80-179 mg/dL). The proportion of patients achieving a favorable outcome based on the 90-day modified Rankin Scale score was 20.5% in the intensive treatment group and 21.6% in the standard treatment group, which was not statistically significant.
Meaning
Intensive compared with standard glucose control did not improve 90-day functional outcomes in patients with acute ischemic stroke and hyperglycemia.
Abstract
Importance
Hyperglycemia during acute ischemic stroke is common and is associated with worse outcomes. The efficacy of intensive treatment of hyperglycemia in this setting remains unknown.
Objectives
To determine the efficacy of intensive treatment of hyperglycemia during acute ischemic stroke.
Design, Setting, and Participants
The Stroke Hyperglycemia Insulin Network Effort (SHINE) randomized clinical trial included adult patients with hyperglycemia (glucose concentration of >110 mg/dL if had diabetes or ≥150 mg/dL if did not have diabetes) and acute ischemic stroke who were enrolled within 12 hours from stroke onset at 63 US sites between April 2012 and August 2018; follow-up ended in November 2018. The trial included 1151 patients who met eligibility criteria.
Interventions
Patients were randomized to receive continuous intravenous insulin using a computerized decision support tool (target blood glucose concentration of 80-130 mg/dL [4.4-7.2 mmol/L]; intensive treatment group: n = 581) or insulin on a sliding scale that was administered subcutaneously (target blood glucose concentration of 80-179 mg/dL [4.4-9.9 mmol/L]; standard treatment group: n = 570) for up to 72 hours.
Main Outcomes and Measures
The primary efficacy outcome was the proportion of patients with a favorable outcome based on the 90-day modified Rankin Scale score (a global stroke disability scale ranging from 0 [no symptoms or completely recovered] to 6 [death]) that was adjusted for baseline stroke severity.
Results
Among 1151 patients who were randomized (mean age, 66 years [SD, 13.1 years]; 524 [46%] women, 923 [80%] with diabetes), 1118 (97%) completed the trial. Enrollment was stopped for futility based on prespecified interim analysis criteria. During treatment, the mean blood glucose level was 118 mg/dL (6.6 mmol/L) in the intensive treatment group and 179 mg/dL (9.9 mmol/L) in the standard treatment group. A favorable outcome occurred in 119 of 581 patients (20.5%) in the intensive treatment group and in 123 of 570 patients (21.6%) in the standard treatment group (adjusted relative risk, 0.97 [95% CI, 0.87 to 1.08], P = .55; unadjusted risk difference, −0.83% [95% CI, −5.72% to 4.06%]). Treatment was stopped early for hypoglycemia or other adverse events in 65 of 581 patients (11.2%) in the intensive treatment group and in 18 of 570 patients (3.2%) in the standard treatment group. Severe hypoglycemia occurred only among patients in the intensive treatment group (15/581 [2.6%]; risk difference, 2.58% [95% CI, 1.29% to 3.87%]).
Conclusions and Relevance
Among patients with acute ischemic stroke and hyperglycemia, treatment with intensive vs standard glucose control for up to 72 hours did not result in a significant difference in favorable functional outcome at 90 days. These findings do not support using intensive glucose control in this setting.
Trial Registration
ClinicalTrials.gov Identifier: NCT01369069
This randomized clinical trial compares the effects of continuous intravenous vs subcutaneous sliding scale insulin for treatment of hyperglycemia during acute ischemic stroke on functional outcome in adult patients in the United States.
Introduction
Hyperglycemia is present in approximately 40% of patients with acute ischemic stroke1 and is associated with worse clinical outcomes,2,3 including greater infarct growth4,5 and hemorrhagic infarct conversion.6,7 Data suggest that hyperglycemia during acute brain ischemia augments the ischemic injury by multiple potential mechanisms, such as endothelial dysfunction, increased oxidative stress, and impaired fibrinolysis.8
In the only prior efficacy trial for treating hyperglycemia during acute stroke, the Glucose Insulin in Stroke Trial (GIST),9 80% of patients did not have diabetes, 16% had hemorrhagic strokes, and the difference between the blood glucose levels during a 24-hour treatment period was only 10 mg/dL (0.6 mmol/L). That trial was stopped early due to slow enrollment and lacked adequate power to address efficacy. There were no significant differences between treatment groups in functional outcomes.
Subsequent studies designed to assess the feasibility and safety of intensive glucose control in the setting of acute cerebral ischemia indicated that such a trial was feasible and warranted.10,11 Other trials were limited in size or did not achieve adequate differentiation in glucose control between treatment groups.12 Current acute stroke guidelines from the American Heart Association/American Stroke Association (AHA/ASA) suggest treating hyperglycemia to achieve a blood glucose level in the range of 140 to 180 mg/dL (7.8-10.0 mmol/L) and close monitoring to prevent hypoglycemia, but acknowledge limited supporting data.13
Due to the frequency of hyperglycemia among patients with acute stroke, lack of sufficient evidence from randomized trials, and need for an optimal management strategy, the Stroke Hyperglycemia Insulin Network Effort (SHINE) randomized clinical trial was conducted to assess the efficacy of intensive vs standard blood glucose control in patients with hyperglycemic acute ischemic stroke.14 It was hypothesized that intensive blood glucose control would improve functional outcomes among patients with acute ischemic stroke and hyperglycemia compared with standard glucose control.
Methods
Trial Design and Oversight
This trial was a randomized clinical trial with blinded outcome assessment. Sixty-three of the 70 participating sites across the United States enrolled patients with acute ischemic stroke into the trial. The detailed trial rationale, design, and methods have been published.14 The trial protocol appears in Supplement 1 and the statistical analysis plan appears in Supplement 2. The trial protocol was approved by the institutional review board at each participating site, and all patients were enrolled after providing written informed consent.
Trial Population
Patients with hyperglycemia and acute ischemic stroke, a National Institutes of Health Stroke Scale (NIHSS) score of 3 to 22 (scores range from 0-42; higher scores indicate greater neurological deficits), presenting within 12 hours from stroke onset, and aged 18 years or older were eligible for enrollment (Figure 1). Hyperglycemia in patients with known type 2 diabetes was defined as a glucose level greater than 110 mg/dL (>6.1 mmol/L) at the time of enrollment, and a glucose level of 150 mg/dL or greater (≥8.3 mmol/L) in patients without known diabetes. Patients with mild stroke (NIHSS score range, 3-7) were required to have a prestroke modified Rankin Scale score of 0. The modified Rankin Scale score ranges from 0 (no symptoms or completely recovered) to 6 (death). Patients with moderate to severe stroke (NIHSS score range, 8-22) were required to have a prestroke modified Rankin Scale score of 0 or 1. For patients without a prior stroke, the modified Rankin Scale value was scored as 0 if they were independent and able to walk without assistance.
Figure 1. Enrollment, Randomization, and Follow-up of Patients.
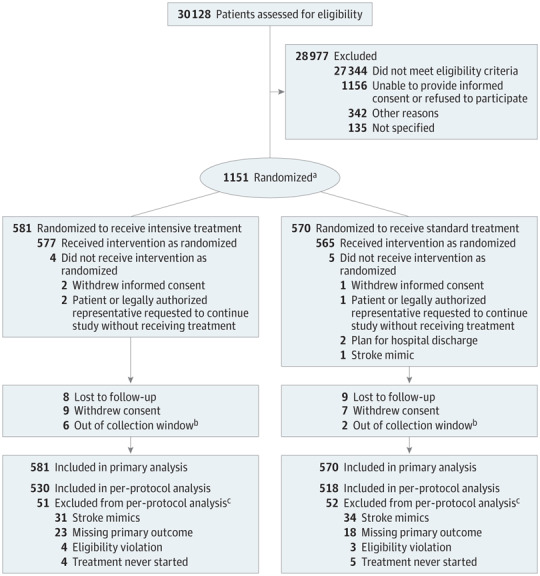
aOne patient was randomized twice, 21 months apart.
bThe collection window was predefined as 90 days (+30 days or −14 days) after randomization.
cSome patients had multiple reasons for exclusion.
Patients were ineligible if they had type 1 diabetes, required renal dialysis, had a clinical indication for insulin infusion, or had a condition that would confound assessment of the stroke clinical outcome. Although no defined upper limit of glucose concentration was exclusionary, the clinical sites were required to contact the on-call medical safety monitor if an individual had a glucose level of 500 mg/dL or greater (≥27.8 mmol/L) before randomization or during treatment. A detailed list of eligibility criteria appears in the trial protocol (Supplement 1). Race, ethnicity, and sex (fixed categories) were captured as required by the federal sponsor. Each was determined based on patient self-report, medical record review, or report from a reliable individual accompanying the patient.
Trial Procedures
This trial used a web-based central randomization system and response-adaptive randomization that was balanced based on baseline stroke severity (NIHSS score ranges, 3-7, 8-14, and 15-22), initiated or planned use of intravenous tissue plasminogen activator therapy, and clinical site. Following a burn-in period, patient outcome information was included in the randomization algorithm so that the target allocation ratio could be shifted from an equal allocation ratio to a skewed ratio favoring the better-performing group. Details of the randomization algorithm have been published.15
Patients in the intensive treatment group received a continuous intravenous insulin infusion as needed to maintain a blood glucose concentration of 80 to 130 mg/dL (4.44-7.22 mmol/L) using a computer decision support tool (GlucoStabilizer, Medical Decision Network LLC) cleared for use by the US Food and Drug Administration. Rapid-acting subcutaneous insulin was given 20 minutes after starting to eat based on the estimated amount of carbohydrates consumed.
Patients in the standard treatment group received insulin on a sliding scale that was administered subcutaneously every 6 hours as needed to maintain a blood glucose concentration of 80 to 179 mg/dL (4.44-9.93 mmol/L). If the blood glucose concentration had not reached the target at 24 and 48 hours, the subcutaneous insulin dose was increased, including long-acting basal insulin.14 The standard treatment group also received a continuous intravenous saline drip to maintain patient blinding.
Glucose level was initially checked hourly in both groups and then every 1 to 2 hours in the intensive treatment group and every 3 hours in the standard treatment group. Each meal contained 60 g of carbohydrates and participants could consume up to 3 meals per day or equivalent by tube feeding for both groups. A limited amount of low-carbohydrate snacks were allowed during the treatment period.
A blood glucose level of less than 80 mg/dL (<4.44 mmol/L) was treated with intravenous dextrose 50% in both groups and the study intravenous treatment was stopped until the glucose level was greater than or equal to 80 mg/dL (≥4.44 mmol/L). The protocol-specified treatment period was 72 hours.
Treatment completion was defined as treatment for at least 68 hours from randomization, until death, or hospital discharge. The enrolling investigators and treatment teams were not blinded to treatment assignment. A blinded assessor contacted each patient by telephone at 6 weeks (±14 days) and evaluated each patient in person at 90 days (+30 days or −14 days) or by telephone if an in-person visit was not feasible. Acute stroke care for both groups followed the latest guidelines from the AHA/ASA.16,17,18
Outcomes
The primary efficacy outcome was the proportion of patients with a favorable outcome at 90 days after randomization. A favorable outcome was defined as a modified Rankin Scale score of 0 in patients with a baseline NIHSS score of 3 to 7, a modified Rankin Scale score of 0 to 1 in patients with a baseline NIHSS score of 8 to 14, and a modified Rankin Scale score of 0 to 2 in patients with a baseline NIHSS score of 15 to 22.19 The modified Rankin Scale is an ordinal, 7-point global disability scale with scores ranging from 0 (no symptoms or completely recovered) to 6 (death).
Key secondary outcomes included 90-day NIHSS score, 90-day Barthel Index score (scores range from 0-100; higher scores indicate greater ability to perform activities of daily living), and 90-day Stroke Specific Quality of Life score (scores range from 1-5; higher scores indicate better quality of life).20 The NIHSS and Barthel Index scores were considered favorable outcomes if patients had a score of 0 or 1 on the NIHSS or a score of 95 to 100 on the Barthel Index.
The primary safety outcome was severe hypoglycemia defined as a glucose level less than 40 mg/dL (<2.22 mmol/L) during the treatment period. Serious adverse events were captured from randomization through the end of the study.
Statistical Analysis
The trial was designed to test an overall absolute between-group difference of 7% for a favorable outcome because this is considered a clinically relevant treatment effect.21 It was estimated that 25% of the standard treatment group would have a favorable outcome based on the response rate for control patients in previous ischemic stroke trials.5,6,22,23 Sample size estimation was based on a comparison of 2 independent proportions with 4 planned interim analyses for futility or efficacy of the primary outcome, a 3% inflation factor for loss to follow-up, 80% power, and a 2-sided significance level of .05. The maximum sample size required for randomization was 1400.
The first interim analysis was planned to be conducted once 500 patients reached the 90-day primary outcome. Subsequent interim analyses were to occur after 700, 900, and 1100 patients reached the 90-day primary outcome. The interim analysis plan used the error spending function method with O’Brien and Fleming-type stopping guidelines. In addition to planned interim analyses, the trial included a blinded sample size reestimation plan to be conducted prior to the first interim analysis. The plan was in place to avoid an underpowered trial if the assumed control proportion was incorrect. Stopping the trial due to harm would be considered if at any point the 2-sided 95% CI for the unadjusted relative risk (RR) for death excluded 1, or if the unadjusted absolute risk difference for the proportion of patients with severe hypoglycemia exceeded 4%.
The primary analysis used a generalized linear model with a log link. Treatment group was the primary factor of interest. The covariates were baseline NIHSS score strata (3-7, 8-14, 15-22) and thrombolysis use (yes or no; includes intravenous and intra-arterial therapies). Adjusted RRs with 2-sided 95% CIs are reported for the primary efficacy outcome along with the risk difference.
A sensitivity analysis of the primary outcome included a per-protocol population defined as all randomized patients that did not have an eligibility violation, started treatment, had 90-day outcomes, and had a final diagnosis of ischemic stroke or transient ischemic attack. An additional post hoc analysis of the primary outcome included clinical site as a random effect. Point estimates and 2-sided 95% CIs are reported for an exploratory, post hoc comparison of the primary outcome within important subgroups.
The secondary efficacy outcomes were analyzed using the χ2 test for binary outcomes and the Wilcoxon rank sum test for the Stroke Specific Quality of Life score. Adjustments for multiplicity were not planned for these specific secondary outcomes. Because of the potential for type I error due to multiple comparisons, findings for the secondary end points should be interpreted as exploratory. A post hoc ordinal analysis of the 90-day modified Rankin Scale score using a Cochran-Mantel-Haenszel test with adjustment for baseline stroke severity was conducted, as well as a post hoc comparison of the baseline characteristics and the primary outcome among sites that enrolled more than 45 patients (highest enrolling sites) vs all other enrolling sites.
All analyses were conducted based on the assigned treatment group. The primary analysis included all randomized patients and used multiple imputation under the assumption of missing at random to impute missing primary outcome data as described in the statistical analysis plan (Supplement 2). The secondary analyses included all randomized patients with outcome data available (no imputation was used for the secondary outcomes). All analyses were conducted using SAS software version 9.4 (SAS Institute Inc) and used 2-sided tests with a significance threshold of .05.
Results
Patients
Between April 2012 and August 2018, 1151 patients (mean age, 66 years [SD, 13.1 years]; 524 [46%] women, 923 [80%] with diabetes) provided consent and were randomized, which represents 82% of the planned maximum enrollment. During August 2018, study enrollment was stopped after the fourth prespecified interim analysis met the futility criteria. A total of 1118 patients (97%) completed the trial. Participant follow-up ended in November 2018.
There were 1156 patients who did not provide consent and were excluded, which includes both those who refused to provide consent and patients (or legally authorized representatives) who were unable to provide consent. Compared with patients who did not provide consent and were excluded, those who provided consent and were randomized included more Hispanic (11% vs 16%, respectively) and black patients (26% vs 30%) and were younger (aged 69 years vs 66 years).
The clinical sites screened a broad population with stroke to identify patients who met the eligibility criteria. A total of 70 sites in the United States were included in the trial, and 63 sites enrolled at least 1 patient. The treatment groups were well balanced for baseline demographics and clinical characteristics, glucose level, stroke severity, and use of reperfusion therapies (Table 1).
Table 1. Baseline Patient Characteristics.
| Characteristic | Treatment of Hyperglycemia | |
|---|---|---|
| Intensive (n = 581) | Standard (n = 570) | |
| Age, median (IQR), y | 66 (57-75) | 66 (57-76) |
| Sex, No. (%) | ||
| Male | 321 (55.3) | 306 (53.7) |
| Female | 260 (44.8) | 264 (46.3) |
| Race, No./total No. (%) | ||
| White | 366/560 (65.4) | 368/547 (67.3) |
| Black | 180/560 (32.1) | 154/547 (28.2) |
| Asian | 12/560 (2.1) | 18/547 (3.3) |
| Othera | 2/560 (0.4) | 7/547 (1.3) |
| Hispanic ethnicity, No./total No. (%) | 87/547 (15.9) | 91/540 (16.9) |
| Final diagnosis, No. (%) | ||
| Ischemic stroke | 542 (93.3) | 524 (91.9) |
| Transient ischemic attack | 8 (1.4) | 12 (2.1) |
| Otherb | 31 (5.3) | 34 (6.0) |
| Use of reperfusion therapies, No. (%)c | ||
| Intravenous tissue plasminogen activator | 372 (64.0) | 353 (61.9) |
| Mechanical thrombectomy | 74 (12.7) | 72 (12.6) |
| Intra-arterial drug therapy | 14 (2.4) | 21 (3.7) |
| Medical history, No. (%) | ||
| Hypertension | 513 (88.3) | 502 (88.1) |
| Type 2 diabetes | 468 (80.6) | 455 (79.8) |
| Hyperlipidemia | 350 (60.2) | 327 (57.4) |
| Coronary artery disease | 159 (27.4) | 167 (29.3) |
| Atrial fibrillation | 124 (21.3) | 106 (18.6) |
| Previous ischemic stroke | 104 (17.9) | 99 (17.4) |
| Previous large vessel atherosclerosis | 42 (7.2) | 39 (6.8) |
| Blood glucose level, median (IQR), mg/dL | 188 (153-250) | 187 (155-248) |
| NIHSS score, median (IQR)d | 7 (5-12) | 7 (5-13) |
| Stroke category, No. (%) | ||
| Mild (NIHSS score of 3-7) | 291 (50.1) | 291 (51.1) |
| Moderate (NIHSS score of 8-14) | 177 (30.5) | 158 (27.7) |
| Severe (NIHSS score of 15-22) | 113 (19.4) | 121 (21.2) |
Abbreviations: IQR, interquartile range; NIHSS, National Institutes of Health Stroke Scale.
SI conversion factor: To convert glucose to mmol/L, multiply by 0.0555.
Includes American Indian or Alaska Native, and Native Hawaiian or other Pacific Islander.
Includes migraine, seizure, brain tumor or mass, psychogenic, unmasking of old stroke, central nervous system infection (abscess, meningitis, or encephalitis), toxic or metabolic condition (encephalopathy), and other stroke mimic.
Some patients received more than 1 type.
Range is from 0 to 42; higher scores indicate greater neurological deficits.
Eighty percent of the patients had a history of type 2 diabetes, 23% had lacunar strokes, and 50% had mild strokes (NIHSS score of 3-7). Reperfusion therapies were used in 68% of patients (63% received intravenous tissue plasminogen activator therapy; 3%, intra-arterial drug therapy; and 13%, mechanical thrombectomy). The baseline median glucose level was 188 mg/dL (10.4 mmol/L).
Treatment
A total of 943 patients (82% overall; 433 of 581 [74.5%] in the intensive treatment group and 510 of 570 [89.5%] in the standard treatment group) completed treatment (eTable 1 in Supplement 3). Treatment was stopped early for hypoglycemia or other adverse events in 65 of 581 patients (11.2%) in the intensive treatment group and in 18 of 570 patients (3.2%) in the standard treatment group. Figure 2 shows the distribution of blood glucose concentrations during treatment. The mean glucose concentration for the intensive treatment group was 118 mg/dL (95% CI, 115-121 mg/dL; 6.6 mmol/L [95% CI, 6.4-6.7 mmol/L]) and for the standard treatment group was 179 mg/dL (95% CI, 175-182 mg/dL; 9.9 mmol/L [95% CI, 9.7-10.1 mmol/L]).
Figure 2. Blood Glucose Concentrations in 3-Hour Intervals During the Treatment Period by Treatment Group.
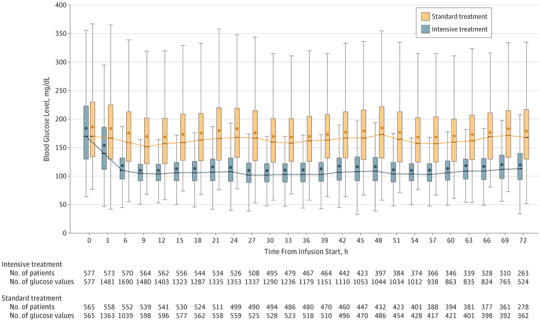
The box plots include observed data within a 3-hour interval. The box shows the interquartile range (IQR), with the bottom and top indicating the 25th and 75th percentiles. The line inside the box indicates the median. The dots inside the box indicate the means. The upper whisker extends from the top of the box to the largest value no farther than 1.5 × IQR, and the bottom whisker extends from the bottom of the box to the smallest value no farther than 1.5 × IQR. The trajectory line connects the medians at each 3-hour interval. The box plots have been offset to avoid superimposition. Each patient can contribute up to 3 glucose measurements during each 3-hour interval. The median number of measurements per patient within a 3-hour interval was 3 (IQR, 2-3) in the intensive treatment group and 1 (IQR, 1-1) in the standard treatment group.
Primary Efficacy Outcome
In the primary analysis population, 3.6% of patients had missing data for the primary outcome. A favorable outcome occurred in 119 of 581 patients (20.5%) in the intensive treatment group and in 123 of 570 patients (21.6%) in the standard treatment group (adjusted RR, 0.97 [95% CI, 0.87 to 1.08], P = .55; unadjusted risk difference, −0.83% [95% CI, −5.72% to 4.06%]; Table 2). The additional per-protocol analysis yielded similar results (eTable 2A in Supplement 3).
Table 2. Primary Outcome, Secondary Outcomes, and Adverse Events.
| Treatment of Hyperglycemia | Unadjusted Risk Difference (95% CI), % |
Relative Risk (95% CI) | P Value | |||
|---|---|---|---|---|---|---|
| Intensive (n = 581) | Standard (n = 570) | Unadjusted | Adjusteda | |||
| Primary Outcome | ||||||
| Favorable 90-d modified Rankin Scale score, No. (%)b | 119 (20.5) | 123 (21.6) | −0.83 (−5.72 to 4.06) | 0.96 (0.77 to 1.20) | 0.97 (0.87 to 1.08) | .55c |
| Secondary Outcomes d | ||||||
| Favorable 90-d NIHSS score, No./total No. (%)e | 152/348 (43.7) | 166/371 (44.7) | −1.07 (−8.33 to 6.20) | 0.98 (0.83 to 1.15) | 1.00 (0.93 to 1.08) | .77f |
| Favorable 90-d Barthel Index score, No./total No. (%)g | 271/491 (55.2) | 261/477 (54.7) | 0.48 (−5.79 to 6.75) | 1.01 (0.90 to 1.13) | 1.00 (0.95 to 1.05) | .88f |
| 90-d Stroke Specific Quality of Life scoreh | ||||||
| No. of patients | 442 | 432 | ||||
| Median (IQR) | 3.75 (2.98 to 4.40) | 3.69 (3.02 to 4.46) | 0.06 (−0.13 to 0.25) | .74i | ||
| Adverse Events | ||||||
| Severe hypoglycemia (glucose level <40 mg/dL), No. (%) | 15 (2.6) | 0 | 2.58 (1.29 to 3.87) | <.001j | ||
| Death, No. (%) | 54 (9.3) | 65 (11.4) | −2.11 (−5.63 to 1.41) | 0.82 (0.58 to 1.15) | .24f | |
Abbreviations: IQR, interquartile range; NIHSS, National Institutes of Health Stroke Scale.
SI conversion factor: To convert glucose to mmol/L, multiply by 0.0555.
The analyses were adjusted for baseline stroke severity (NIHSS score, 3-7 [mild]; 8-14 [moderate], and 15-22 [severe]) and thrombolysis or thrombectomy use (yes or no).
Included all randomized patients and used multiple imputation to impute the 41 missing outcome data cases (23 from the intensive treatment group and 18 from the standard treatment group). Favorable is defined as a 90-day modified Rankin Scale score of 0 in patients with mild stroke (baseline NIHSS score of 3-7), a 90-day modified Rankin Scale score of 0 or 1 in patients with moderate stroke (baseline NIHSS score of 8-14), and a 90-day modified Rankin Scale score of 0, 1, or 2 in patients with severe stroke (baseline NIHSS score of 15-22) with a prespecified range (76-120) of acceptable days.
The Wald test was used.
Included all randomized patients without missing outcome data.
Patients with a favorable outcome had a score of 0 or 1. The score range is from 0 to 42; higher scores indicate greater neurological deficits.
The χ2 test was used.
Patients with a favorable outcome had a score of 95 to 100. Assesses functional independence in patients who have had a stroke. The score range is from 0-100; higher scores indicate greater ability to perform activities of daily living.
The score range is from 1 to 5; higher scores indicate better quality of life.
The Wilcoxon rank sum test was used.
The Fisher exact test was used.
A post hoc secondary analysis of the primary outcome that included clinical site as a random effect did not show a significant difference in the treatment effect estimates (eTable 2B in Supplement 3). A post hoc forest plot illustrates the comparison of treatment groups for the primary outcome within important subgroups (eFigure 1 in Supplement 3).
Secondary Outcomes
There were no significant between-group differences in any of the prespecified secondary efficacy outcomes (Table 2). Figure 3 illustrates the distribution of 90-day modified Rankin Scale scores by baseline stroke severity. A post hoc ordinal analysis of the 90-day modified Rankin Scale score using a Cochran-Mantel-Haenszel test with adjustment for baseline stroke severity did not show a significant between-group difference in the distribution of modified Rankin Scale scores (P = .85). A post hoc comparison of the baseline characteristics and the primary outcome between the 6 highest enrolling clinical sites and the remaining 57 sites also did not show significant differences (eTable 3 in Supplement 3).
Figure 3. Distribution of 90-Day Modified Rankin Scale Score by Treatment Group and Baseline Stroke Severity.
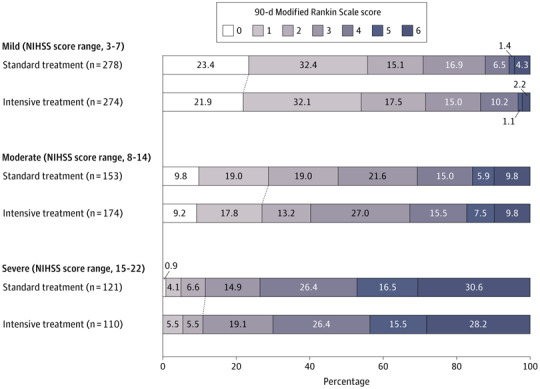
NIHSS indicates National Institutes of Health Stroke Scale. The modified Rankin Scale is a global stroke disability scale with scores ranging from 0 (no symptoms or completely recovered) to 6 (death). Each cell corresponds to a score on the modified Rankin Scale; the width of the cell indicates the proportion of patients with equivalent scores, and the percentage of patients is shown within the cell. The diagonal line between the 2 study groups indicates the dichotomization of favorable outcome in each severity stratum.
Adverse Events
Severe hypoglycemia (glucose level <40 mg/dL [<2.22 mmol/L]) occurred in 15 patients (2.6%) in the intensive treatment group and in 0 patients in the standard treatment group (risk difference, 2.58% [95% CI, 1.29% to 3.87%]). Death occurred in 54 patients (9.3%) in the intensive treatment group and in 65 patients (11.4%) in the standard treatment group (RR, 0.82 [95% CI, 0.58 to 1.15]; risk difference, −2.11% [95% CI, −5.63% to 1.41%]). There were 334 patients with at least 1 reported hypoglycemic event (serious or not serious). Of these, 82 were reported as symptomatic.
There were no neurological worsening events related to hypoglycemia. Serious adverse events by treatment group appear in eFigure 2 in Supplement 3. The proportion of patients with hypoglycemia reported as a serious adverse event was higher in the intensive treatment group compared with the standard treatment group (3.6% vs 0.35%, respectively; RR, 10.30 [95% CI, 2.43 to 43.73]; risk difference, 3.26% [95% CI, 1.67% to 4.86%]). In contrast, the proportion with neurological decompensation was higher in the standard treatment group compared with the intensive treatment group (1.2% vs 3.0%, respectively; RR, 0.4 [95% CI, 0.17 to 0.96]; risk difference, −1.78% [95% CI, −3.43% to −0.12%]).
Discussion
In this multicenter randomized clinical trial including patients with acute hyperglycemic ischemic stroke and predominantly with type 2 diabetes, intensive insulin treatment compared with standard treatment did not improve functional outcomes. In addition, the intensive insulin treatment did not improve any of the following prespecified secondary 90-day outcomes: minimal residual neurological deficits (NIHSS score), minimal residual limitations in activities of daily living (Barthel Index), or Stroke Specific Quality of Life score.
The absence of a significant clinical benefit in this study was demonstrated even though there was a considerably lower mean blood glucose concentration in the intensive treatment group compared with the standard treatment group (difference of 61 mg/dL [3.4 mmol/L]). This differentiation in glucose control was substantially larger than in previous glucose control acute stroke trials.9,11,24,25,26
Despite use of a computerized decision support tool designed to limit the severity of hypoglycemia, severe hypoglycemia occurred among patients in the intensive treatment group. As previously demonstrated,11 the variability of glucose concentration was reduced by using a computerized decision support tool.
The enrolled patient population was broad. It was diverse in age (no upper age limit), broadly represented by sex (46% female), race (30% black), and ethnicity (16% Hispanic), and patients lived throughout the United States (63 clinical sites enrolled ≥1 patient). This trial population reflects the current standard for acute ischemic stroke care, with patients receiving intravenous tissue plasminogen activator therapy (63%), mechanical thrombectomy (13%), or both treatments. Because 80% of the patients had a history of diabetes, the trial results are generalizable to patients with acute ischemic stroke and type 2 diabetes.
Multiple mechanisms by which hyperglycemia may augment acute ischemic brain injury have been suggested, including increased inflammatory response and oxidative stress.27 The intention of the 12-hour eligibility window for this trial was to start treatment prior to the occurrence of substantial injury, which can occur hours to days after stroke onset.28 The median time from stroke onset to randomization in this trial was 7 hours, suggesting that treatment was initiated early enough to affect deleterious cellular mechanisms if intensive glucose lowering was beneficial.
Stroke severity may have affected the outcomes in this trial. Eighty percent of the patients had mild or moderate strokes (overall median NIHSS score of 7). The favorable natural history of this population may have mitigated a treatment effect. However, as shown in Figure 3, the favorable outcomes stratified by stroke severity did not support a differential treatment effect.
Severe hypoglycemia only occurred in the intensive treatment group. Although serious neurological decompensation was more frequent in the standard treatment group (17 patients in the standard treatment group vs 7 in the intensive treatment group), none of the cases was determined to be related to treatment. Discontinuation of treatment was more common in the intensive treatment group (24.8%) than in the standard treatment group (9.6%), mainly due to per protocol discontinuation for hypoglycemia or other adverse events (eTable 1 in Supplement 3).
The clear differentiation in glucose control between the 2 treatment groups is notable because it represents the success of the trial design and the intervention. The GIST-UK trial,9 the only other randomized efficacy trial for treating hyperglycemia during acute ischemic stroke, did not demonstrate such a differentiation in glucose control, which limited the comparison of outcomes by glucose levels. In addition, only 15% of the GIST-UK trial9 patients had known diabetes, suggesting a different patient population.
Limitations
This study has several limitations. First, 42% of the patients were enrolled by 6 of the clinical sites. The highest enrolling sites could have introduced site-specific practices that reduced the generalizability of the results. However, all sites followed the latest guidelines from the AHA/ASA for acute stroke treatment to standardize nonstudy treatments, and no differences in baseline characteristics or favorable outcome were identified.
Second, treatment with intravenous tissue plasminogen activator therapy in 63% of the patients may suggest a selection bias for patients requiring a higher level of care. However, per the trial protocol, all patients were treated in a high-level care environment suitable for intravenous insulin therapy.
Third, this trial did not capture recanalization data. Previous data suggest that hyperglycemia may impede recanalization.29
Fourth, the 2 treatment groups did not have identical sampling of glucose concentrations. The intensive treatment group had slightly more frequent glucose checks (every 1-2 hours) than the standard treatment group (every 3 hours). Although both groups had frequent glucose checks, the sampling differences could have resulted in more reported cases of hypoglycemia in the intensive treatment group.
Conclusions
Among patients with acute ischemic stroke and hyperglycemia, treatment with intensive vs standard glucose control for up to 72 hours did not result in a significant difference in favorable functional outcome at 90 days. These findings do not support using intensive glucose control in this setting.
Trial protocol
Statistical analysis plan
Complete listing of committees and coordinating centers in the SHINE Trial
SHINE participating sites that enrolled 0 patients
List of nonauthor contributors
eTable 1. Additional baseline and treatment information of the patients
eTable 2. Secondary analyses of primary and secondary outcomes
eTable 3. Baseline characteristics and treatment information by highest enrolling sites vs all other sites by treatment group
eFigure 1. Primary efficacy outcome, according to subgroups
eFigure 2. Relative risk and 95% confidence intervals for reported serious adverse events
Data Sharing Statement
References
- 1.Williams LS, Rotich J, Qi R, et al. Effects of admission hyperglycemia on mortality and costs in acute ischemic stroke. Neurology. 2002;59(1):67-71. doi: 10.1212/WNL.59.1.67 [DOI] [PubMed] [Google Scholar]
- 2.Capes SE, Hunt D, Malmberg K, Pathak P, Gerstein HC. Stress hyperglycemia and prognosis of stroke in nondiabetic and diabetic patients: a systematic overview. Stroke. 2001;32(10):2426-2432. doi: 10.1161/hs1001.096194 [DOI] [PubMed] [Google Scholar]
- 3.Desilles JP, Meseguer E, Labreuche J, et al. Diabetes mellitus, admission glucose, and outcomes after stroke thrombolysis: a registry and systematic review. Stroke. 2013;44(7):1915-1923. doi: 10.1161/STROKEAHA.111.000813 [DOI] [PubMed] [Google Scholar]
- 4.Baird TA, Parsons MW, Phan T, et al. Persistent poststroke hyperglycemia is independently associated with infarct expansion and worse clinical outcome [published correction appears in Stroke. 2013;44(9):e118]. Stroke. 2003;34(9):2208-2214. doi: 10.1161/01.STR.0000085087.41330.FF [DOI] [PubMed] [Google Scholar]
- 5.Shimoyama T, Kimura K, Uemura J, Saji N, Shibazaki K. Elevated glucose level adversely affects infarct volume growth and neurological deterioration in non-diabetic stroke patients, but not diabetic stroke patients. Eur J Neurol. 2014;21(3):402-410. doi: 10.1111/ene.12280 [DOI] [PubMed] [Google Scholar]
- 6.Ahmed N, Dávalos A, Eriksson N, et al. ; SITS Investigators . Association of admission blood glucose and outcome in patients treated with intravenous thrombolysis: results from the Safe Implementation of Treatments in Stroke International Stroke Thrombolysis Register (SITS-ISTR). Arch Neurol. 2010;67(9):1123-1130. doi: 10.1001/archneurol.2010.210 [DOI] [PubMed] [Google Scholar]
- 7.Masrur S, Cox M, Bhatt DL, et al. Association of acute and chronic hyperglycemia with acute ischemic stroke outcomes post-thrombolysis: findings from get with the guidelines-stroke. J Am Heart Assoc. 2015;4(10):e002193. doi: 10.1161/JAHA.115.002193 [DOI] [PMC free article] [PubMed] [Google Scholar]
- 8.MacDougall NJJ, Muir KW. Hyperglycaemia and infarct size in animal models of middle cerebral artery occlusion: systematic review and meta-analysis. J Cereb Blood Flow Metab. 2011;31(3):807-818. doi: 10.1038/jcbfm.2010.210 [DOI] [PMC free article] [PubMed] [Google Scholar]
- 9.Gray CS, Hildreth AJ, Sandercock PA, et al. ; GIST Trialists Collaboration . Glucose-potassium-insulin infusions in the management of post-stroke hyperglycaemia: the UK Glucose Insulin in Stroke Trial (GIST-UK). Lancet Neurol. 2007;6(5):397-406. doi: 10.1016/S1474-4422(07)70080-7 [DOI] [PubMed] [Google Scholar]
- 10.Bruno A, Kent TA, Coull BM, et al. Treatment of Hyperglycemia in Ischemic Stroke (THIS): a randomized pilot trial. Stroke. 2008;39(2):384-389. doi: 10.1161/STROKEAHA.107.493544 [DOI] [PubMed] [Google Scholar]
- 11.Johnston KC, Hall CE, Kissela BM, Bleck TP, Conaway MR; GRASP Investigators . Glucose Regulation in Acute Stroke Patients (GRASP) trial: a randomized pilot trial. Stroke. 2009;40(12):3804-3809. doi: 10.1161/STROKEAHA.109.561498 [DOI] [PMC free article] [PubMed] [Google Scholar]
- 12.Bellolio MF, Gilmore RM, Ganti L. Insulin for glycaemic control in acute ischaemic stroke. Cochrane Database Syst Rev. 2014;2014(1):CD005346. [DOI] [PMC free article] [PubMed] [Google Scholar]
- 13.Powers WJ, Rabinstein AA, Ackerson T, et al. ; American Heart Association Stroke Council . 2018 guidelines for the early management of patients with acute ischemic stroke: a guideline for healthcare professionals from the American Heart Association/American Stroke Association. Stroke. 2018;49(3):e46-e110. doi: 10.1161/STR.0000000000000158 [DOI] [PubMed] [Google Scholar]
- 14.Bruno A, Durkalski VL, Hall CE, et al. ; SHINE Investigators . The Stroke Hyperglycemia Insulin Network Effort (SHINE) trial protocol: a randomized, blinded, efficacy trial of standard vs intensive hyperglycemia management in acute stroke. Int J Stroke. 2014;9(2):246-251. doi: 10.1111/ijs.12045 [DOI] [PMC free article] [PubMed] [Google Scholar]
- 15.Zhao W, Durkalski V. Managing competing demands in the implementation of response-adaptive randomization in a large multicenter phase III acute stroke trial. Stat Med. 2014;33(23):4043-4052. doi: 10.1002/sim.6213 [DOI] [PMC free article] [PubMed] [Google Scholar]
- 16.Adams HP Jr, del Zoppo G, Alberts MJ, et al. ; American Heart Association; American Stroke Association Stroke Council; Clinical Cardiology Council; Cardiovascular Radiology and Intervention Council; Atherosclerotic Peripheral Vascular Disease and Quality of Care Outcomes in Research Interdisciplinary Working Groups . Guidelines for the early management of adults with ischemic stroke. Stroke. 2007;38(5):1655-1711. doi: 10.1161/STROKEAHA.107.181486 [DOI] [PubMed] [Google Scholar]
- 17.Del Zoppo GJ, Saver JL, Jauch EC, Adams HP Jr; American Heart Association Stroke Council . Expansion of the time window for treatment of acute ischemic stroke with intravenous tissue plasminogen activator: a science advisory from the American Heart Association/American Stroke Association. Stroke. 2009;40(8):2945-2948. doi: 10.1161/STROKEAHA.109.192535 [DOI] [PMC free article] [PubMed] [Google Scholar]
- 18.Jauch EC, Saver JL, Adams HP Jr, et al. ; American Heart Association Stroke Council; Council on Cardiovascular Nursing; Council on Peripheral Vascular Disease; Council on Clinical Cardiology . Guidelines for the early management of patients with acute ischemic stroke: a guideline for healthcare professionals from the American Heart Association/American Stroke Association. Stroke. 2013;44(3):870-947. doi: 10.1161/STR.0b013e318284056a [DOI] [PubMed] [Google Scholar]
- 19.Adams HP Jr, Leclerc JR, Bluhmki E, Clarke W, Hansen MD, Hacke W. Measuring outcomes as a function of baseline severity of ischemic stroke. Cerebrovasc Dis. 2004;18(2):124-129. doi: 10.1159/000079260 [DOI] [PubMed] [Google Scholar]
- 20.Williams LS, Weinberger M, Harris LE, Clark DO, Biller J. Development of a stroke-specific quality of life scale. Stroke. 1999;30(7):1362-1369. doi: 10.1161/01.STR.30.7.1362 [DOI] [PubMed] [Google Scholar]
- 21.Fisher M, Albers GW, Donnan GA, et al. ; Stroke Therapy Academic Industry Roundtable IV . Enhancing the development and approval of acute stroke therapies: stroke therapy academic industry roundtable. Stroke. 2005;36(8):1808-1813. doi: 10.1161/01.STR.0000173403.60553.27 [DOI] [PubMed] [Google Scholar]
- 22.Hill MD, Martin RH, Palesch YY, et al. ; ALIAS Investigators; Neurological Emergencies Treatment Trials Network . The albumin in acute stroke part 1 trial: an exploratory efficacy analysis. Stroke. 2011;42(6):1621-1625. doi: 10.1161/STROKEAHA.110.610980 [DOI] [PMC free article] [PubMed] [Google Scholar]
- 23.National Institute of Neurological Disorders and Stroke rt-PA Stroke Study Group . Tissue plasminogen activator for acute ischemic stroke. N Engl J Med. 1995;333(24):1581-1587. doi: 10.1056/NEJM199512143332401 [DOI] [PubMed] [Google Scholar]
- 24.Staszewski J, Brodacki B, Kotowicz J, Stepien A. Intravenous insulin therapy in the maintenance of strict glycemic control in nondiabetic acute stroke patients with mild hyperglycemia. J Stroke Cerebrovasc Dis. 2011;20(2):150-154. doi: 10.1016/j.jstrokecerebrovasdis.2009.11.013 [DOI] [PubMed] [Google Scholar]
- 25.McCormick M, Hadley D, McLean JR, Macfarlane JA, Condon B, Muir KW. Randomized, controlled trial of insulin for acute poststroke hyperglycemia. Ann Neurol. 2010;67(5):570-578. [DOI] [PubMed] [Google Scholar]
- 26.Rosso C, Corvol JC, Pires C, et al. Intensive versus subcutaneous insulin in patients with hyperacute stroke: results from the randomized INSULINFARCT trial. Stroke. 2012;43(9):2343-2349. doi: 10.1161/STROKEAHA.112.657122 [DOI] [PubMed] [Google Scholar]
- 27.Garg R, Chaudhuri A, Munschauer F, Dandona P. Hyperglycemia, insulin, and acute ischemic stroke: a mechanistic justification for a trial of insulin infusion therapy. Stroke. 2006;37(1):267-273. doi: 10.1161/01.STR.0000195175.29487.30 [DOI] [PubMed] [Google Scholar]
- 28.Anrather J, Iadecola C. Inflammation and stroke: an overview. Neurotherapeutics. 2016;13(4):661-670. doi: 10.1007/s13311-016-0483-x [DOI] [PMC free article] [PubMed] [Google Scholar]
- 29.Ribo M, Molina C, Montaner J, et al. Acute hyperglycemia state is associated with lower tPA-induced recanalization rates in stroke patients. Stroke. 2005;36(8):1705-1709. doi: 10.1161/01.STR.0000173161.05453.90.9f [DOI] [PubMed] [Google Scholar]
Associated Data
This section collects any data citations, data availability statements, or supplementary materials included in this article.
Supplementary Materials
Trial protocol
Statistical analysis plan
Complete listing of committees and coordinating centers in the SHINE Trial
SHINE participating sites that enrolled 0 patients
List of nonauthor contributors
eTable 1. Additional baseline and treatment information of the patients
eTable 2. Secondary analyses of primary and secondary outcomes
eTable 3. Baseline characteristics and treatment information by highest enrolling sites vs all other sites by treatment group
eFigure 1. Primary efficacy outcome, according to subgroups
eFigure 2. Relative risk and 95% confidence intervals for reported serious adverse events
Data Sharing Statement